. 2021 Nov 29;12(1):56.
doi: 10.1007/s12672-021-00452-3.

Deep analysis of neuroblastoma core regulatory circuitries using online databases and integrated bioinformatics shows their pan-cancer roles as prognostic predictors

Affiliations

Deep analysis of neuroblastoma core regulatory circuitries using online databases and integrated bioinformatics shows their pan-cancer roles as prognostic predictors

Leila Jahangiri et al. Discov Oncol. .

Abstract

Aim: Neuroblastoma is a heterogeneous childhood cancer derived from the neural crest. The dual cell identities of neuroblastoma include Mesenchymal (MES) and Adrenergic (ADRN). These identities are conferred by a small set of tightly-regulated transcription factors (TFs) binding super enhancers, collectively forming core regulatory circuitries (CRCs). The purpose of this study was to gain a deep understanding of the role of MES and ADRN TFs in neuroblastoma and other cancers as potential indicators of disease prognosis, progression, and relapse.

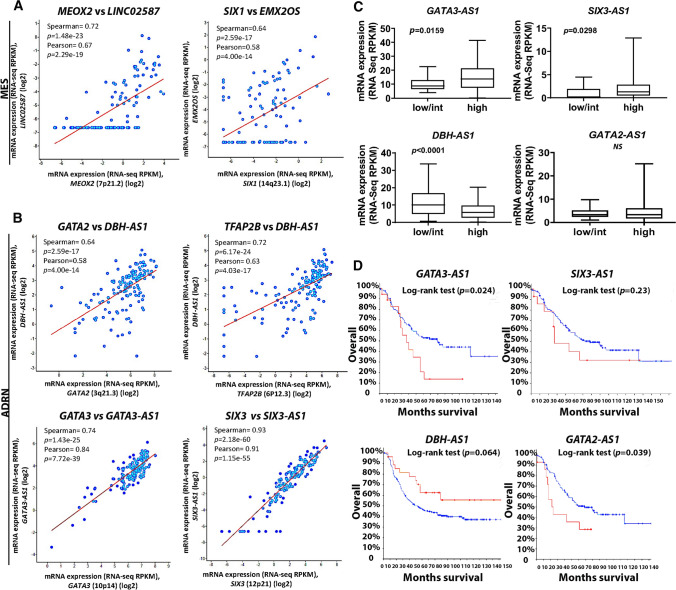
Methods: To that end, we first investigated the expression and mutational profile of MES and ADRN TFs in neuroblastoma. Moreover, we established their correlation with neuroblastoma risk groups and overall survival while establishing their extended networks with long non-coding RNAs (lncRNAs). Furthermore, we analysed the pan-cancer expression and mutational profile of these TFs and their correlation with patient survival and finally their network connectivity, using a panel of bioinformatic tools including GEPIA2, human pathology atlas, TIMER2, Omicsnet, and Cytoscape.

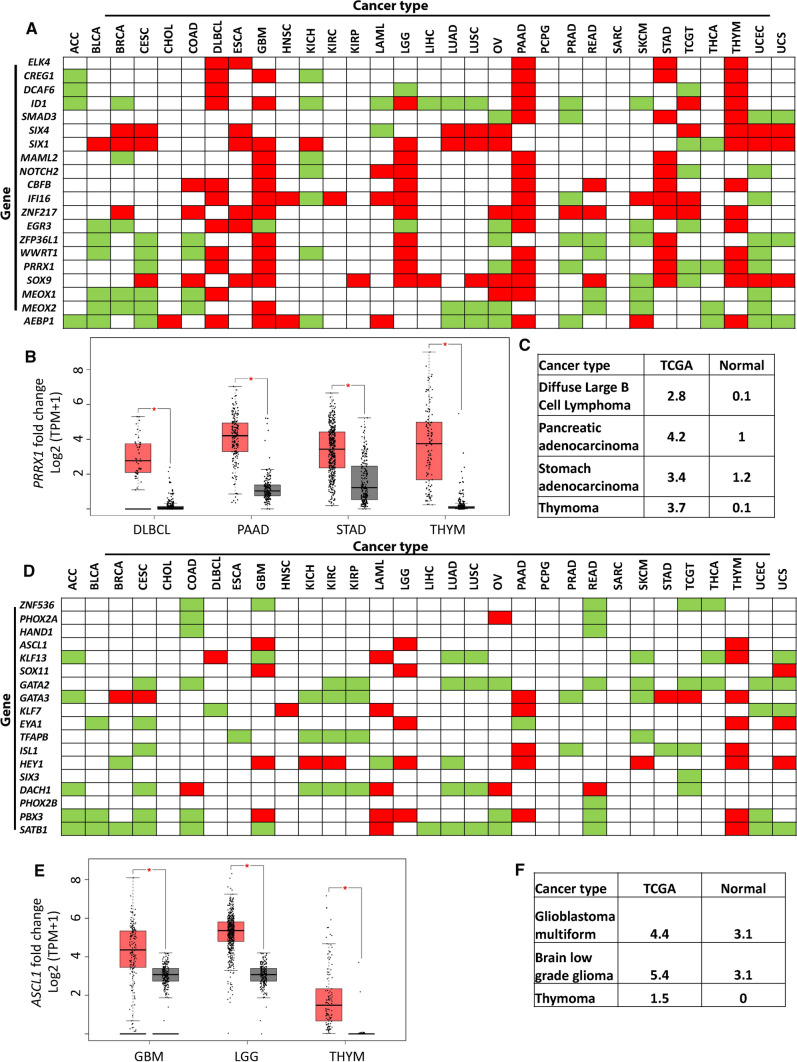
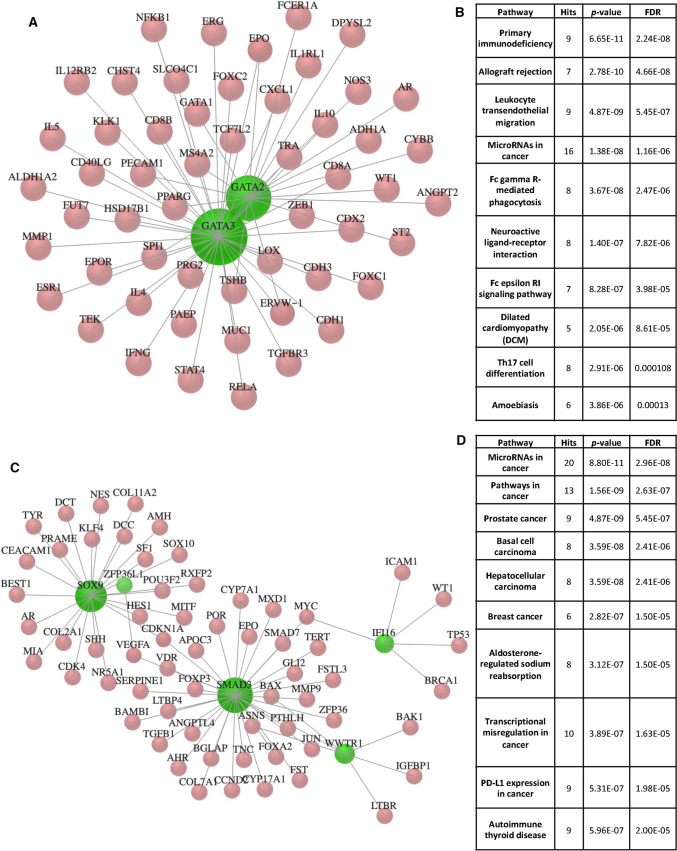
Results: We show the association of multiple MES and ADRN TFs with neuroblastoma risk groups and overall survival and find significantly higher expression of various MES and ADRN TFs compared to normal tissues and their association with overall survival and disease-free survival in multiple cancers. Moreover, we report the strong correlation of the expression of these TFs with the infiltration of stromal and immune cells in the tumour microenvironment and with stemness and metastasis-related genes. Furthermore, we reveal extended pan-cancer networks comprising these TFs that influence the tumour microenvironment and metastasis and may be useful indicators of cancer prognosis and patient survival.

Conclusion: Our meta-analysis shows the significance of MES and ADRN TFs as indicators of patient prognosis and the putative utility of these TFs as potential novel biomarkers.

Keywords: Core regulatory circuitry; Differentiation; Gene networks; Neuroblastoma; Solid cancers; Tumour microenvironment.


Conflict of interest statement

The authors declare that they have no competing interests.

Figures

Fig. 1
Fig. 1
ADRN and MES TF expression correlates with NB risk group and OS. A 8 ADRN TFs significantly correlate with NB risk (student t-test). SATB1, GATA2, TFAP2B, KLF13, KLF7 and PBX3 are downregulated in high-risk NB cases, while SIX3 and GATA3 are upregulated in this group (although the latter is not significant). B 8 MES TFs significantly correlate with NB risk (student t-test). MEOX1, CBFB and DCAF6 are downregulated in high-risk NB cases, while SMAD3, ID1, SOX11, ZNF217 and EGR3 are upregulated in the high NB risk group. Data shown are representative of 143 samples from NB tissue processed for RNA sequencing (TARGET, 2018). Low, intermediate, and high-risk cases have an EFS of 75–85%, 50–75% or < 50% respectively. NS: not significant
Fig. 2
Fig. 2
LncRNAs are co-expressed with MES and ADRN TFs and are associated with risk groups and survival of NB patients. A, B 6 TFs positively correlate with 6 lncRNAs, obtained from RNA sequencing data from 143 NB patient tissue samples (TARGET, 2018) (2 lncRNAs for MES (A) and 4 for ADRN (B) TFs). C, D LncRNAs are associated with NB risk group; for instance, GATA3-AS1 and SIX3-AS1 are overexpressed in high-risk NB (C) and survival in the same cohorts of patients. GATA3-AS1 and SIX3-AS1 are also upregulated in patients with lower OS, despite the latter not being significant (D) (red and blue lines represent increased and reduced expression, respectively). However, GATA2-AS1 expression is not associated with NB groups, while it is upregulated in patients with reduced survival. GATA2-AS1, GATA3-AS1 and SIX3-AS1 survival data were obtained from RNA sequencing of 143 NB patient tissue, and DBH-AS1 survival data were reported from Agilent microarray of 249 NB samples (TARGET, 2018). Statistics was calculated on mean ± SEM with student`s t test in (C). NS: not significant, SEM: standard error of mean
Fig. 3
Fig. 3
Gene expression analysis of MES TFs in 31 cancer types. A Expression of TFs in cancer types based on TCGA records in comparison to matched normal tissue: significant overexpression in TCGA over normal tissue is displayed in red, while overexpression in normal tissue compared to TCGA data are displayed in green. B PRRX1 is significantly overexpressed in TCGA samples for diffuse large B cell Lymphoma (DLBCL), pancreatic adenocarcinoma (PAAD), thymoma (THYM) and stomach adenocarcinoma (STAD) tumours compared to normal samples expressed in log2 (TPM + 1), C PRRX1 gene expression fold change in TCGA in comparison to normal samples. The parameters for this analysis were set as Log2FC cut-off of 1 and p-value < 0.01. One-way ANOVA was used to test for differences in expression between normal and cancer tissue. D Expression of TFs in cancer types based on TCGA records in comparison to matched normal tissue, significant overexpression in TCGA over normal is displayed in red, while overexpression in normal over TCGA is displayed in green. E ASCL1 is significantly overexpressed in TCGA samples for glioblastoma multiforme (GBM), low grade glioma (LGG) and thymoma (THYM) tumours compared to normal samples expressed in log2 (TPM + 1), F ASCL1 gene expression fold change in TCGA in comparison to normal samples. The parameters for this analysis were set as Log2FC cut-off of 1 and p-value < 0.01. One-way ANOVA was used to test for differences in expression between normal and cancer tissue
Fig. 4
Fig. 4
Kaplan Meier curves for cumulative survival, OS and DFS in cancer patients. The outcome of CREG1, SIX1 and MEOX1 expression in patients with KIRP and UCEC using Kaplan Meier curves. A For KIRP: CREG1 (HR = 1.52, p = 0.0217), SIX1 (HR = 2.04, p = 0.00046), and MEOX1 (HR = 2.25, p = 0.00098 were obtained), B for UCEC: CREG1 (HR = 1.32, p = 0.048), SIX1 (HR = 1.85, p = 0.0001), and MEOX1 (HR = 1.43, p = 0.0079) were obtained (red and blue lines representing increased and reduced expression in patients, respectively). In all cases, increased expression of these genes correlates with reduced cumulative survival of patients. CE OS and DFS Kaplan Meier curves generated by GEPIA2 for ACC patients for CBFB (top: log-rank test p = 4.9E-06, HR = 7.5, p(HR) = 7.2E-5 and bottom: log-rank test p = 0.00023, HR = 3.7, p(HR) = 0.00056), SOX11 (top: log-rank test p = 0.00032, HR = 5.2, p(HR) = 0.0012 and bottom: log-rank test p = 0.00037, HR = 3.7, p(HR) = 0.00088), and ISL1 (top: log-rank test p = 4.4E-05, HR = 6.3, p(HR) = 0.00033 and bottom: log-rank test p = 0.00031, HR = 3.7, p(HR) = 0.00073) revealing significant decreases in OS and DFS for patients. HR = Hazard risk
Fig. 5
Fig. 5
Prognostic summary and immune cell infiltration associated with MES and ADRN TFs. A Data obtained from the human pathology atlas reveals a significant association between the expression of MES and ADRN TFs providing either favourable or unfavourable predictive value in various cancers as indicated (pink and blue colours represent unfavourable and favourable prognosis, respectively). The classification of favourable and unfavourable prognosis in this database, is based on calculated survival probability expressed in respective Kaplan Meier curves. B Positive association between EGR3 expression with CAF infiltration in the TME in KIRP (p = 7.67E-08, Spearmann’s Rho = 0.327), C PAAD (p = 2.54E-05, Spearmann’s Rho = 0.316) and D STAD (p = 1.24E-10, Spearmann’s Rho = 0.323). For all plots, EPIC estimations for expression are displayed as log2 TPM and were adjusted for tumour purity. EPIC estimations allowed for the comparison of cell types within a sample and provided scores for cell fractions. CRC = Core regulatory circuitry, TF = Transcription Factor
Fig. 6
Fig. 6
Network connectivity of MES and ADRN TFs. A GATA3 and GATA2 display the highest degree of connectivity with 38 and 19 connections, respectively. B KEGG gene enrichment analysis reveals enrichment for ‘immune’ and ‘miRNA’ in cancer terms. C SMAD3, SOX9, WWTR1 and IFI16 have 32, 23, 6 and 5 connections, respectively, D KEGG gene enrichment analysis revealed enrichment for ‘breast cancer’, ‘prostate cancer’ and ‘hepatocellular cancer’ in addition to ‘miRNAs in cancer’ terms

Similar articles

Cited by

References

    1. Brodeur GM. Neuroblastoma: biological insights into a clinical enigma. Nat Rev Cancer. 2003;3:203–216. - PubMed
    1. Maris JM, Hogarty MD, Bagatell R, Cohn SL. Neuroblastoma. Lancet. 2007;369:2106–2120. - PubMed
    1. Cohn SL, Pearson ADJ, London WB, Monclair T, Ambros PF, Brodeur GM, Faldum A, Hero B, Iehara T, Machin D, et al. The International Neuroblastoma Risk Group (INRG) classification system: an INRG Task Force report. J Clin Oncol. 2009;27(2):289–297. - PMC - PubMed
    1. Bayeva N, Coll E, Piskareva O. Differentiating neuroblastoma: a systematic review of the retinoic acid, its derivatives, and synergistic interactions. J Personal Med. 2021 doi: 10.3390/jpm11030211. - DOI - PMC - PubMed
    1. van Groningen T, Koster J, Valentijn LJ, Zwijnenburg DA, Akogul N, Hasselt NE, Broekmans M, Haneveld F, Nowakowska NE, Bras J, et al. Neuroblastoma is composed of two super-enhancer-associated differentiation states. Nat Genet. 2017;49(8):1261–1266. - PubMed

LinkOut - more resources