. 2022 Mar;28(3):564-571.
doi: 10.3201/eid2803.210267.

Nowcasting (Short-Term Forecasting) of COVID-19 Hospitalizations Using Syndromic Healthcare Data, Sweden, 2020

Nowcasting (Short-Term Forecasting) of COVID-19 Hospitalizations Using Syndromic Healthcare Data, Sweden, 2020

Armin Spreco et al. Emerg Infect Dis. 2022 Mar.

Abstract

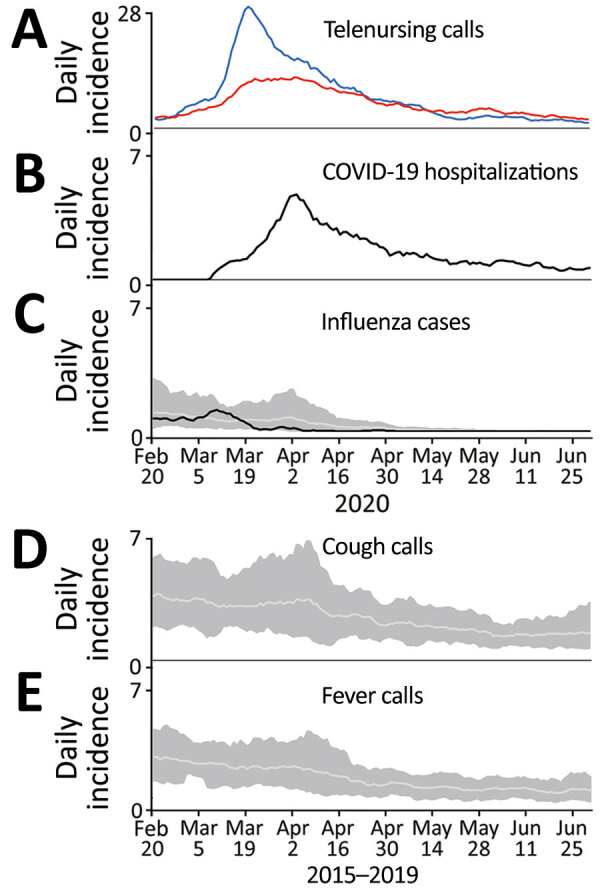
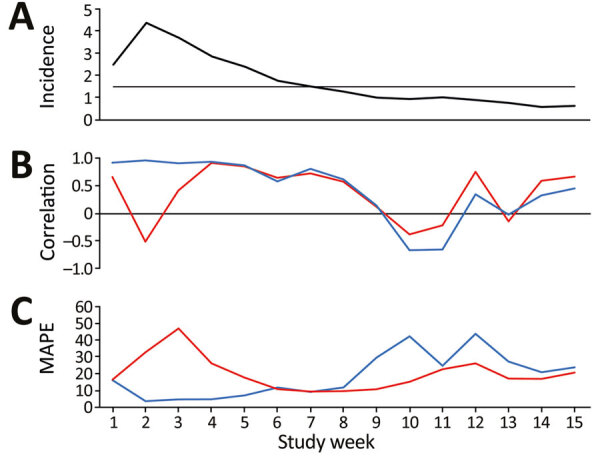
We report on local nowcasting (short-term forecasting) of coronavirus disease (COVID-19) hospitalizations based on syndromic (symptom) data recorded in regular healthcare routines in Östergötland County (population ≈465,000), Sweden, early in the pandemic, when broad laboratory testing was unavailable. Daily nowcasts were supplied to the local healthcare management based on analyses of the time lag between telenursing calls with the chief complaints (cough by adult or fever by adult) and COVID-19 hospitalization. The complaint cough by adult showed satisfactory performance (Pearson correlation coefficient r>0.80; mean absolute percentage error <20%) in nowcasting the incidence of daily COVID-19 hospitalizations 14 days in advance until the incidence decreased to <1.5/100,000 population, whereas the corresponding performance for fever by adult was unsatisfactory. Our results support local nowcasting of hospitalizations on the basis of symptom data recorded in routine healthcare during the initial stage of a pandemic.

Keywords: 2020. Emerg Infect Dis. 2022 Mar [date cited]. https://doi.org/10.3201/eid2803.210267; COVID-19; Dahlström Ö; Eriksson O; Jöud A; Källström R; SARS-CoV-2; Soltesz K; Suggested citation for this article: Spreco A; Sweden; coronavirus disease; epidemiology; et al. Nowcasting (short-term forecasting) of COVID-19 hospitalizations using syndromic healthcare data; forecasting; infectious diseases; medical informatics; nowcasting; public health; respiratory infections; severe acute respiratory syndrome coronavirus 2; viruses; zoonoses.


Figures

Figure 1
Figure 1
Daily incidence of telenursing calls for 2 chief complaints, COVID-19 hospitalizations, and laboratory-confirmed influenza plus reference data from before the COVID-19 pandemic, Östergötland County, Sweden. A) Telenursing calls per 100,000 population for chief complaints of cough by adult (blue line) and fever by adult (red line), February 20–June 30, 2020. B) COVID-19 hospitalizations per 100,000 population, February 20–June 30, 2020. C) Cases of laboratory-confirmed influenza per 100,000 population February 20–June 30, 2020 (black line). Light gray line indicates the average for cases of laboratory-confirmed influenza in 2015–2019; dark gray shaded area is the corresponding range. D) Telenursing calls per 100,000 population for the chief complaint cough by adult in 2015–2019 (light grey line) with corresponding range (dark grey shaded area). E) Telenursing calls per 100,000 population for the chief complaint fever by adult in 2015–2019 (light grey line) with corresponding range (dark grey shaded area).
Figure 2
Figure 2
Local nowcasting performance in Östergötland County, Sweden, during the first wave of coronavirus disease (COVID-19), March 22–June 30, 2020. A) Weekly average of daily incidence of COVID-19, hospitalizations/week/100,000 population. The horizontal line indicates lowest incidence for reliable predictions (1.5 daily hospitalizations/100,000 population). B) Weekly average of daily correlation between telenursing data and COVID-19 hospitalizations from the nowcasting date through the period covered by the time lag for cough by adult (blue line) and fever by adult (red line). C) Weekly average of daily MAPE per week for cough by adult (blue line) and fever by adult (red line). MAPE, mean absolute percentage error.

Similar articles

Cited by

References

    1. Paul R, Arif AA, Adeyemi O, Ghosh S, Han D. Progression of COVID-19 from urban to rural areas in the United States: a spatiotemporal analysis of prevalence rates. J Rural Health. 2020;36:591–601. 10.1111/jrh.12486 - DOI - PMC - PubMed
    1. García-Basteiro AL, Chaccour C, Guinovart C, Llupià A, Brew J, Trilla A, et al. Monitoring the COVID-19 epidemic in the context of widespread local transmission. Lancet Respir Med. 2020;8:440–2. 10.1016/S2213-2600(20)30162-4 - DOI - PMC - PubMed
    1. Gill M, Sridhar D, Godlee F. Lessons from Leicester: a covid-19 testing system that’s not fit for purpose. BMJ. 2020;370:m2690. 10.1136/bmj.m2690 - DOI - PubMed
    1. Chiolero A. Predicting covid-19 resurgence: do it locally. BMJ. 2020;370:m2731. 10.1136/bmj.m2731 - DOI - PubMed
    1. Grasselli G, Pesenti A, Cecconi M. Critical care utilization for the COVID-19 outbreak in Lombardy, Italy: early experience and forecast during an emergency response. JAMA. 2020;323:1545–6. 10.1001/jama.2020.4031 - DOI - PubMed

Publication types