. 2022 Feb 25;375(6583):859-863.
doi: 10.1126/science.aaz8777. Epub 2022 Feb 24.

Trained ILC3 responses promote intestinal defense

Affiliations

Trained ILC3 responses promote intestinal defense

Nicolas Serafini et al. Science. .

Abstract

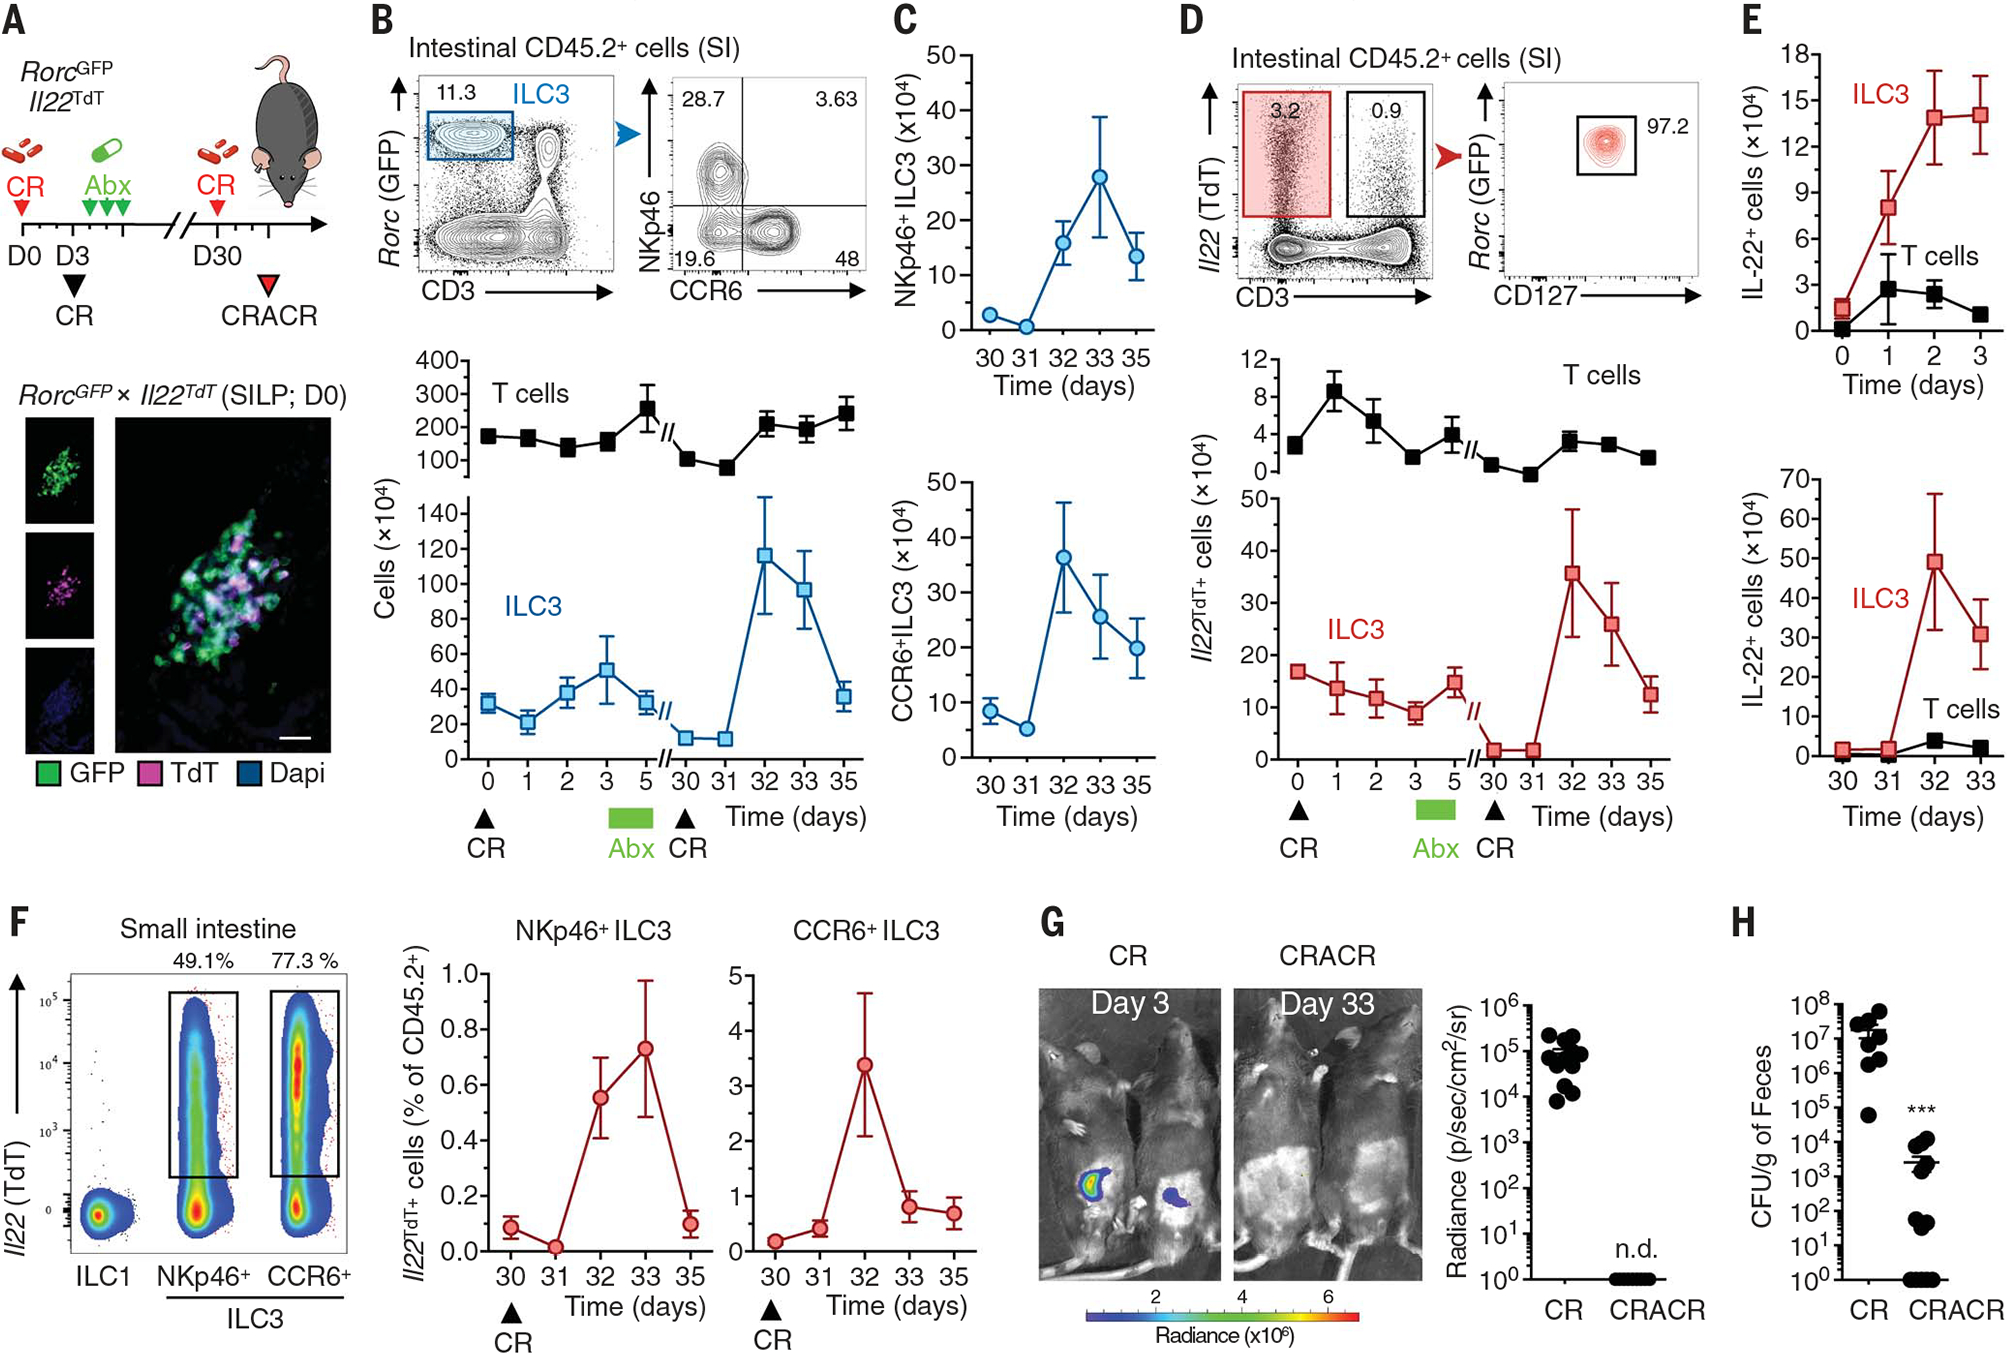
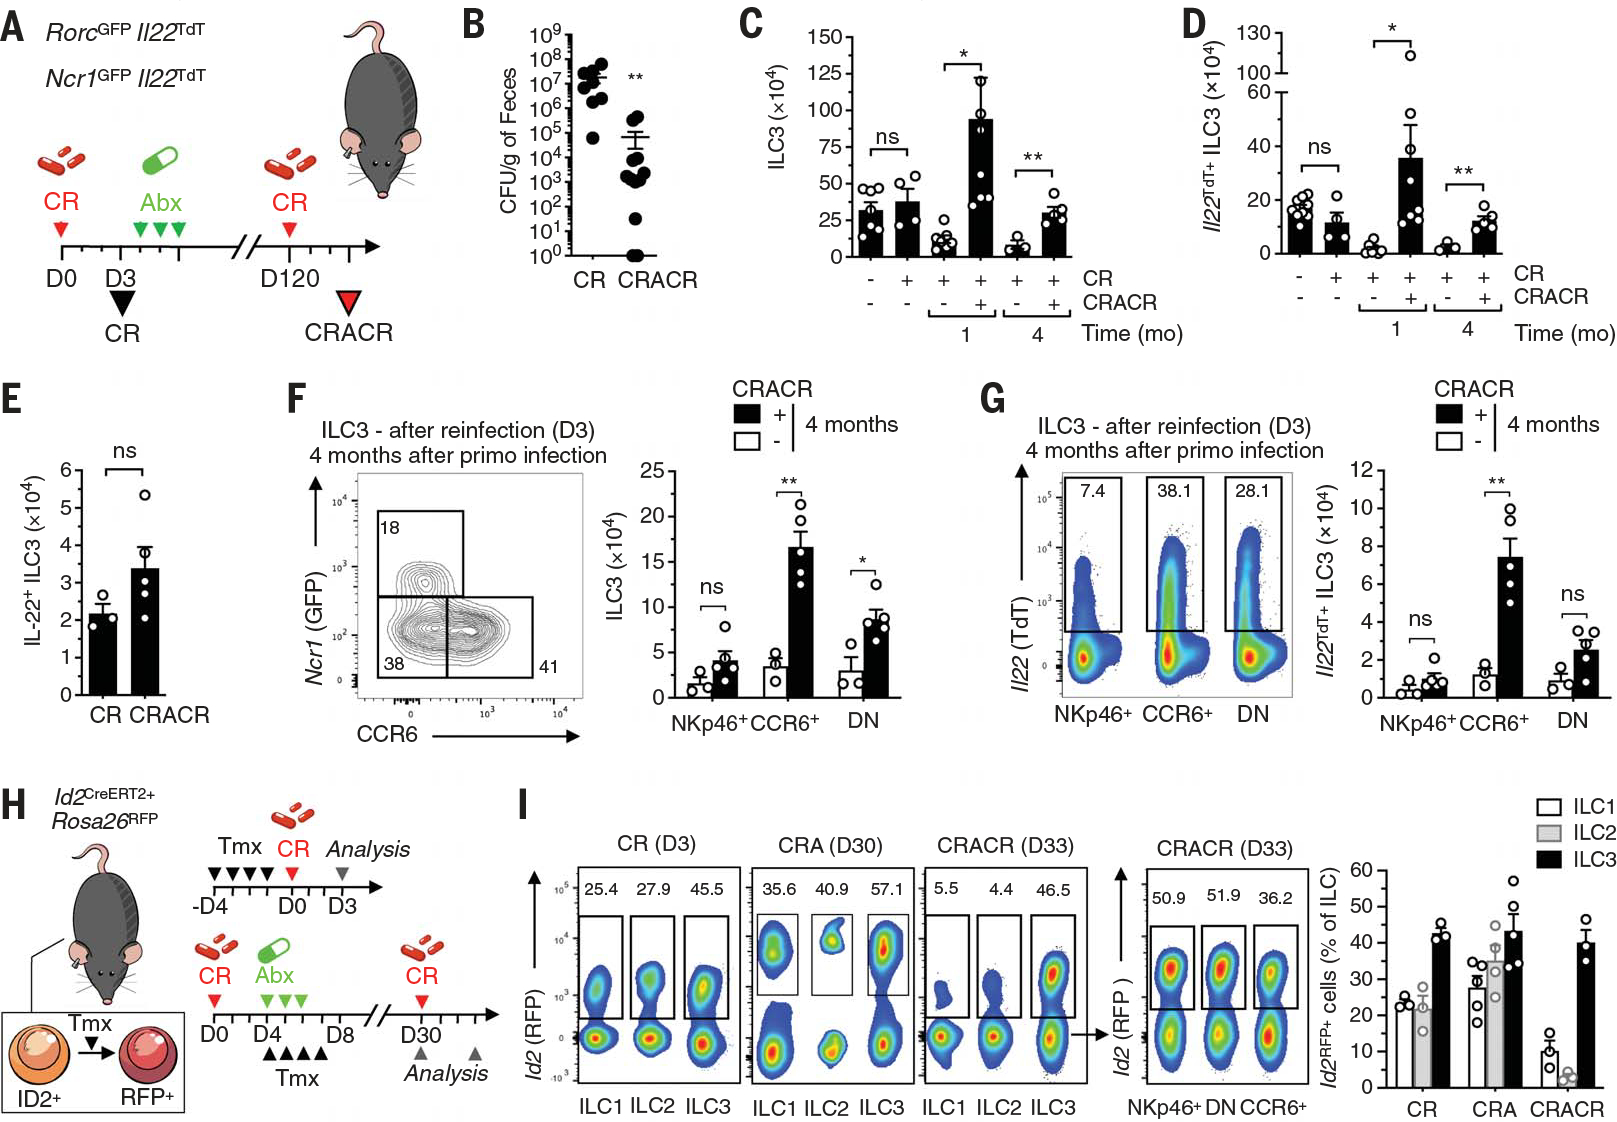
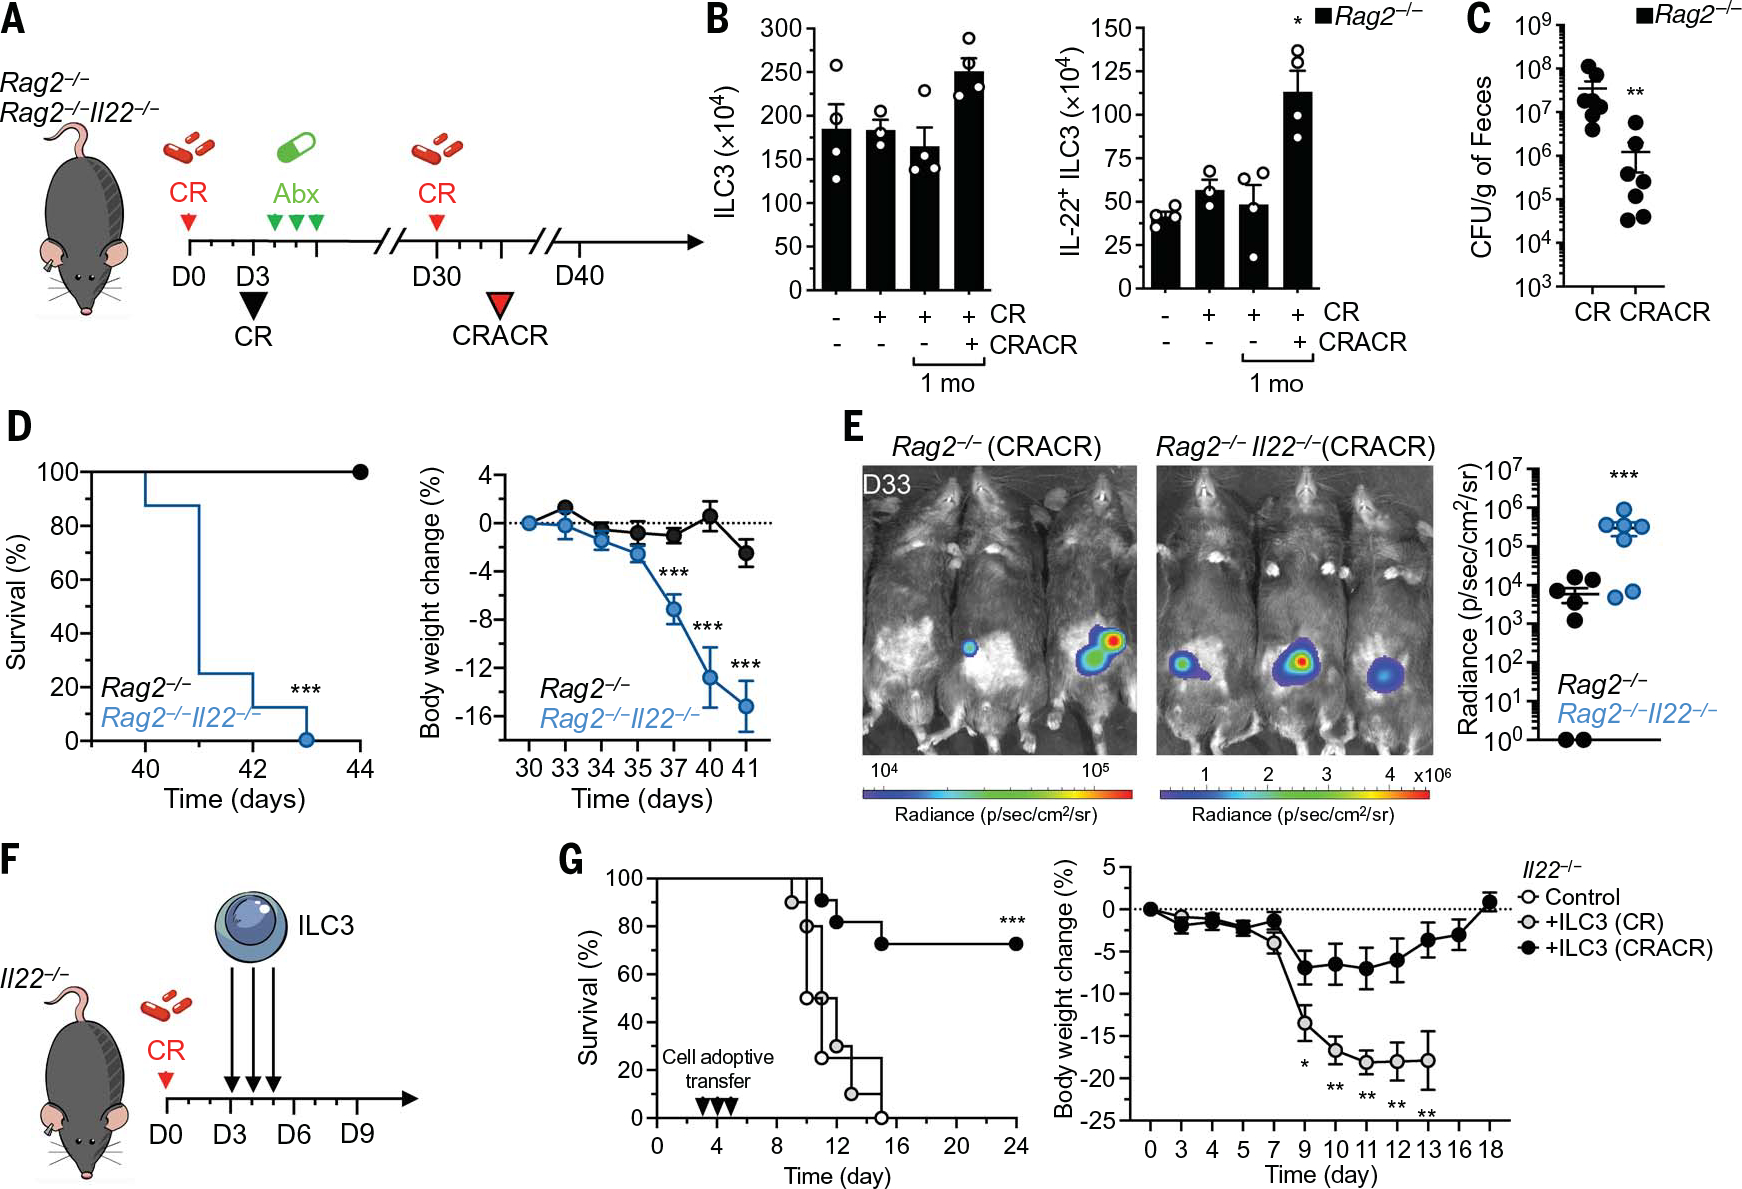
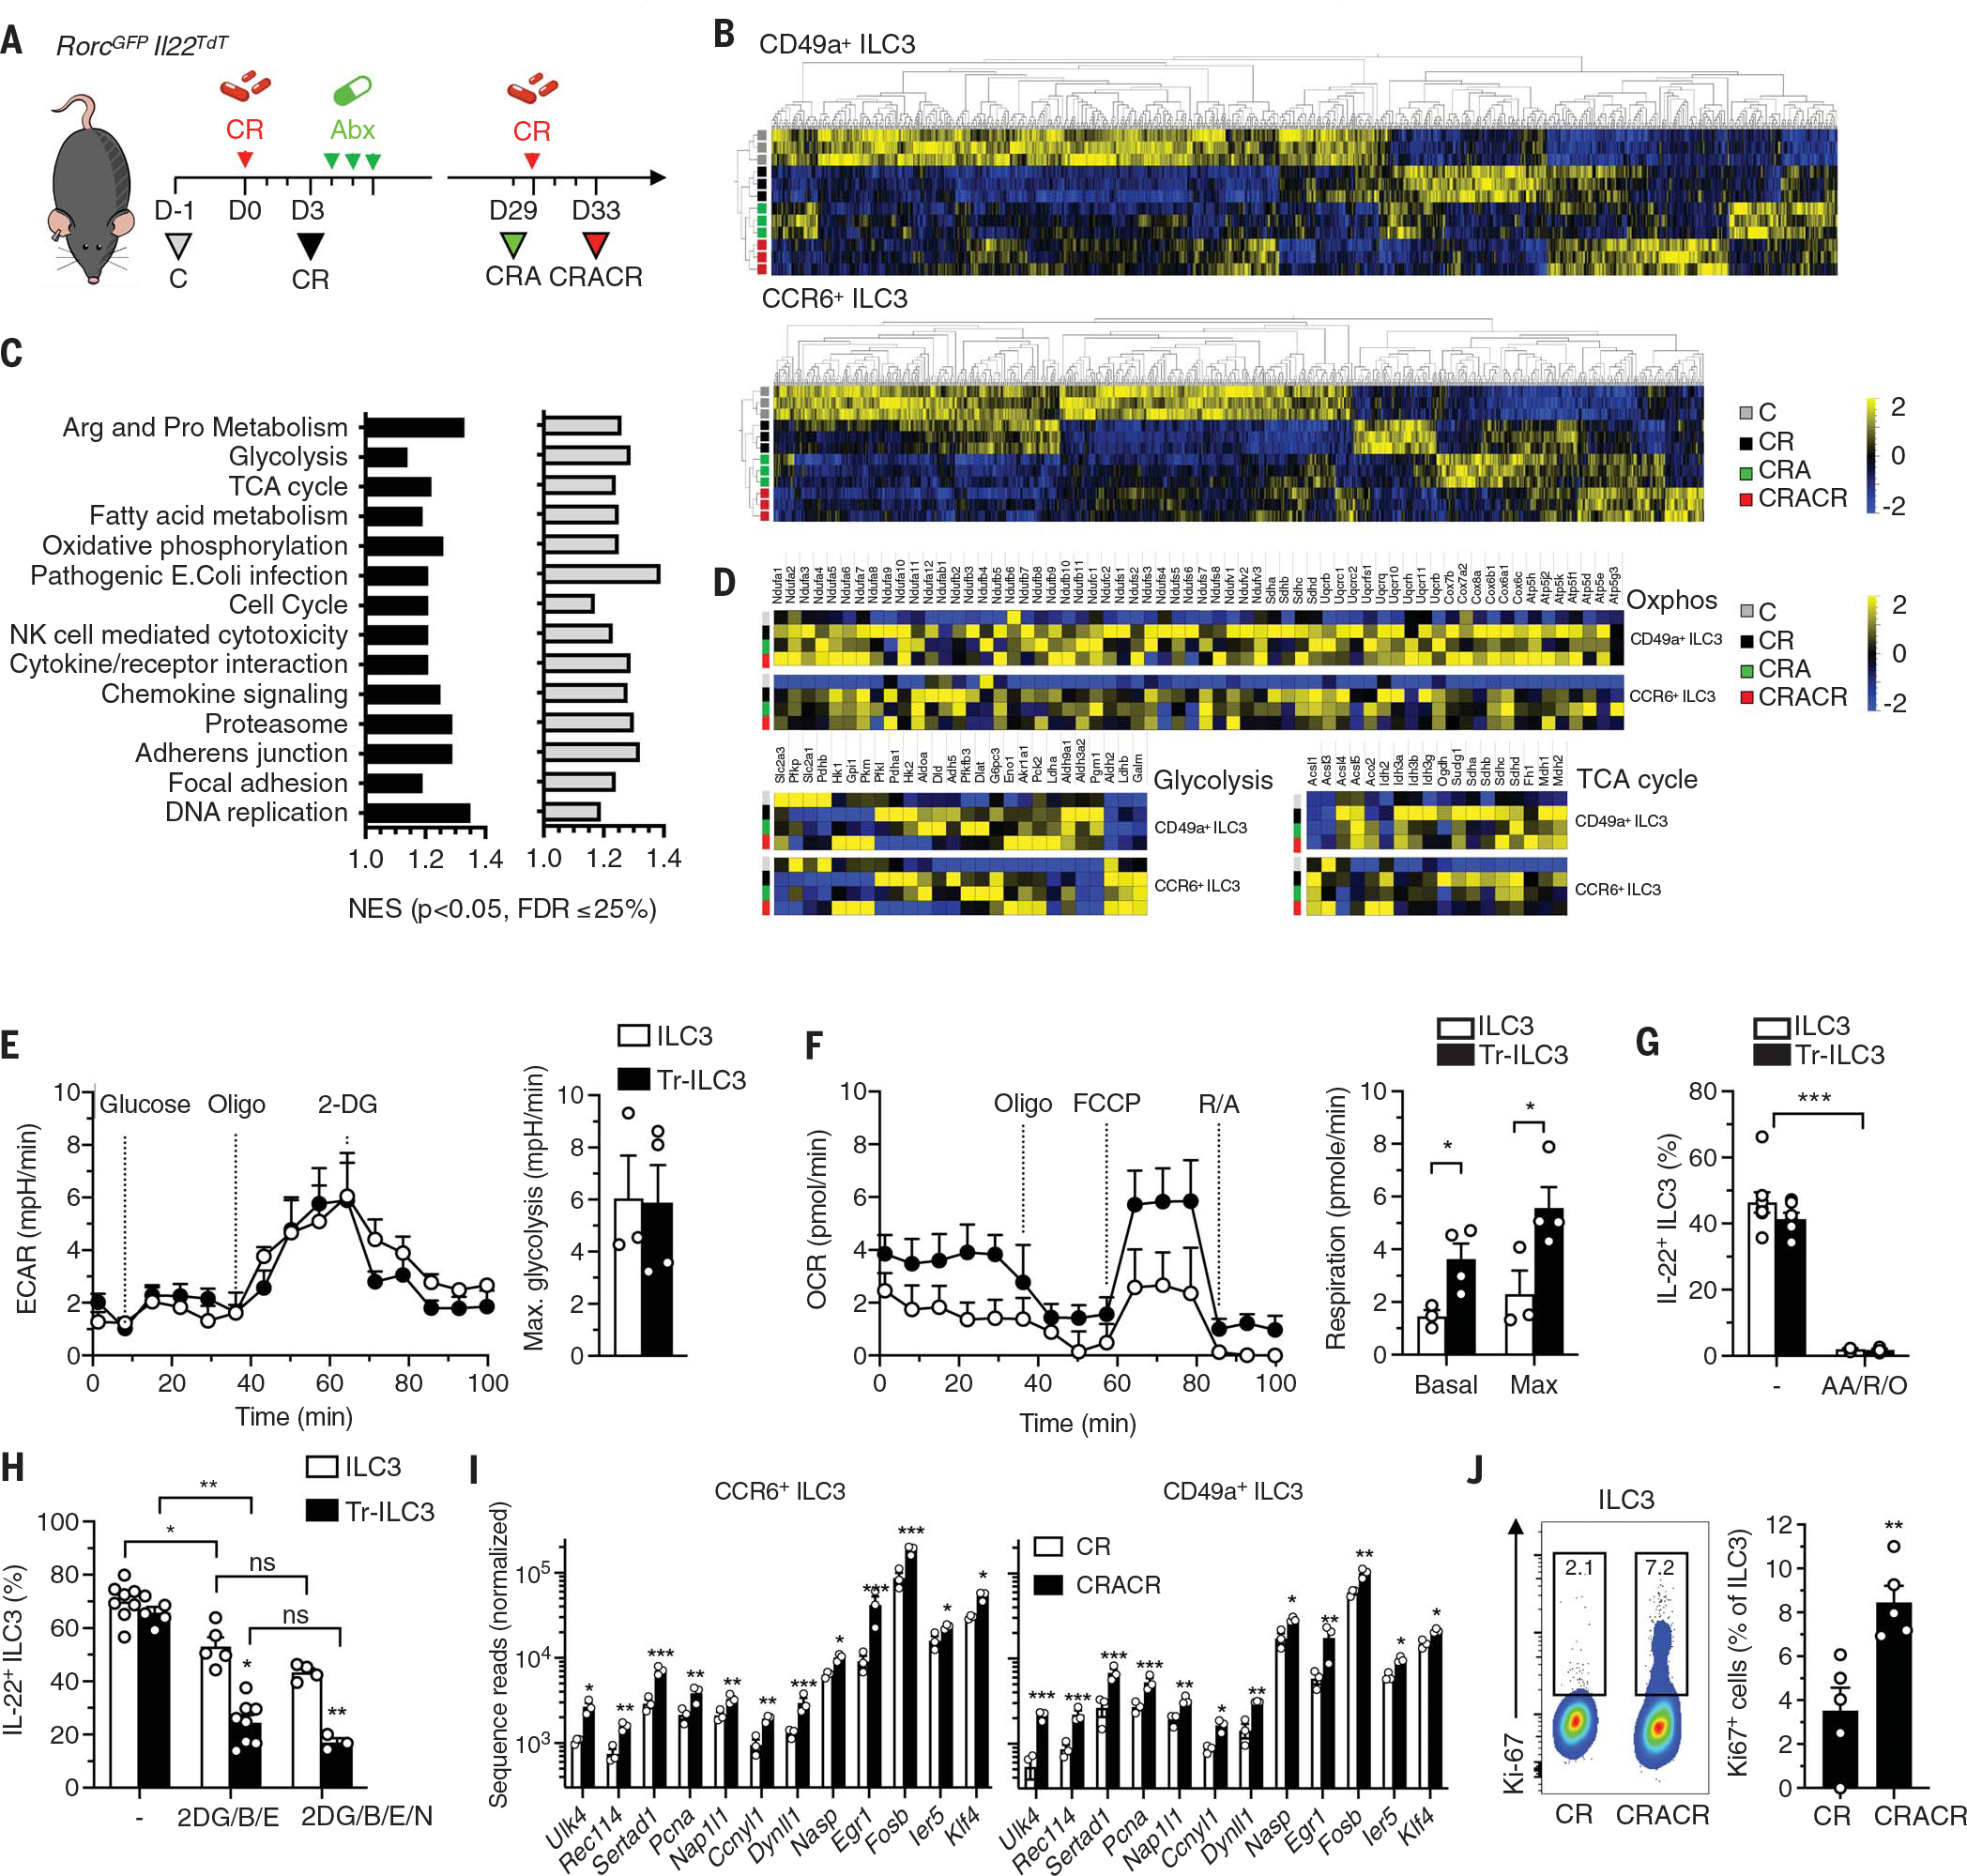
Group 3 innate lymphoid cells (ILC3s) are innate immune effectors that contribute to host defense. Whether ILC3 functions are stably modified after pathogen encounter is unknown. Here, we assess the impact of a time-restricted enterobacterial challenge to long-term ILC3 activation in mice. We found that intestinal ILC3s persist for months in an activated state after exposure to Citrobacter rodentium. Upon rechallenge, these "trained" ILC3s proliferate, display enhanced interleukin-22 (IL-22) responses, and have a superior capacity to control infection compared with naïve ILC3s. Metabolic changes occur in C. rodentium-exposed ILC3s, but only trained ILC3s have an enhanced proliferative capacity that contributes to increased IL-22 production. Accordingly, a limited encounter with a pathogen can promote durable phenotypic and functional changes in intestinal ILC3s that contribute to long-term mucosal defense.


Conflict of interest statement

Competing interests: The authors declare no competing financial interests.

Figures

Fig. 1.
Fig. 1.. Tr-ILC3s efficiently control pathogenic bacteria rechallenge.
(A) The experimental design for (B) to (H) is shown at the top. RorcGFPIl22TdT mice received ciprofloxacin (Abx; 100 mg kg−1 day−1) after C. rodentium infection (CR). One month later, the mice were reinfected with C. rodentium (CRACR). A representative steady-state immunofluorescence analysis of RORγt+ (green) and Il22TdT+ (magenta) cells in the small intestine is shown at the bottom. Nuclei were stained with 4′,6-diamidino-2-phenylindole (DAPI) (blue) (scale bar, 20 μm). SILP, small intestine lamina propria; D0, day 0. (B) Intestinal NKp46+ and CCR6+ ILC3s were analyzed by flow cytometry (top). Absolute numbers of ILC3s and T cells in the small intestine lamina propria (n = 4 to 12 for each time point) are shown at the bottom. (C) Absolute numbers of intestinal NKp46+ (top) and CCR6+ (bottom) ILC3s determined with representative data from three independent analyses (n = 3 to 7 for each time point). (D) Small intestinal Il22TdT+ ILC3 (CD45+CD3RorcGFP+) and T cell (CD45+CD3+) frequencies at day 0 (top). Absolute numbers of Il22TdT+ cells were determined with representative data from six independent analyses (n = 4 to 12 for each time point) (bottom). (E) Absolute numbers of IL-22+ (protein) cells were analyzed after ex vivo IL-23 (top) and IL-1β (bottom) stimulation (n = 4 to 9 for each time point). (F) Il22TdT expression in ILC1s (CD3NKp46+NK1.1+), NKp46+ ILC3s, and CCR6+ ILC3s (left). Representative data are from three independent analyses. The frequencies of Il22TdT+NKp46+ and NKp46 ILC3 subsets in the small intestine lamina propria after reinfection are shown on the right (CRACR; n = 3 to 7 for each time point). (G) C. rodentium growth monitored by IVIS imaging (CR, n = 12; CRACR, n = 12). Representative pseudocolor images are shown (color scale in photons s−1 cm−2 sr−1). (H) Fecal C. rodentium counts (CR, n = 8; CRACR, n = 13). Data are representative of three independent experiments. Each graph corresponds to the mean ± SEM of the values obtained. n.d. indicates not detected and ***P < 0.001 using two-tailed Mann-Whitney test.
Fig. 2.
Fig. 2.. Tr-ILC3s show long-term persistence.
(A) Experimental design for (B) to (H). RorcGFP×Il22TdT and Ncr1GFP×Il22TdT mice received ciprofloxacin (Abx; 100 mg kg−1 day−1) after C. rodentium infection. Four months later, the mice were reinfected with C. rodentium (CRACR). (B) Fecal C. rodentium counts (CR, n = 8; CRACR, n = 12). CFU, colony forming units. (C and D) Absolute numbers of total (C) (n = 3 to 8) and Il22TdT+ (D) (n = 3 to 9) ILC3s in the small intestine lamina propria. (E) Absolute numbers of intestinal IL-22+ ILC3s (protein; n = 3 to 5) after ex vivo IL-23 and IL-1β stimulation 3 days after infection or reinfection. (F and G) Frequency and absolute numbers of ILC3s (F) and Il22TdT+ ILC3 (G) subsets in CRACR mice were determined (n = 3 to 5). DN, double negative. (H) Fate-mapping protocol. Id2CreERT2+×Rosa26RFP mice received ciprofloxacin (Abx; 100 mg kg−1 day−1) 3 days after C. rodentium infection. Mice received tamoxifen (Tmx) by intraperitoneal injection and were analyzed as shown. (I) Analysis of Id2RFP+ cells in ILC1 (CD3 NKp46+NK1.1+), ILC2 (CD3CD127+ CD90.2+KLRG1+), and ILC3 subsets (left) for the protocol shown in (H). Percentages of Id2RFP+ cells of the total ILCs in CR, CRA, and CRACR mice were determined (n = 3 to 5) (right). Each graph corresponds to the mean ± SEM of the values obtained. ns indicates not significant, *P < 0.05, and **P < 0.01 using two-tailed Mann-Whitney test.
Fig. 3.
Fig. 3.. Tr-ILC3s show enhanced IL-22–mediated protection.
(A) Experimental design for (B) to (E). Rag2−/− and Rag2−/− Il22−/− mice received ciprofloxacin (Abx; 100 mg kg−1 day−1) after C. rodentium infection. One month later, the mice were reinfected with CR (CRACR). (B) Analysis of ILC3s (left) and IL-22+ ILC3s (right) in Rag2−/− mice (n = 3 to 4). (C) Fecal C. rodentium counts (n = 7). (D) Survival (left) and body weight (right) in reinfected Rag2−/− and Rag2−/− IL22−/− mice (n = 7). (E) C. rodentium growth monitored by IVIS imaging 3 days after reinfection (left). Relative C. rodentium growth was determined in Rag2−/− and Rag2−/− IL22−/− mice (n = 7) (right). (F) Experimental design for (G). ILC3s were purified from infected (CR) or reinfected (CRACR) mice 3 days after infection and transferred into C. rodentium–infected Il22−/− mice. (G) Survival and body weight were assessed at the indicated times after infection [n = 4 for Il22−/− and ILC3 (CR); n = 10 for Il22−/− and ILC3 (CRACR); n = 11 for Il22−/− per group, pool of two independent experiments]. Each graph corresponds to the mean ± SEM of the values obtained. *P < 0.05, **P < 0.01, and ***P < 0.001 using Krustal-Wallis test (B), two-tailed Mann-Whitney test [(C) to (G)], or log-rank (Mantel-Cox) test [(D) and (G)].
Fig. 4.
Fig. 4.. Gene expression analysis and metabolic profiles of Tr-ILC3s.
(A) CCR6+ and CD49a+ ILC3 from naïve (C) and infected mice (CR, CRA, and CRACR) were sorted for RNA-seq analysis. (B and C) A heatmap showing the relative expression levels of differentially expressed genes is shown in (B). In (C), pathway analysis was performed and gene pathways were organized into clusters to compare CR, CRA, and CRACR conditions to C (n = 3). FDR, false discovery rate; NES, normalized enrichment score. (D) Heatmap with clustering of differentially expressed metabolism-associated genes (n = 3). (E and F) Seahorse analysis of freshly sorted ILC3s (C) and Tr-ILC3s (CRACR) in response to a mitochondrial uncoupler [fluoro-carbonylcyanide phenylhydrazone (FCCP)], oligomycin (oligo), rotenone and antimycin (R/A), and 2-DG. Representative metabolic profiles (OCR and ECAR), glycolysis, and respiration were determined (three independent experiments; n = 3 to 4). (G) Effect of OXPHOS inhibition (18 hours) on IL-22 production by intestinal ILC3s (n = 5). AA, antimycin; R, rotenone; O, oligomycin. (H) Effect of metabolic pathway inhibition (2 hours) on IL-22 production by intestinal ILC3s (two independent experiments; n = 3 to 8). B, BPTES; E, etomoxir; N, Nor-NOHA. (I) Differentially expressed genes in CR and CRACR ILC3s (n = 3). (J) Frequency of Ki67+ ILC3 from infected (CR) and reinfected (CRACR) mice (two independent experiments; n = 5). Each graph corresponds to the mean ± SEM of the values obtained. ns indicates not significant, *P < 0.05, **P < 0.01, and ***P < 0.001 using two-tailed unpaired Student’s t test [(E) and (F)], two-tailed Mann-Whitney test [(G) and (J)], or Krustal-Wallis test (H).

References

    1. Hooper LV, Macpherson AJ, Nat. Rev. Immunol. 10, 159–169 (2010). - PubMed
    1. Spits H et al., Nat. Rev. Immunol. 13, 145–149 (2013). - PubMed
    1. Sonnenberg GF, Artis D, Nat. Med. 21, 698–708 (2015). - PMC - PubMed
    1. Klose CSN, Artis D, Nat. Immunol. 17, 765–774 (2016). - PubMed
    1. Robinette ML et al., Nat. Immunol. 16, 306–317 (2015). - PMC - PubMed

Publication types

MeSH terms