

A unified genealogy of modern and ancient genomes
- PMID: 35201891
- PMCID: PMC10027547
- DOI: 10.1126/science.abi8264
A unified genealogy of modern and ancient genomes
Abstract
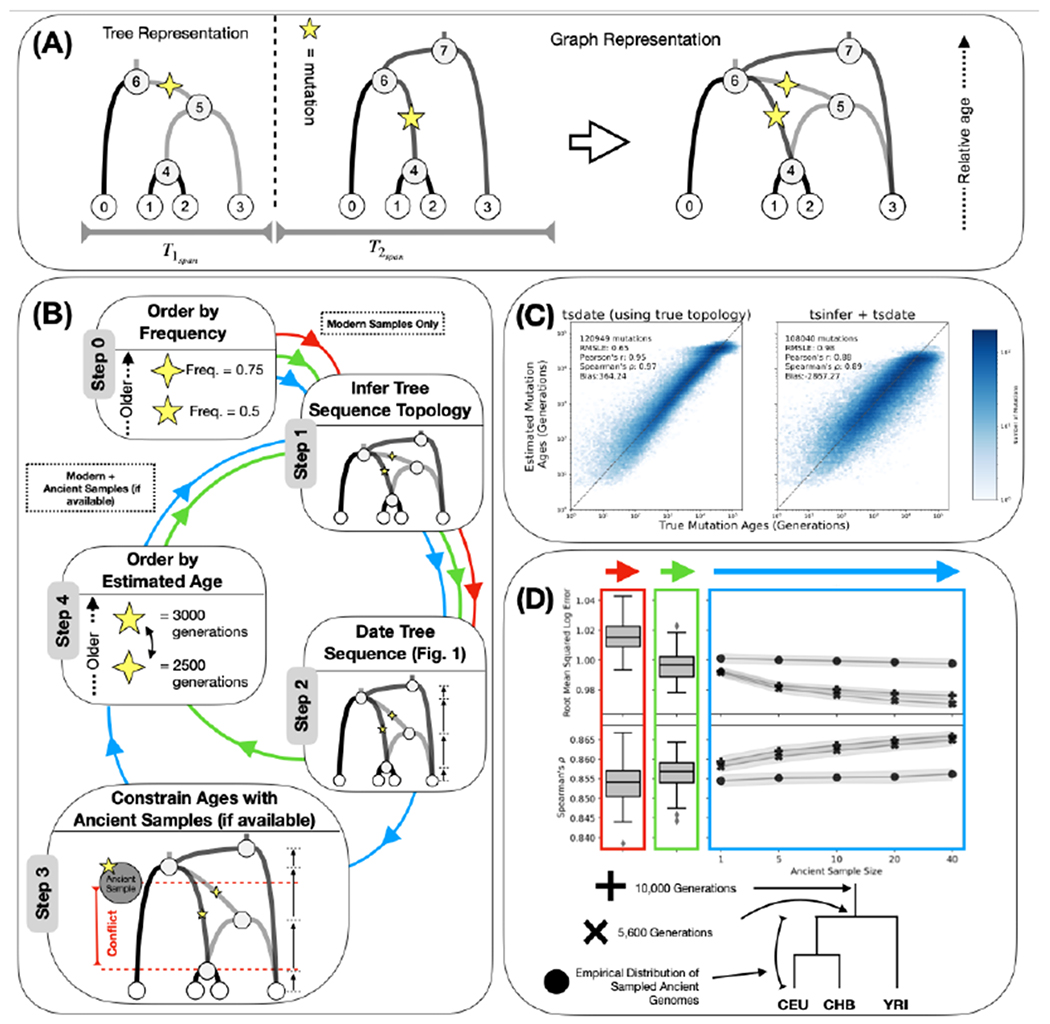
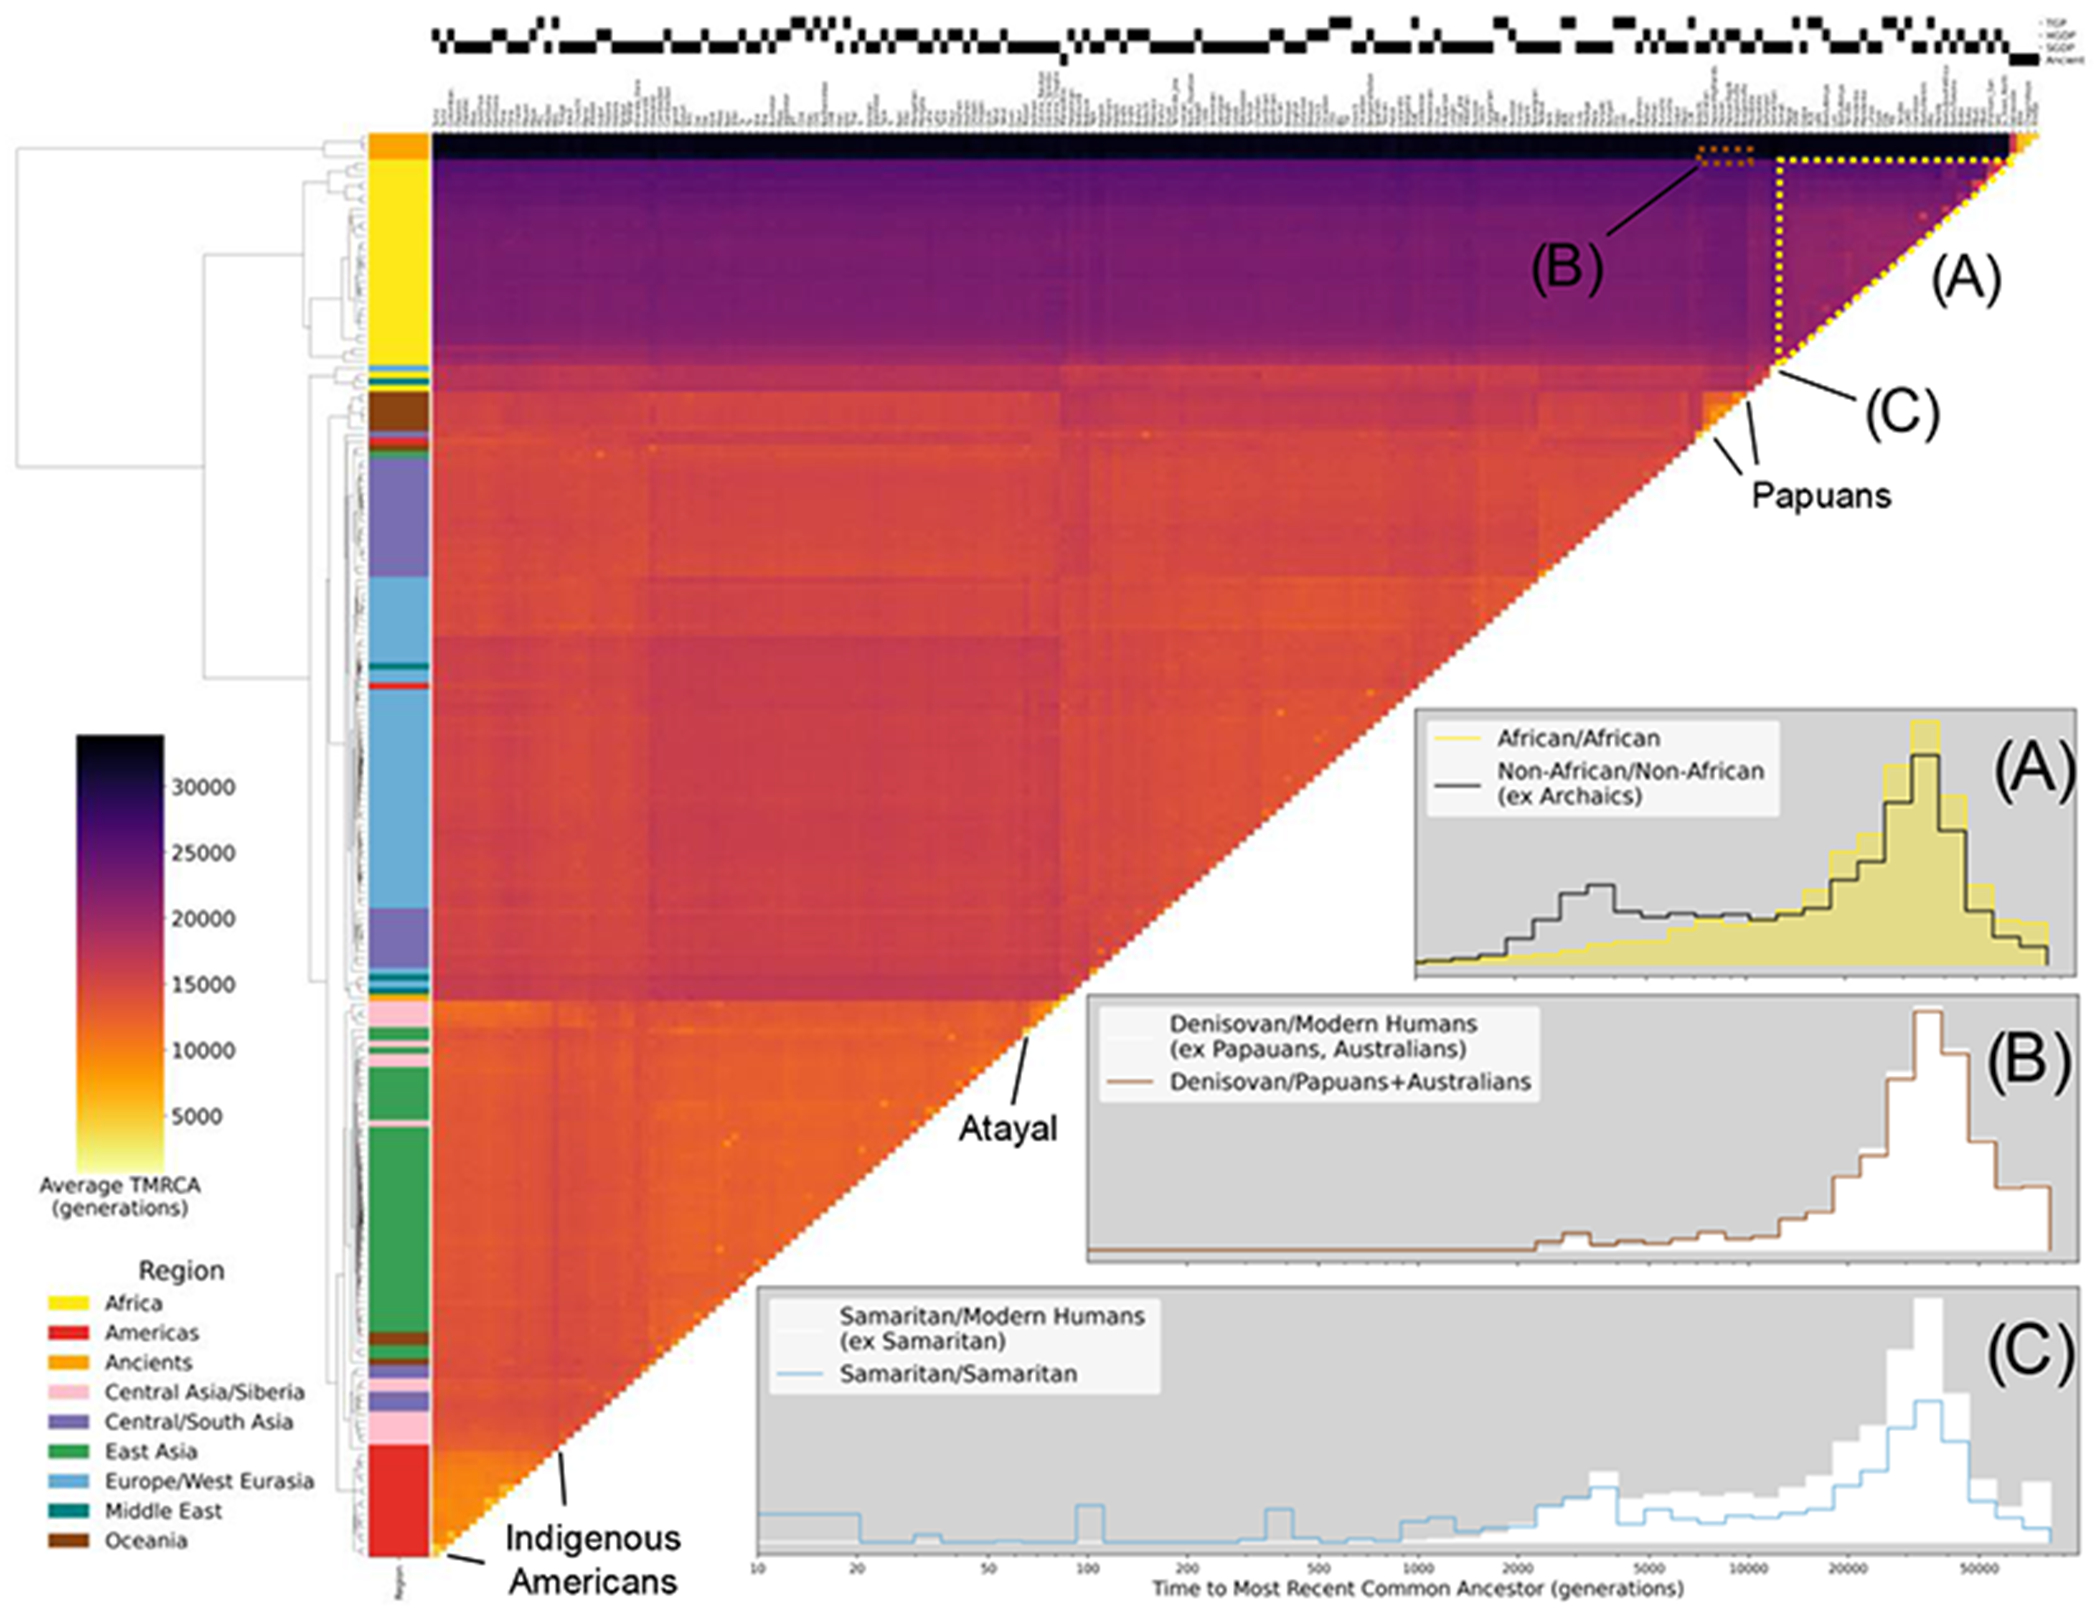
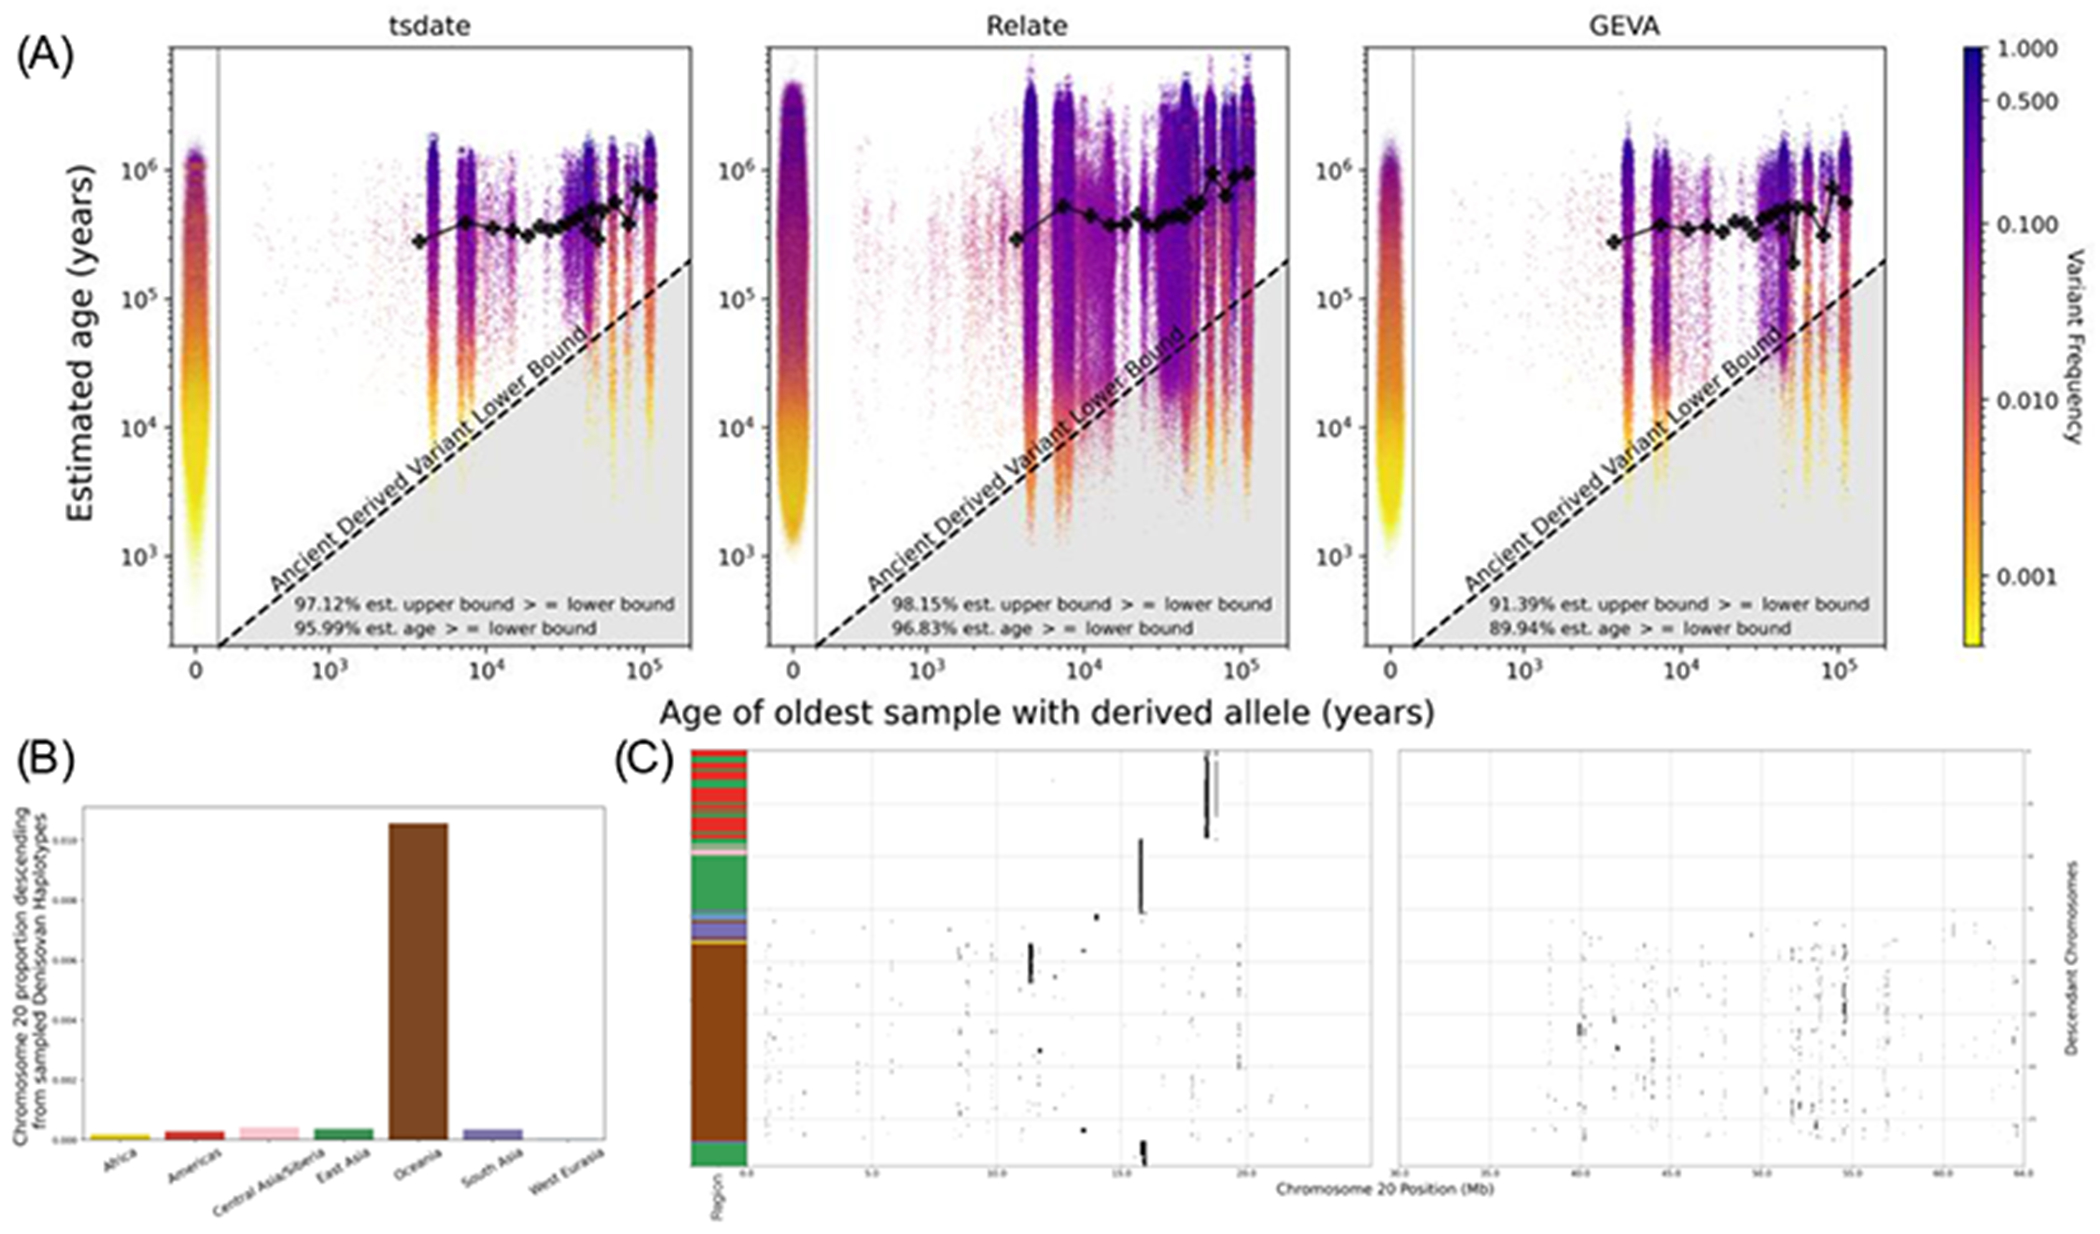
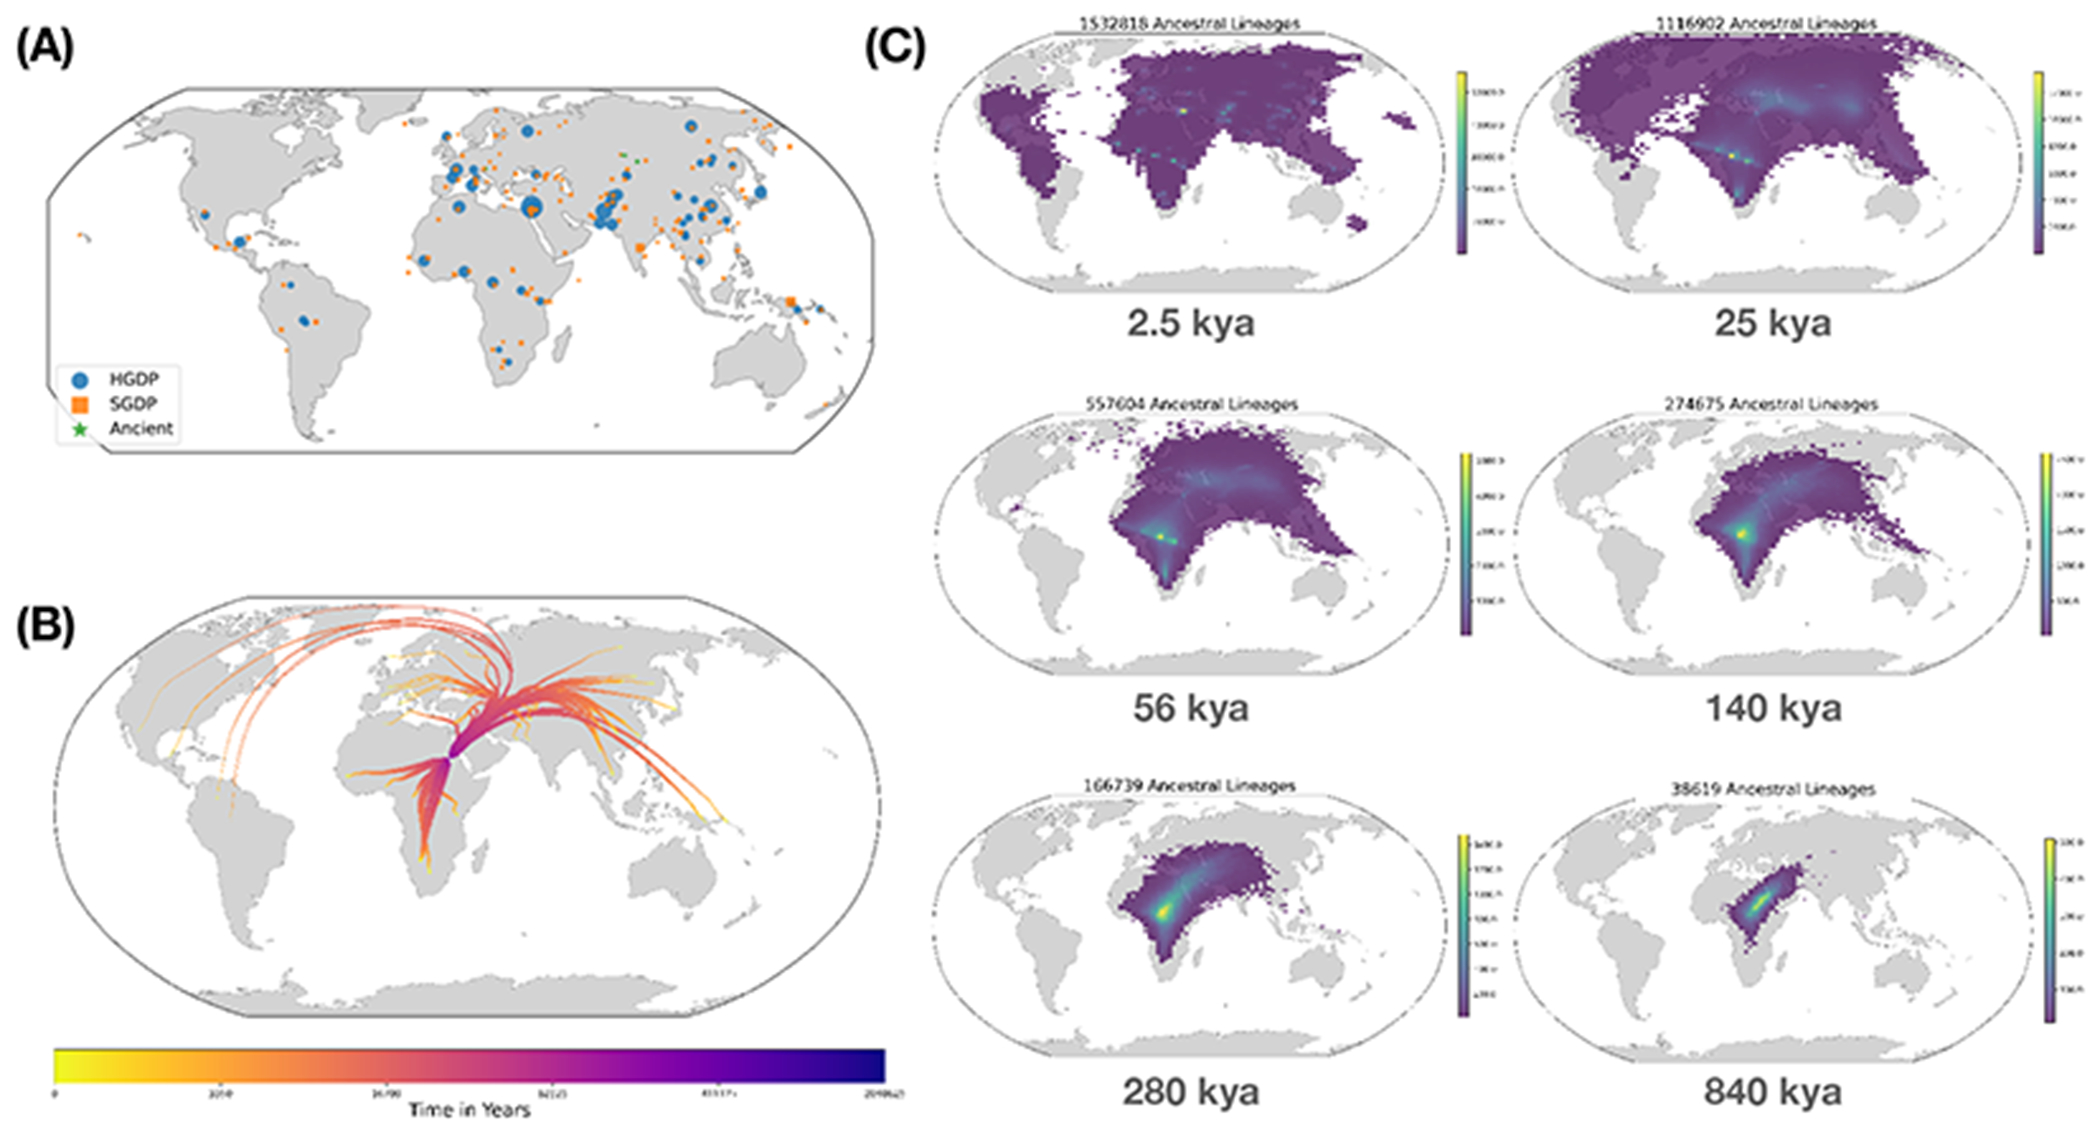
The sequencing of modern and ancient genomes from around the world has revolutionized our understanding of human history and evolution. However, the problem of how best to characterize ancestral relationships from the totality of human genomic variation remains unsolved. Here, we address this challenge with nonparametric methods that enable us to infer a unified genealogy of modern and ancient humans. This compact representation of multiple datasets explores the challenges of missing and erroneous data and uses ancient samples to constrain and date relationships. We demonstrate the power of the method to recover relationships between individuals and populations as well as to identify descendants of ancient samples. Finally, we introduce a simple nonparametric estimator of the geographical location of ancestors that recapitulates key events in human history.
Conflict of interest statement
Figures
Comment in
-
Inferring human evolutionary history.Science. 2022 Feb 25;375(6583):817-818. doi: 10.1126/science.abo0498. Epub 2022 Feb 24. Science. 2022. PMID: 35201893
-
Human genealogical histories.Nat Methods. 2022 Apr;19(4):400. doi: 10.1038/s41592-022-01471-w. Nat Methods. 2022. PMID: 35396479 No abstract available.
References
-
- Bycroft C, Freeman C, Petkova D, Band G, Elliott LT, Sharp K, Motyer A, Vukcevic D, Delaneau O, O’Connell J, Cortes A, Welsh S, Young A, Effingham M, McVean G, Leslie S, Allen N, Donnelly P, Marchini J, The UK Biobank resource with deep phenotyping and genomic data. Nature. 562, 203–209 (2018). - PMC - PubMed
-
- Taliun D, Harris DN, Kessler MD, Carlson J, Szpiech ZA, Torres R, Taliun SAG, Corvelo A, Gogarten SM, Kang HM, Pitsillides AN, LeFaive J, Lee S, Tian X, Browning BL, Das S, Emde A-K, Clarke WE, Loesch DP, Shetty AC, Blackwell TW, Smith AV, Wong Q, Liu X, Conomos MP, Bobo DM, Aguet F, Albert C, Alonso A, Ardlie KG, Arking DE, Aslibekyan S, Auer PL, Barnard J, Barr RG, Barwick L, Becker LC, Beer RL, Benjamin EJ, Bielak LF, Blangero J, Boehnke M, Bowden DW, Brody JA, Burchard EG, Cade BE, Casella JF, Chalazan B, Chasman DI, Chen Y-DI, Cho MH, Choi SH, Chung MK, Clish CB, Correa A, Curran JE, Custer B, Darbar D, Daya M, de Andrade M, DeMeo DL, Dutcher SK, Ellinor PT, Emery LS, Eng C, Fatkin D, Fingerlin T, Forer L, Fornage M, Franceschini N, Fuchsberger C, Fullerton SM, Germer S, Gladwin MT, Gottlieb DJ, Guo X, Hall ME, He J, Heard-Costa NL, Heckbert SR, Irvin MR, Johnsen JM, Johnson AD, Kaplan R, Kardia SLR, Kelly T, Kelly S, Kenny EE, Kiel DP, Klemmer R, Konkle BA, Kooperberg C, Köttgen A, Lange LA, Lasky-Su J, Levy D, Lin X, Lin K-H, Liu C, Loos RJF, Garman L, Gerszten R, Lubitz SA, Lunetta KL, Mak ACY, Manichaikul A, Manning AK, Mathias RA, McManus DD, McGarvey ST, Meigs JB, Meyers DA, Mikulla JL, Minear MA, Mitchell BD, Mohanty S, Montasser ME, Montgomery C, Morrison AC, Murabito JM, Natale A, Natarajan P, Nelson SC, North KE, O’Connell JR, Palmer ND, Pankratz N, Peloso GM, Peyser PA, Pleiness J, Post WS, Psaty BM, Rao DC, Redline S, Reiner AP, Roden D, Rotter JI, Ruczinski I, Sarnowski C, Schoenherr S, Schwartz DA, Seo J-S, Seshadri S, Sheehan VA, Sheu WH, Shoemaker MB, Smith NL, Smith JA, Sotoodehnia N, Stilp AM, Tang W, Taylor KD, Telen M, Thornton TA, Tracy RP, Van Den Berg DJ, Vasan RS, Viaud-Martinez KA, Vrieze S, Weeks DE, Weir BS, Weiss ST, Weng L-C, Willer CJ, Zhang Y, Zhao X, Arnett DK, Ashley-Koch AE, Barnes KC, Boerwinkle E, Gabriel S, Gibbs R, Rice KM, Rich SS, Silverman EK, Qasba P, Gan W, Abe N, Almasy L, Ament S, Anderson P, Anugu P, Applebaum-Bowden D, Assimes T, Avramopoulos D, Barron-Casella E, Beaty T, Beck G, Becker D, Beitelshees A, Benos T, Bezerra M, Bis J, Bowler R, Broeckel U, Broome J, Bunting K, Bustamante C, Buth E, Cardwell J, Carey V, Carty C, Casaburi R, Castaldi P, Chaffin M, Chang C, Chang Y-C, Chavan S, Chen B-J, Chen W-M, Chuang L-M, Chung R-H, Comhair S, Cornell E, Crandall C, Crapo J, Curtis J, Damcott C, David S, Davis C, de las Fuentes L, DeBaun M, Deka R, Devine S, Duan Q, Duggirala R, Durda JP, Eaton C, Ekunwe L, El Boueiz A, Erzurum S, Farber C, Flickinger M, Frazar C, Fu M, Fulton L, Gao S, Gao Y, Gass M, Gelb B, Geng XP, Geraci M, Ghosh A, Gignoux C, Glahn D, Gong D-W, Goring H, Graw S, Grine D, Gu CC, Guan Y, Gupta N, Haessler J, Hawley NL, Heavner B, Herrington D, Hersh C, Hidalgo B, Hixson J, Hobbs B, Hokanson J, Hong E, Hoth K, Hsiung CA, Hung Y-J, Huston H, Hwu CM, Jackson R, Jain D, Jhun MA, Johnson C, Johnston R, Jones K, Kathiresan S, Khan A, Kim W, Kinney G, Kramer H, Lange C, Lange E, Lange L, Laurie C, LeBoff M, Lee J, Lee SS, Lee W-J, Levine D, Lewis J, Li X, Li Y, Lin H, Lin H, Lin KH, Liu S, Liu Y, Liu Y, Luo J, Mahaney M, N. T.-O. for P. M. (TOPMed) Consortium, Sequencing of 53,831 diverse genomes from the NHLBI TOPMed Program. Nature. 590, 290–299 (2021). - PMC - PubMed
-
- Reich D, Who We Are and How We Got Here: Ancient DNA and the New Science of the Human Past (Oxford University Press, Oxford, UK, 2018).
-
- Lewin HA, Robinson GE, Kress WJ, Baker WJ, Coddington J, Crandall KA, Durbin R, Edwards SV, Forest F, Gilbert MTP, Goldstein MM, Grigoriev IV, Hackett KJ, Haussler D, Jarvis ED, Johnson WE, Patrinos A, Richards S, Castilla-Rubio JC, van Sluys M-A, Soltis PS, Xu X, Yang H, Zhang G, Earth BioGenome Project: Sequencing life for the future of life. Proc. Natl. Acad. Sci 115, 4325–4333 (2018). - PMC - PubMed
-
- Lazaridis, Patterson N, Mittnik A, Renaud G, Mallick S, Kirsanow K, Sudmant PH, Schraiber JG, Castellano S, Lipson M, Berger B, Economou C, Bollongino R, Fu Q, Bos KI, Nordenfelt S, Li H, de Filippo C, Prüfer K, Sawyer S, Posth C, Haak W, Hallgren F, Fornander E, Rohland N, Delsate D, Francken M, Guinet J-M, Wahl J, Ayodo G, Babiker HA, Bailliet G, Balanovska E, Balanovsky O, Barrantes R, Bedoya G, Ben-Ami H, Bene J, Berrada F, Bravi CM, Brisighelli F, Busby GBJ, Cali F, Churnosov M, Cole DEC, Corach D, Damba L, van Driem G, Dryomov S, Dugoujon J-M, Fedorova SA, Gallego Romero I, Gubina M, Hammer M, Henn BM, Hervig T, Hodoglugil U, Jha AR, Karachanak-Yankova S, Khusainova R, Khusnutdinova E, Kittles R, Kivisild T, Klitz W, Kučinskas V, Kushniarevich A, Laredj L, Litvinov S, Loukidis T, Mahley RW, Melegh B, Metspalu E, Molina J, Mountain J, Näkkäläjärvi K, Nesheva D, Nyambo T, Osipova L, Parik J, Platonov F, Posukh O, Romano V, Rothhammer F, Rudan I, Ruizbakiev R, Sahakyan H, Sajantila A, Salas A, Starikovskaya EB, Tarekegn A, Toncheva D, Turdikulova S, Uktveryte I, Utevska O, Vasquez R, Villena M, Voevoda M, Winkler CA, Yepiskoposyan L, Zalloua P, Zemunik T, Cooper A, Capelli C, Thomas MG, Ruiz-Linares A, Tishkoff SA, Singh L, Thangaraj K, Villems R, Comas D, Sukernik R, Metspalu M, Meyer M, Eichler EE, Burger J, Slatkin M, Pääbo S, Kelso J, Reich D, Krause J, Ancient human genomes suggest three ancestral populations for present-day Europeans. Nature. 513, 409–413 (2014). - PMC - PubMed
Publication types
MeSH terms
Substances
Grants and funding
LinkOut - more resources
Full Text Sources
