. 2022 Mar 11;375(6585):1177-1182.
doi: 10.1126/science.abl5130. Epub 2022 Feb 24.

Angiotensin-converting enzyme gates brain circuit-specific plasticity via an endogenous opioid

Affiliations

Angiotensin-converting enzyme gates brain circuit-specific plasticity via an endogenous opioid

Brian H Trieu et al. Science. .

Abstract

Angiotensin-converting enzyme (ACE) regulates blood pressure by cleaving angiotensin I to produce angiotensin II. In the brain, ACE is especially abundant in striatal tissue, but the function of ACE in striatal circuits remains poorly understood. We found that ACE degrades an unconventional enkephalin heptapeptide, Met-enkephalin-Arg-Phe, in the nucleus accumbens of mice. ACE inhibition enhanced µ-opioid receptor activation by Met-enkephalin-Arg-Phe, causing a cell type-specific long-term depression of glutamate release onto medium spiny projection neurons expressing the Drd1 dopamine receptor. Systemic ACE inhibition was not intrinsically rewarding, but it led to a decrease in conditioned place preference caused by fentanyl administration and an enhancement of reciprocal social interaction. Our results raise the enticing prospect that central ACE inhibition can boost endogenous opioid signaling for clinical benefit while mitigating the risk of addiction.


Conflict of interest statement

Competing interests: Authors declare that they have no competing interests.

Figures

Fig. 1.
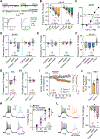
Fig. 1.. ACE inhibition reduces excitatory input to D1-MSNs via endogenous opioid signaling.
(A, B) Schematic of angiotensin and enkephalin regulation by ACE, in the absence (A) and presence (B) of ACE inhibition. (C) Drd1-tdTomato expression (red) in D1-MSNs, and Drd2-eGFP expression (green) in D2-MSNs. (D-F) EPSC amplitude before, during, and after 15 min bath perfusion (grey bar) of 10 μM captopril in D1-MSNs (orange, n=11) or D2-MSNs (green, n=8) (D); AT1R antagonist valsartan (dark blue, 2 μM n=8 and 20 μM n=9) or angiotensin I peptide (1 μM, light blue, n=11) in D1-MSNs (E); or captopril (10 μM) in continual presence of opioid receptor antagonist naloxone (10 μM, dark purple, n=8) or chased by naloxone (10 μM, light purple, n=9) in D1-MSNs (F). Bottom-left insets show traces before (black lines) and after (last 5 min of recording, colored lines). (G-I) EPSC parameters during the last 5 min of each recording, expressed as percentage of baseline prior to drug application: EPSC amplitude (G), paired-pulse ratio (H), and 1/CV2 (I). Data are mean ± s.e.m. for all panels; open and closed circles indicate recordings from female and male mice, respectively. *P<0.05, **P<0.01, ***P<0.001, ****P<0.0001, ANOVA followed by one-sample t-test versus baseline; see Data S1 for complete statistics.
Fig. 2.
Fig. 2.. ACE selectively degrades MERF in the extracellular space.
(A) Quantification of neuropeptide release from brain slices using LC-MS/MS. (B) Extracellular neuropeptide levels from slices submerged in normal aCSF or 50 mM KCl. (C) Percent change in extracellular neuropeptide levels after KCl stimulation in presence versus absence of captopril (10 μM). Inset shows enkephalin amino acid sequences and site of enzymatic cleavage of MERF by ACE (red line). (D) Breeding strategy to generate mice expressing channelrhodopsin-2 in D2-MSNs. (E) Extracellular neuropeptide levels from slices following optogenetic stimulation at 20 Hz. (F) Percent change in extracellular neuropeptide levels after optogenetic stimulation in presence versus absence of captopril (10 μM). Data are mean ± s.e.m. for all panels; open and closed circles indicate samples from female and male mice, respectively. *P<0.05, **P<0.01, ***P<0.001, ****P<0.0001, ANOVA followed by simple effect test (B, E, F) or Fisher’s LSD post-hoc test (C); see Data S1 for complete statistics.
Fig. 3.
Fig. 3.. Captopril enhances MERF effects on presynaptic and postsynaptic opioid receptors.
(A) Top, mEPSCs from D1-MSNs (left) and D2-MSNs (right) before and after bath perfusion of MERF (10 μM). Bottom, cumulative fraction plots of inter-event interval (left) and amplitude (right) of mEPSCs at increasing MERF concentrations (0.01–10 μM). (B) MERF caused a dose-dependent decrease in mEPSC frequency in D1-MSNs (left, orange, n=8) and D2-MSNs (right, green, n=9). (C) Sigmoidal interpolation of MERF dose-response normalized to maximal frequency change at 10 μM (IC50: 438 nM, 95% CI: 279–690 nM, n=17). (D, E) mEPSC frequency (D) and amplitude (E) after combined captopril (10 μM) and/or threshold MERF (100 nM) in D1-MSNs (left, n=14) and D2-MSNs (right, n=12). (F) Combined effect of captopril and threshold MERF in the presence of selective antagonists of delta (SDM25N, 500 nM, blue, n=9), kappa (NOR-BNI, 100 nM, green, n=11), or mu (CTAP, 1 μM, orange, n=12) opioid receptors. (G, H) Combined effect of captopril and threshold MERF on mEPSC frequency (G) and amplitude (H) in Oprm1−/− knockout mice (grey, n=8) and Oprm1+/+ littermates (purple, n=8). (I, J) EPSC amplitude time course (I) or average during last 5 min (J) of captopril-LTD in Oprm1+/+ (orange, n=8) and Oprm1−/− mice (grey, n=9). Inset shows traces before captopril (black lines) and during last 5 min (color lines). (K) Action potential firing rate of D1-MSNs (n=5–7) before and after exposure to MERF (0.1–1 μM). (L) Change in action potential firing rate of D1-MSNs (n=3–7) at 120 pA after combined captopril (10 μM) and/or threshold MERF (100 nM). Data are mean ± s.e.m. for all panels; open and closed circles indicate recordings from female and male mice, respectively. *P<0.05, **P<0.01, ***P<0.001, ****P<0.0001, concentration main effect (B), treatment simple effect in D1-MSNs (D), genotype or treatment main effect (F, J, K, L), or two-sample t-test (G); see Data S1 for complete statistics.
Fig. 4.
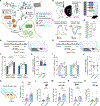
Fig. 4.. Systemic captopril reduces excitatory input to D1-MSNs, counteracts fentanyl reward, and increases sociability.
(A) Proposed mechanism by which captopril regulates glutamate release onto D1-MSNs via MERF. (B) Schematic showing viral injection of ChrimsonR-tdTomato in mPFC and Cre-dependent GCaMP8m in NAc, separated by fluorescent image showing viral expression (left), and setup for simultaneous optogenetic stimulation (594 nm) and fiber photometry recording (405/470 nm, right). (C) Traces showing average response to 2, 10, and 40 pulses of red light at 20 Hz after injection of saline (left), and average change in response following injection of captopril (30 mg/kg, i.p.; right). (D) Percent change in slope of the input-output curve following injection of captopril versus saline (n=6). (E-G) Schematic of unbiased place conditioning procedure (E), with percent time on fentanyl side (F) and CPP score (G) for groups receiving fentanyl (0.04 mg/kg, s.c.) preceded by vehicle (n=11, dark grey) or captopril (30 mg/kg, i.p.; n=11, dark blue). (H-J) Schematic of unbiased place conditioning procedure (H), with percent time on fentanyl side (I) and CPP score (J) for groups receiving saline preceded by vehicle (n=11, grey) or captopril (30 mg/kg, i.p.; n=11, blue). (K) Left, schematic of reciprocal social interaction test following injection of vehicle or captopril (30 mg/kg, i.p.). Right, total social interaction time after captopril (n=18, blue) or vehicle (n=18, grey). (L-O) Time spent huddling (L), interacting nose-to-nose (M), socially exploring (N), or following (O) the partner mouse throughout the assay. Data are mean ± s.e.m. for all panels; open and closed circles indicate female and male mice, respectively. *P<0.05, **P<0.01, ***P<0.001, ****P<0.0001, one-sample t-test (D), simple effect of session/treatment (F), and treatment main effect (G, K-N); see Data S1 for complete statistics.

Similar articles

Cited by

References

    1. Gordon JA. Nat Neurosci 19, 1385–1386 (2016). - PubMed
    1. Rothwell PE et al. Cell 158, 198–212 (2014). - PMC - PubMed
    1. Schwartz N et al. Science 345, 535–542 (2014). - PMC - PubMed
    1. Creed M, Pascoli VJ, Luscher C. Science 347, 659–664 (2015). - PubMed
    1. Strittmatter SM, Lo MM, Javitch JA, Snyder SH. Proc Natl Acad Sci U S A 81, 1599–1603 (1984). - PMC - PubMed

Publication types