. 2022 Jan 18;8(1):11.
doi: 10.3390/ncrna8010011.

Hsa-miR-183-5p Modulates Cell Adhesion by Repression of ITGB1 Expression in Prostate Cancer

Affiliations

Hsa-miR-183-5p Modulates Cell Adhesion by Repression of ITGB1 Expression in Prostate Cancer

Carolina Oliveira-Rizzo et al. Noncoding RNA. .

Abstract

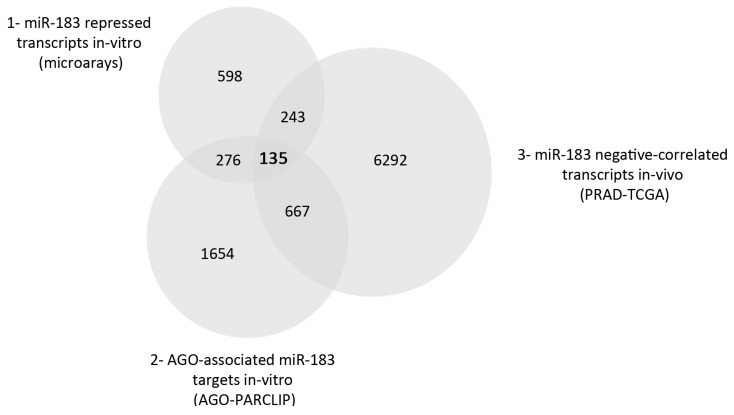
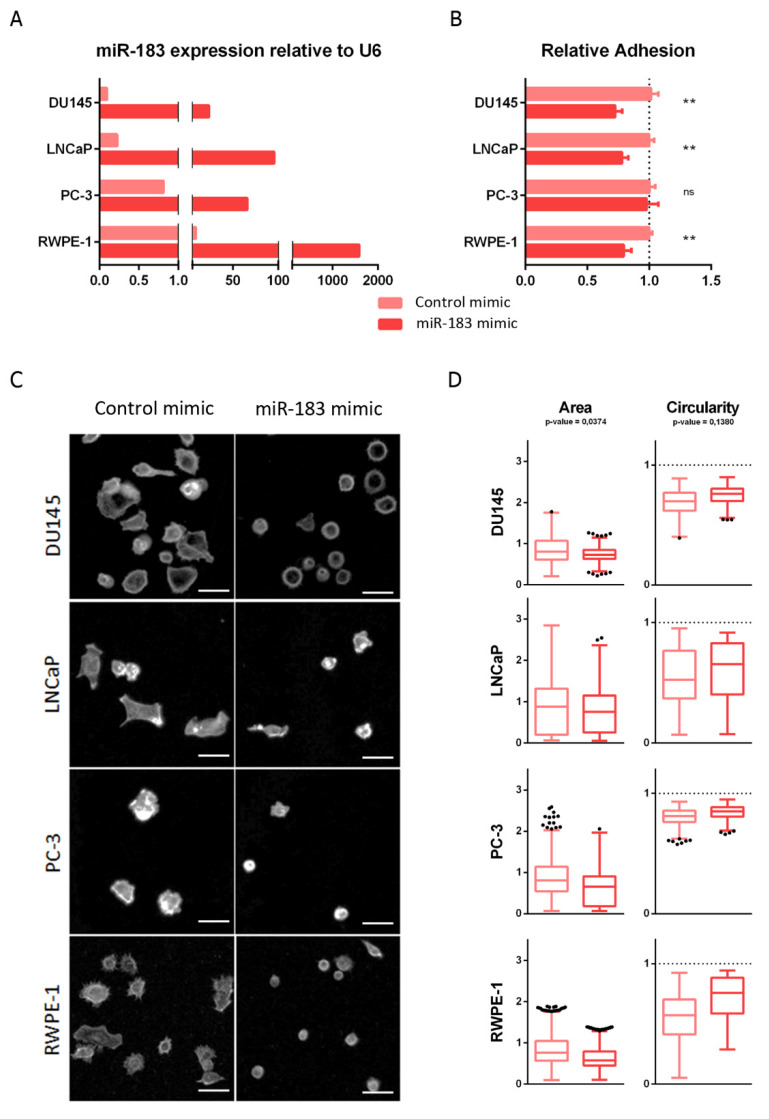
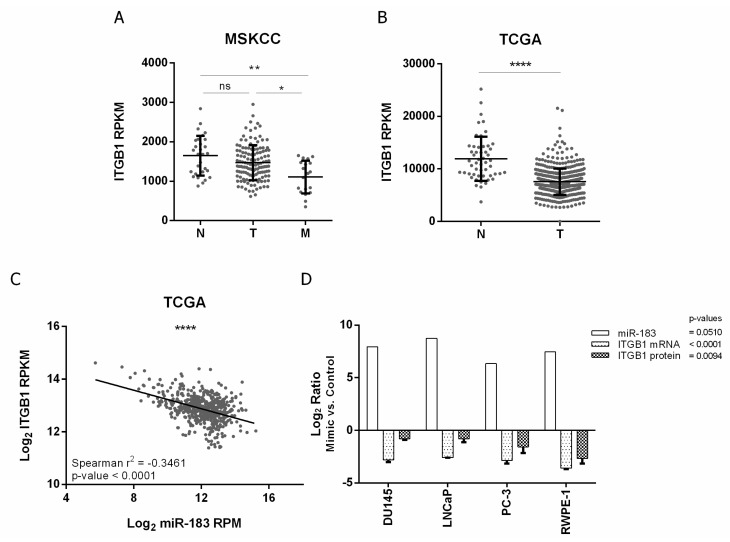
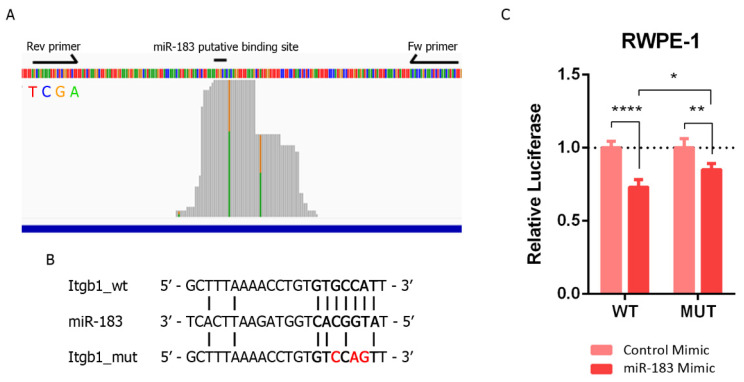
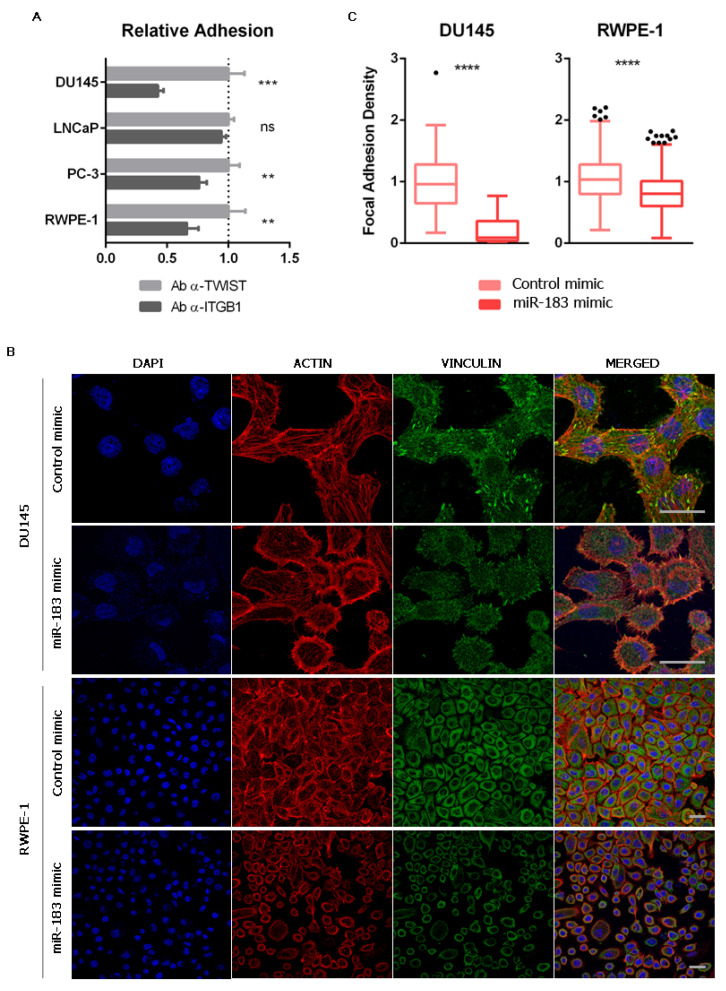
Prostate cancer is a major health problem worldwide. MiR-183 is an oncomiR and a candidate biomarker in prostate cancer, affecting various pathways responsible for disease initiation and progression. We sought to discover the most relevant processes controlled by miR-183 through an unbiased transcriptomic approach using prostate cell lines and patient tissues to identify miR-183 responsive genes and pathways. Gain of function experiments, reporter gene assays, and transcript and protein measurements were conducted to validate predicted functional effects and protein mediators. A total of 135 candidate miR-183 target genes overrepresenting cell adhesion terms were inferred from the integrated transcriptomic analysis. Cell attachment, spreading assays and focal adhesion quantification of miR-183-overexpressing cells confirmed the predicted reduction in cell adhesion. ITGB1 was validated as a major target of repression by miR-183 as well as a mediator of cell adhesion in response to miR-183. The reporter gene assay and PAR-CLIP read mapping suggest that ITGB1 may be a direct target of miR-183. The negative correlation between miR-183 and ITGB1 expression in prostate cancer cohorts supports their interaction in the clinical set. Overall, cell adhesion was uncovered as a major pathway controlled by miR-183 in prostate cancer, and ITGB1 was identified as a relevant mediator of this effect.

Keywords: AGO-PAR-CLIP; ITGB1; TCGA; cancer; focal adhesion; miR-183; microRNA; prostate.


Conflict of interest statement

The authors declare no conflict of interest.

Figures

Figure 1
Figure 1
Venn diagram of the three gene lists used for the selection of miR-183 candidate direct target genes. 1: Genes downregulated and upregulated upon transfection of miR-183 mimic or inhibitor, respectively, identified by gene expression microarrays of the DU145 and LNCaP cell lines (fold change ≥ 1.25 in at least two of the four conditions assessed). 2: Argonaut-associated transcripts containing the 6-mer (2–7 nt) sequence complementary to the miR-183 seed extracted from prostate cell lines in the AGO-PAR-CLIP experiments performed by Hamilton et al. [31] (at least one read in three out of five cell lines published). 3: Transcripts showing a negative Spearman correlation with miR-183 expression (p-value < 0.05, r2 < 0) in the PRAD-TCGA samples.
Figure 2
Figure 2
Effect of miR-183 on cell adhesion. (A) RT-qPCR measurement of miR-183 relative to RNAU6 (2−∆∆CT) 72 h after transfection of 20 nM miR-183 mimic or control RNAs in the indicated cell lines. (B) For the cell adhesion assay, the cells were harvested 72 h after transfection and seeded on cell culture surface-treated polystyrene 96-well plates, then allowed to adhere for 0.5 or 1 h (depending on the cell line), and the non-adherent cells were removed. Initial and remaining (attached) cells were quantified in independent wells using CellTiter-Glo (Promega). The fraction of attached cells in the miR-183 mimic relative to the control is shown as the mean ± standard deviation from at least three independent experiments. An unpaired t-test was applied to assess the statistical significance of the difference between conditions. (C) 72 h after transfection, the cells were harvested, plated on coverslips and allowed to spread for 3 h. The cells were then fixed, permeabilized and stained with Alexa Fluor 488-conjugated phalloidin to reveal the actin cytoskeleton. Images were captured with a Fluorescent Cell Imager using a monochrome camera and a magnification of 175×. Scale bars show 25 μm. Representative images are shown. (D) Cell area and circularity measured in cell adhesion assays of B were retrieved using ImageJ Software. Approximately 300 individual cells were analyzed for each cell line. A paired t-test was performed, considering the four cell lines as biological replicates, to assess the statistical significance between conditions. ** p-value < 0.1, ns = not significant.
Figure 3
Figure 3
Expression of ITGB1 and its association with miR-183 expression in PrCa. (A,B) association of ITGB1 mRNA expression (RPKM) with tissue status in the MSKCC [28] and PRAD-TCGA cohorts, respectively. N = normal, T = primary tumor, M = metastatic tissue. A Mann–Whitney test was applied to assess the statistical significance of the difference between conditions. (C) Correlation between ITGB1 mRNA (Log2 RPKM) and miR-183 (Log2 RPM) expression in metastatic, primary tumor and normal tissue samples from the PRAD-TCGA project, evaluated by a Spearman correlation test. (D) Effect of miR-183 on ITGB1 expression in four PrCa cell lines. Cells were transfected with 20 nM of miR-183 mimic or control RNA. MiR-183 (normalized to RNAU6) and ITGB1 mRNA (normalized to BACT and GAPDH) levels (2−∆∆CT) were assessed by RT-qPCR 72 h after transfection in 2 technical replicates per cell line. ITGB1 protein levels (mean fluorescence intensity) were assessed by flow cytometry 72 h after transfection in at least three independent experiments per cell line. The results of the ratio between miR-183 mimic and control are shown as Log2. A paired t-test was performed considering the four cell lines as biological replicates to assess the statistical significance between conditions. p-value * <0.05, ** <0.01, **** <0.0001, ns = not significant.
Figure 4
Figure 4
Validation of the direct miR-183 and ITGB1 mRNA interaction in PrCa. (A) Mapping of prostate cell line reads along the putative binding site of miR-183 on ITGB1’s 3′UTR extracted from AGO-PAR-CLIP RNA-seq data [31]. The base identity is represented by four colors, as indicated. Perfect base matches and mismatches (due to base substitutions caused by the photoactivatable ribonucleoside crosslinking) are represented as gray and colored bars, respectively. Forward and reverse primers used to clone the miR-183 binding site of the ITGB1 3′UTR in pmiRGLO are indicated by arrows. The image is a modified screenshot of the IGV Software [42]. (B) Base pairing between miR-183 and the conserved miR-183 putative binding site on ITGB1 wild type and mutated 3′UTR cloned in pmirGLO for reporter gene assays. (C) Reporter gene assay using pmiRGLO, bearing the region of the 3′UTR of ITGB1 with the miR-183 wild type or mutated site, co-transfected with miR-183 mimic or control RNA in the RWPE-1 cell line. Luciferase activity was measured 48 h after transfection. The mean ± SD of four independent experiments is shown. A two-way ANOVA was applied to test the statistical significance of the differences between conditions. p-value * <0.05, ** <0.01, **** <0.0001.
Figure 5
Figure 5
Effect of miR-183 on the number of focal adhesions. (A) Effect of ITGB1 blockade on cell adhesion. Untransfected cells were incubated with an antibody against ITGB1 (ab24693 Abcam) or TWIST (ab50887 Abcam), seeded on polystyrene 96-well plates and allowed to adhere for 0.5 or 1 h (depending on the cell line). Non-adherent cells were removed, and the remaining cells were quantified using CellTiter-Glo (Promega). The results of at least three independent replicates were normalized to the control and are shown as means ± SD. An unpaired t-test was applied to assess the statistical significance of the difference between conditions. (B) Immunocytochemistry of vinculin of prostate cells overexpressing miR-183. Seventy-two hours after transfection of 20 nM of miR-183, the cells were fixed, permeabilized and immunostained for vinculin using an Alexa Fluor 488-conjugated secondary antibody. Nuclei and filamentous actin were counterstained with DAPI and phalloidin-Alexa Fluor 568, respectively. The images were collected on a confocal microscope using a 63X oil immersion objective. Scale bars show 25 μm. Representative images are shown. (C) Effect of miR-183 on focal adhesion density. Quantification of focal adhesions per cell in vinculin immunocytochemical images of the DU145 and RWPE-1 cell lines. Images were processed using ImageJ. A Mann–Whitney test was applied to test the statistical significance of the difference between conditions. p-value ** <0.01, *** <0.001, **** <0.0001, ns = not significant.

References

    1. Bray F., Ferlay J., Soerjomataram I., Siegel R.L., Torre L.A., Jemal A. Global Cancer Statistics 2018: GLOBOCAN Estimates of Incidence and Mortality Worldwide for 36 Cancers in 185 Countries. CA Cancer J. Clin. 2018;68:394–424. doi: 10.3322/caac.21492. - DOI - PubMed
    1. Guo H., Ingolia N.T., Weissman J.S., Bartel D.P. Mammalian MicroRNAs Predominantly Act to Decrease Target MRNA Levels. Nature. 2010;466:835–840. doi: 10.1038/nature09267. - DOI - PMC - PubMed
    1. Bartel D.P. MicroRNAs: Target Recognition and Regulatory Functions. Cell. 2009;136:215–233. doi: 10.1016/j.cell.2009.01.002. - DOI - PMC - PubMed
    1. Larsson O., Nadon R. Re-Analysis of Genome Wide Data on Mammalian MicroRNA-Mediated Suppression of Gene Expression. Translation. 2013;1:e24557. doi: 10.4161/trla.24557. - DOI - PMC - PubMed
    1. Ambs S., Prueitt R.L., Yi M., Hudson R.S., Howe T.M., Petrocca F., Wallace T.A., Liu C.G., Volinia S., Calin G.A., et al. Genomic Profiling of MicroRNA and Messenger RNA Reveals Deregulated MicroRNA Expression in Prostate Cancer. Cancer Res. 2008;68:6162–6170. doi: 10.1158/0008-5472.CAN-08-0144. - DOI - PMC - PubMed

LinkOut - more resources