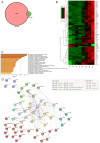
Stx2 Induces Differential Gene Expression and Disturbs Circadian Rhythm Genes in the Proximal Tubule
- PMID: 35202097
- PMCID: PMC8874938
- DOI: 10.3390/toxins14020069
Stx2 Induces Differential Gene Expression and Disturbs Circadian Rhythm Genes in the Proximal Tubule
Abstract
Shiga toxin-producing Escherichia coli (STEC) causes proximal tubular defects in the kidney. However, factors altered by Shiga toxin (Stx) within the proximal tubules are yet to be shown. We determined Stx receptor Gb3 in murine and human kidneys and confirmed the receptor expression in the proximal tubules. Stx2-injected mouse kidney tissues and Stx2-treated human primary renal proximal tubular epithelial cell (RPTEC) were collected and microarray analysis was performed. We compared murine kidney and RPTEC arrays and selected common 58 genes that are differentially expressed vs. control (0 h, no toxin-treated). We found that the most highly expressed gene was GDF15, which may be involved in Stx2-induced weight loss. Genes associated with previously reported Stx2 activities such as src kinase Yes phosphorylation pathway activation, unfolded protein response (UPR) and ribotoxic stress response (RSR) showed differential expressions. Moreover, circadian clock genes were differentially expressed, suggesting Stx2-induced renal circadian rhythm disturbance. Circadian rhythm-regulated proximal tubular Na+-glucose transporter SGLT1 (SLC5A1) was down-regulated, indicating proximal tubular functional deterioration, and mice developed glucosuria confirming proximal tubular dysfunction. Stx2 alters gene expression in murine and human proximal tubules through known activities and newly investigated circadian rhythm disturbance, which may result in proximal tubular dysfunctions.
Keywords: Shiga toxin type 2 (Stx2); circadian rhythm; human renal proximal tubular epithelial cell (RPTEC); microarray; mouse; renal proximal tubule.
Conflict of interest statement
The authors declare no conflict of interest. The funders had no role in the design of the study; in the collection, analyses, or interpretation of data; in the writing of the manuscript, or in the decision to publish the results.
Figures


Similar articles
-
Comparative Characterization of Shiga Toxin Type 2 and Subtilase Cytotoxin Effects on Human Renal Epithelial and Endothelial Cells Grown in Monolayer and Bilayer Conditions.PLoS One. 2016 Jun 23;11(6):e0158180. doi: 10.1371/journal.pone.0158180. eCollection 2016. PLoS One. 2016. PMID: 27336788 Free PMC article.
-
Effects of shiga toxin 2 on cellular regeneration mechanisms in primary and three-dimensional cultures of human renal tubular epithelial cells.Microb Pathog. 2016 Oct;99:87-94. doi: 10.1016/j.micpath.2016.08.010. Epub 2016 Aug 9. Microb Pathog. 2016. PMID: 27521227
-
Cytoprotective effect of curcumin in human proximal tubule epithelial cells exposed to shiga toxin.Biochem Biophys Res Commun. 2001 Apr 27;283(1):36-41. doi: 10.1006/bbrc.2001.4749. Biochem Biophys Res Commun. 2001. PMID: 11322764
-
Differential response of the human renal proximal tubular epithelial cell line HK-2 to Shiga toxin types 1 and 2.Infect Immun. 2011 Sep;79(9):3527-40. doi: 10.1128/IAI.05139-11. Epub 2011 Jun 27. Infect Immun. 2011. PMID: 21708996 Free PMC article.
-
Crosstalk between Human Microvascular Endothelial Cells and Tubular Epithelial Cells Modulates Pro-Inflammatory Responses Induced by Shiga Toxin Type 2 and Subtilase Cytotoxin.Toxins (Basel). 2019 Nov 7;11(11):648. doi: 10.3390/toxins11110648. Toxins (Basel). 2019. PMID: 31703347 Free PMC article.
References
-
- Katagiri Y.U., Mori T., Nakajima H., Katagiri C., Taguchi T., Takeda T., Kiyokawa N., Fujimoto J. Activation of Src family kinase yes induced by Shiga toxin binding to globotriaosyl ceramide (Gb3/CD77) in low density, detergent-insoluble microdomains. J. Biol. Chem. 1999;274:35278–35282. doi: 10.1074/jbc.274.49.35278. - DOI - PubMed
-
- Takenouchi H., Kiyokawa N., Taguchi T., Matsui J., Katagiri Y.U., Okita H., Okuda K., Fujimoto J. Shiga toxin binding to globotriaosyl ceramide induces intracellular signals that mediate cytoskeleton remodeling in human renal carcinoma-derived cells. J. Cell Sci. 2004;117:3911–3922. doi: 10.1242/jcs.01246. - DOI - PubMed
Publication types
MeSH terms
Substances
LinkOut - more resources
Full Text Sources
Molecular Biology Databases
Miscellaneous

