. 2022 Jan 21;10(2):48.
doi: 10.3390/toxics10020048.

Neuronal and Astrocytic Morphological Alterations Driven by Prolonged Exposure with Δ9-Tetrahydrocannabinol but Not Cannabidiol

Affiliations

Neuronal and Astrocytic Morphological Alterations Driven by Prolonged Exposure with Δ9-Tetrahydrocannabinol but Not Cannabidiol

Elisa Landucci et al. Toxics. .

Abstract

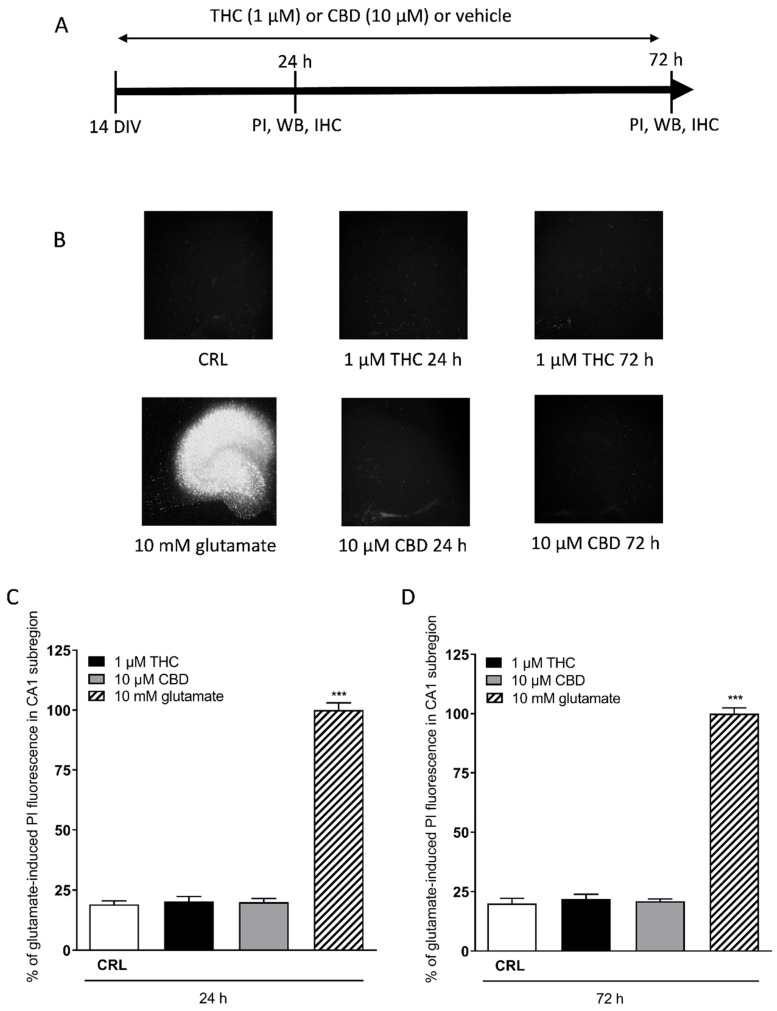
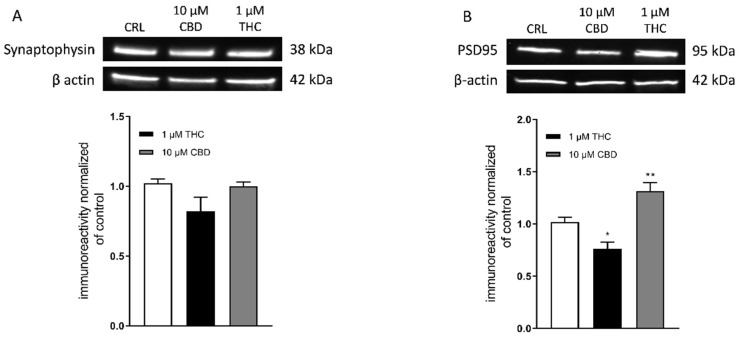
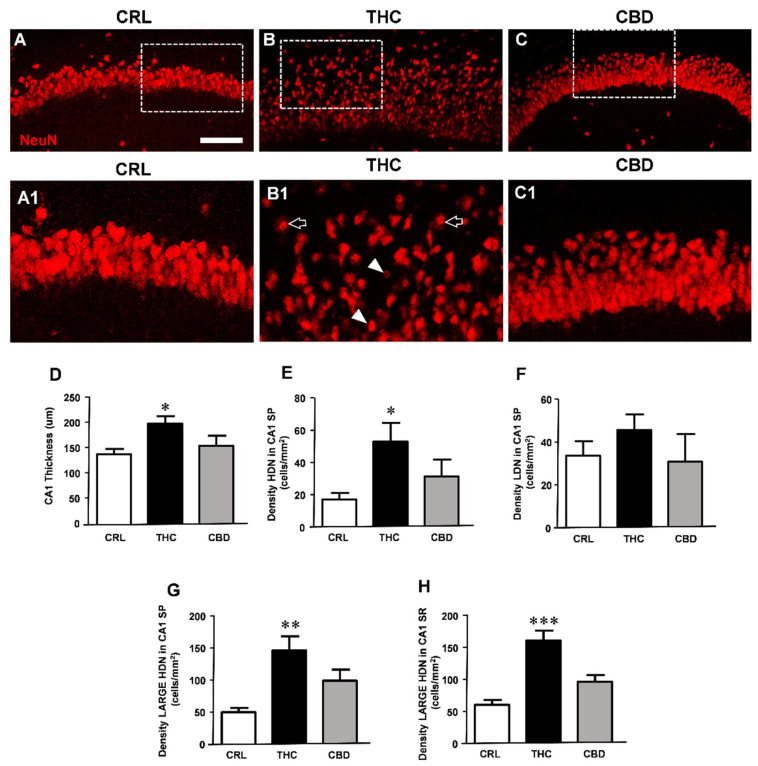
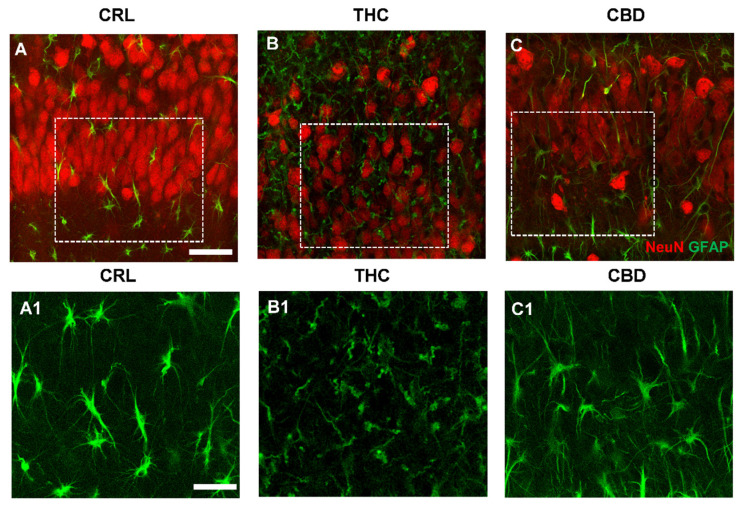
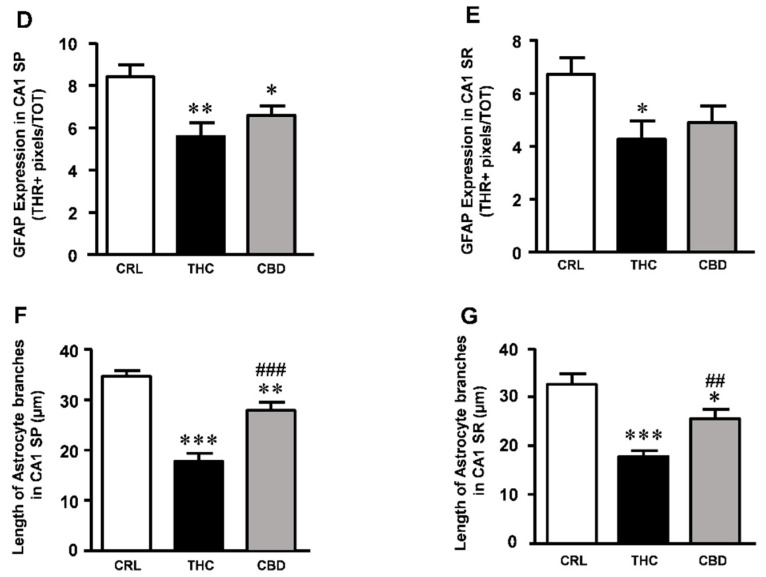
Cannabis derivatives are largely used in the general population for recreational and medical purposes, with the highest prevalence among adolescents, but chronic use and abuse has raised medical concerns. We investigated the prolonged effects of Δ9-tetrahydrocannabinol (THC) and cannabidiol (CBD) in organotypic hippocampal slices from P7 rats cultured for 2 weeks. Cell death in the CA1 subregion of slices was quantified by propidium iodide (PI) fluorescence, pre-synaptic and post-synaptic marker proteins were analysed by Western blotting and neurodegeneration and astrocytic alterations by NeuN and GFAP by immunofluorescence and confocal laser microscopy. The statistical significance of differences was analysed using ANOVA with a post hoc Dunnett w-test (PI fluorescence intensities and Western blots) or Newman-Keuls (immunohistochemistry data) for multiple comparisons. A probability value (P) of < 0.05 was considered significant. Prolonged (72 h) THC or CBD incubation did not induce cell death but caused modifications in the expression of synaptic proteins and morphological alterations in neurons and astrocytes. In particular, the expression of PSD95 was reduced following incubation for 72 h with THC and was increased following incubation with CBD. THC for 72 h caused disorganisation of CA1 stratum pyramidalis (SP) and complex morphological modifications in a significant number of pyramidal neurons and in astrocytes. Our results suggest that THC or CBD prolonged exposure induce different effects in the hippocampus. In particular, 72 h of THC exposure induced neuronal and glia alterations that must draw our attention to the effects that relatively prolonged use might cause, especially in adolescents.

Keywords: CBD; PSD95; THC; astrocyte; clasmatodendrosis; neuron; organotypic hippocampal slice; toxicity.


Conflict of interest statement

The authors declare no conflict of interest.

Figures

Figure 1
Figure 1
Effects of THC or CBD incubation in organotypic hippocampal slices. (A) Experimental protocols. (B) Top left: hippocampal slices under normal conditions (background PI fluorescence). Bottom left: slice exposed to 10 mM glutamate, displaying intense PI labelling in all sub-regions. Hippocampal slices incubated with 1 µM THC 24 h (top centre), 10 µM CBD 24 h (bottom centre). Slices incubated with 1 µM THC 72 h (top right), 10 µM CBD 72 h (bottom right). (C,D) Quantitative analysis at 24 h (C) and 72 h (D) incubation with cannabinoids. Bars represent the mean ± SEM of at least four experiments. *** p < 0.001 vs. control (CRL) (ANOVA + Dunnett’s test).
Figure 2
Figure 2
Effects of prolonged incubation with THC or CBD on synaptophysin and PSD95 expression in organotypic hippocampal slices. (A,B) Illustrative blots using antibodies directed against synaptophysin (Top (A)) and PSD95 (Top (B)) and β-actin ((A) and (B) centre). Quantitative analysis of WB bands shows no significant changes in synaptophysin levels in all experimental conditions (Bottom (A)). Incubation with 1 µM THC for 72 h caused a significant decrease in PSD95 levels, while 10 µM CBD for 72 h induced significant increase in PSD95 levels (Bottom (B)). Bars represent the mean ± SEM of at least four experiments. * p < 0.05, ** p < 0.01 vs. CRL (ANOVA + Dunnett’s w-Test).
Figure 3
Figure 3
Prolonged THC or CBD exposure effects on neuronal viability. (AC) Confocal microscopy images of NeuN immunostaining of neurons in CA1 SP and SR of a CRL (A), THC (B), and CBD slice (C) acquired with a 20X objective. A–C scale bar: 75 µm. (A1C1) Enlargements of dotted areas of the corresponding slice in (AC). (A1): The image shows healthy neurons in CA1 SP. (B1): The image highlights the profound alteration of neurons caused by subchronic THC exposure. Arrowheads and open arrows point to HDN neurons and large HDN neurons, respectively. (C1): The image shows that CBD treatment did not alter neurons of CA1 SP, which show a healthy morphology. A1–C1 scale bar: 30 µm. (DH) Quantitative analyses of morphological alterations in CA1. (D) Thickness of CA1. Statistical analysis: one-way ANOVA p < 0.01; * p < 0.05 vs. CRL, Newman–Keuls post hoc test. (E) Density of HDN neurons in SP. Statistical analysis: one-way ANOVA p < 0.05; * p < 0.05 vs. CRL, Newman–Keuls post hoc test. (F) Density of LDN neurons. Statistical analysis: one-way ANOVA, not significant. (G) Density of large HDN neurons in SP. Statistical analysis: one-way ANOVA p < 0.01; ** p < 0.01 vs. CRL, Newman–Keuls post hoc test. (H) Density of large HDN neurons in SR. Statistical analysis: one-way ANOVA p < 0.0001; *** p < 0.001 vs. CRL, Newman–Keuls post hoc test). Bars represent the mean ± SEM of 6–8 experiments.
Figure 4
Figure 4
Effects of THC or CBD exposure on astrocytes viability. (AC) Confocal microscopy images of immunostaining of astrocytes (GFAP antibody, green) and neurons (NeuN antibody, red) in CA1 SP of a CRL (A), THC (B), and CBD slice (C) acquired with a 63X objective. Scale bar: 20 µm. (A1C1) Enlargements of the corresponding dotted areas in (AC) showing astrocytes in a CRL (A1), THC (B1), and CBD slice (C1). Scale bar: 15 µm. (A1): The enlargement shows astrocytes with a healthy morphology in CA1 SP. (B1): The enlargement shows the profound morphological alterations of astrocytes caused by the subchronic THC exposure. (C1): The image shows that after CBD treatment, morphological alterations of astrocytes are less evident. (D) Quantitative analysis of GFAP expression in CA1 SP. Statistical analysis: one-way ANOVA p < 0.01; * p < 0.05 vs. CRL; ** p < 0.01 vs. CRL, Newman–Keuls post hoc test. (E) Quantitative analysis of GFAP expression in CA1 SR. Statistical analysis: one-way ANOVA p < 0.05; * p < 0.05 vs. CRL, Newman–Keuls post hoc test. (F) Quantitative analysis of astrocytes branches length in CA1 SP. Statistical analysis: one-way ANOVA p < 0.0001; *** p < 0.001 vs. CRL; ** p <0.01 vs. CRL; ### p < 0.001 vs. THC, Newman–Keuls post hoc test. (G) Quantitative analysis of astrocytes branches length in CA1 SR. Statistical analysis: one-way ANOVA p < 0.0001; *** p < 0.05 vs. CRL; * p < 0.05 vs. CRL, ## p < 0.01 vs. THC, Newman–Keuls post hoc test. Bars represent the mean ± SEM of 6–8 experiments.
Figure 4
Figure 4
Effects of THC or CBD exposure on astrocytes viability. (AC) Confocal microscopy images of immunostaining of astrocytes (GFAP antibody, green) and neurons (NeuN antibody, red) in CA1 SP of a CRL (A), THC (B), and CBD slice (C) acquired with a 63X objective. Scale bar: 20 µm. (A1C1) Enlargements of the corresponding dotted areas in (AC) showing astrocytes in a CRL (A1), THC (B1), and CBD slice (C1). Scale bar: 15 µm. (A1): The enlargement shows astrocytes with a healthy morphology in CA1 SP. (B1): The enlargement shows the profound morphological alterations of astrocytes caused by the subchronic THC exposure. (C1): The image shows that after CBD treatment, morphological alterations of astrocytes are less evident. (D) Quantitative analysis of GFAP expression in CA1 SP. Statistical analysis: one-way ANOVA p < 0.01; * p < 0.05 vs. CRL; ** p < 0.01 vs. CRL, Newman–Keuls post hoc test. (E) Quantitative analysis of GFAP expression in CA1 SR. Statistical analysis: one-way ANOVA p < 0.05; * p < 0.05 vs. CRL, Newman–Keuls post hoc test. (F) Quantitative analysis of astrocytes branches length in CA1 SP. Statistical analysis: one-way ANOVA p < 0.0001; *** p < 0.001 vs. CRL; ** p <0.01 vs. CRL; ### p < 0.001 vs. THC, Newman–Keuls post hoc test. (G) Quantitative analysis of astrocytes branches length in CA1 SR. Statistical analysis: one-way ANOVA p < 0.0001; *** p < 0.05 vs. CRL; * p < 0.05 vs. CRL, ## p < 0.01 vs. THC, Newman–Keuls post hoc test. Bars represent the mean ± SEM of 6–8 experiments.

Similar articles

Cited by

References

    1. Zamberletti E., Gabaglio M., Grilli M., Prini P., Catanese A., Pittaluga A., Marchi M., Rubino T., Parolaro D. Long-term hippocampal glutamate synapse and astrocyte dysfunctions underlying the altered phenotype induced by adolescent THC treatment in male rats. Pharmacol. Res. 2016;111:459–470. doi: 10.1016/j.phrs.2016.07.008. - DOI - PubMed
    1. Hall W., Degenhardt L. The adverse health effects of chronic cannabis use. Drug Test. Anal. 2014;6:39–45. doi: 10.1002/dta.1506. - DOI - PubMed
    1. Filbey F.M., Schacht J.P., Myers U.S., Chavez R.S., Hutchison K.E. Marijuana craving in the brain. Proc. Natl. Acad. Sci. USA. 2009;106:13016–13021. doi: 10.1073/pnas.0903863106. - DOI - PMC - PubMed
    1. Weinstein A.M., Gorelick D.A. Pharmacological treatment of Cannabis dependence. Curr. Pharm. Des. 2011;17:1351–1358. doi: 10.2174/138161211796150846. - DOI - PMC - PubMed
    1. Wölfling K., Flor H., Grüsser S.M. Psychophysiological responses to drug-associated stimuli in chronic heavy cannabis use. Eur. J. Neurosci. 2008;27:976–983. doi: 10.1111/j.1460-9568.2008.06051.x. - DOI - PubMed