. 2022 Feb 20;10(2):99.
doi: 10.3390/toxics10020099.

Nonylphenol Polyethoxylates Enhance Adipose Deposition in Developmentally Exposed Zebrafish

Affiliations

Nonylphenol Polyethoxylates Enhance Adipose Deposition in Developmentally Exposed Zebrafish

Christopher D Kassotis et al. Toxics. .

Erratum in

Abstract

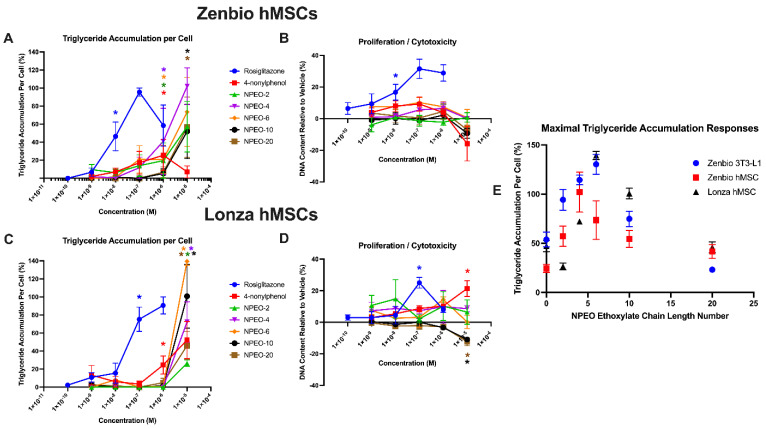
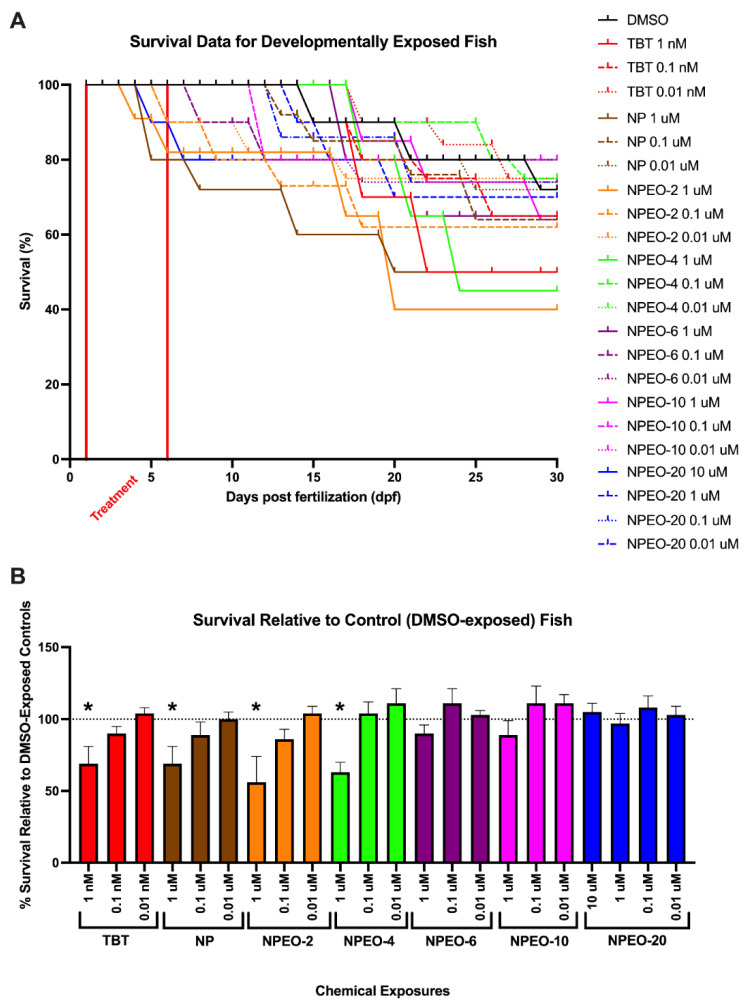
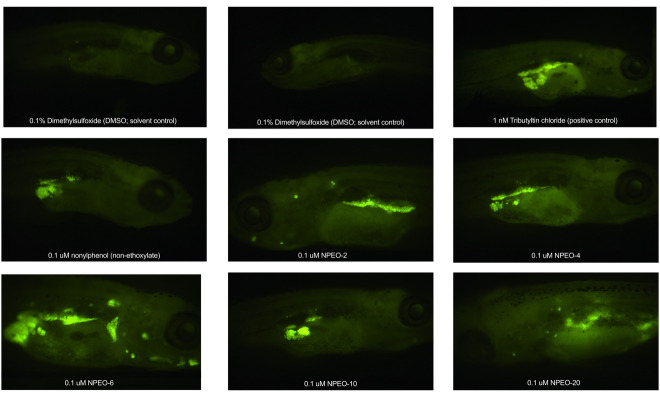
Alkylphenol polyethoxylates (APEOs), such as nonylphenol ethoxylates (NPEOs), are high-production-volume surfactants used in laundry detergents, hard-surface cleaners, pesticide formulations, textile production, oils, paints, and other products. NPEOs comprise -80% of the total production of APEOs and are widely reported across diverse environmental matrices. Despite a growing push for replacement products, APEOs continue to be released into the environment through wastewater at significant levels. Research into related nonionic surfactants from varying sources has reported metabolic health impacts, and we have previously demonstrated that diverse APEOs and alcohol polyethoxylates promote adipogenesis in the murine 3T3-L1 pre-adipocyte model. These effects appeared to be independent of the base alkylphenol and related to the ethoxylate chain length, though limited research has evaluated NPEO exposures in animal models. The goals of this study were to assess the potential of NPEOs to promote adiposity (Nile red fluorescence quantification) and alter growth and/or development (toxicity, length, weight, and energy expenditure) of developmentally exposed zebrafish (Danio rerio). We also sought to expand our understanding of the ability to promote adiposity through evaluation in human mesenchymal stem cells. Herein, we demonstrated consistent adipogenic effects in two separate human bone-marrow-derived mesenchymal stem cell models, and that nonylphenol and its ethoxylates promoted weight gain and increased adipose deposition in developmentally exposed zebrafish. Notably, across both cell and zebrafish models we report increasing adipogenic/obesogenic activity with increasing ethoxylate chain lengths up to maximums around NPEO-6 and then decreasing activity with the longest ethoxylate chain lengths. This research suggests metabolic health concerns for these common obesogens, suggesting further need to assess molecular mechanisms and better characterize environmental concentrations for human health risk assessments.

Keywords: adipogenesis; alkylphenol ethoxylates; endocrine disrupting chemicals; ethoxylated surfactants; mixtures; obesogen.


Conflict of interest statement

The authors declare no conflict of interest.

Figures

Figure 1
Figure 1
Nonylphenol and polyethoxylates promote adipogenesis in human mesenchymal stem cell models. Zenbio and Lonza human bone marrow–derived mesenchymal stem cell models were differentiated as described in Methods and assessed for adipocyte differentiation (Nile Red staining of lipid accumulation) and cell proliferation (Hoechst staining) after 14/21 (respectively) days of differentiation while exposed to controls chemicals as well as nonylphenol and its ethoxylates. Percent normalized triglyceride accumulation per cell relative to maximal rosiglitazone response (normalized to DNA content) (A,C). increase (cell proliferation) or decrease (potential cytotoxicity) in DNA content relative to vehicle control (B,D). Zenbio–sourced cell data provided in (A,B), and Lonza–sourced cell data provided in (C,D). Data presented as mean ± SEM from three independent experiments. * indicates lowest concentration with significant increase in triglyceride over vehicle control or cell proliferation/cytotoxicity relative to vehicle control, p < 0.05, as per Kruskal–Wallis in GraphPad Prism 9. X–axis format is provided in log scale. Panel (E) provides a summary plot of maximal effects on triglyceride accumulation based on ethoxylate chain length across cell models, comparing results from panels (A,C) with previously published effects in 3T3–L1 cells (PMID: 29106673). NPEO = nonylphenol polyethoxylated (with varying average ethoxylate chain lengths).
Figure 2
Figure 2
Lethality of nonylphenol and polyethoxylates in developmentally exposed zebrafish. Zebrafish were developmentally exposed to control chemicals, nonylphenol, or nonylphenol polyethoxylates from one through six days post-fertilization. Following exposures, fish were aged to 30 days post-fertilization. Lethality was measured twice daily to determine survivorship across test chemicals and treatments for each test chemical (A). n = 15 replicate fish in each biological replicate (spawning event) for each test chemical and concentration, and four spawns were performed (four biological replicates) and averaged for responses depicted here, for approximately 60 fish evaluated per experimental group. Lethality is depicted in survivorship curves, with decreasing response on the Y axis depicting greater lethality of the test chemicals. Survival percent relative to DMSO vehicle control exposed fish at 30 days (B). * indicates significant change in survival compared to vehicle control fish, p < 0.05, as per Kruskal–Wallis test with Dunn’s multiple comparisons. TBT 10 nM, NP 10 μM, NPEO-2 10 μM, NPEO-4 10 μM, NPEO-6 10 μM, and NPEO-10 10 μM promoted absolute toxicity (no surviving fish) and thus are not depicted here for the purposes of clarity. DMSO = dimethylsulfoxide, vehicle control; TBT = tributyltin chloride; NPEO = nonylphenol polyethoxylated (with varying average ethoxylate chain lengths).
Figure 3
Figure 3
Metabolic activity in zebrafish developmentally exposed to nonylphenol and polyethoxylates. Zebrafish were developmentally exposed to control chemicals, nonylphenol, or nonylphenol polyethoxylates. Immediately following exposure, at six days post-fertilization, metabolic activity was measured using the alamar blue assay. Two groups of three replicate fish were transferred into wells of a 24-well black clear-bottom plate, media removed, and alamar blue solution added to wells. Plates were immediately read for fluorescence, then incubated in the dark for several hours, before measuring fluorescence again. The increase in fluorescence is correlated with increased metabolic activity in the fish. Chemical exposure treated fish responses were compared with dimethylsulfoxide (0.1%, vehicle control) treated fish to determine significant differences. n = 6–9 replicate fish in each biological replicate (spawning event), and three spawns were performed for approximately 24 fish per exposure group. * indicates significant change in arbitrary fluorescence compared to vehicle control fish, p < 0.05, as per Kruskal–Wallis test with Dunn’s multiple comparisons. DMSO = dimethylsulfoxide, vehicle control; TBT = tributyltin chloride; NPEO = nonylphenol polyethoxylated (with varying average ethoxylate chain lengths). # represents p < 0.10, as per statistics described above. Box and whisker plots depict the following metrics: whiskers represent 10–90th percentiles, box bounds represent the 25th to 75th percentiles, and the middle line represents the median.
Figure 4
Figure 4
Growth trajectories in zebrafish developmentally exposed to nonylphenol and polyethoxylates. Zebrafish were developmentally exposed to control chemicals, nonylphenol, or nonylphenol polyethoxylates; aged to 30 days post−fertilization; then measured and stained with Nile Red (0.5 μg/mL) for 30 min. Zebrafish were imaged and standard length of each fish was measured (A) using the integrated point−to−point measurement tool within the Leica software, which scales by magnification. Following imaging, zebrafish were blotted with kim wipes and weighed on a microbalance to obtain total body weights (B) for each fish and then averaged across test chemicals and concentrations. Zebrafish body mass index (C) was calculated by dividing the calculated standard length and weights and correcting measurement units to g/m2. n = 24 (DMSO), 16, 21, 25, 15, 20, 24, 14, 21, 25, 15, 25, 27, 22, 28, 25, 22, 27, 26, 25, 23, 26, and 25 across four spawning events (biological replicates) for exposure groups listed below, respectively. * indicates significant increase in total body fluorescence quantification over vehicle control fish, p < 0.05, as per Kruskal–Wallis test with Dunn’s multiple comparisons. DMSO = dimethylsulfoxide, vehicle control; TBT = tributyltin chloride; NPEO = nonylphenol polyethoxylated (with varying average ethoxylate chain lengths). # represents p < 0.10, as per statistics described above. Box and whisker plots depict the following metrics: whiskers represent 10–90th percentiles, box bounds represent the 25th to 75th percentiles, and the middle line represents the median.
Figure 5
Figure 5
Adipose Deposition in Zebrafish Developmentally Exposed to Nonylphenol and Polyethoxylates. Zebrafish were developmentally exposed to control chemicals, nonylphenol, or nonylphenol polyethoxylates; aged to 30 days post-fertilization; then measured and stained with Nile Red (0.5 μg/mL) for 30 min. Total body fluorescence (A) was imaged at 16× magnification using a yellow fluorescent protein filter (representative images in Figure 6) and fluorescence was quantified for each fish and then biological replicates were averaged. n = 24 (DMSO), 16, 21, 25, 15, 20, 24, 14, 21, 25, 15, 25, 27, 22, 28, 25, 22, 27, 26, 25, 23, 26, and 25 across four spawning events (biological replicates) for exposure groups listed below, respectively. * indicates significant increase in total body fluorescence quantification over vehicle control fish, p < 0.05, as per Kruskal–Wallis test with Dunn’s multiple comparisons. # represents p < 0.10, as per statistics described above. Box and whisker plots depict the following metrics: whiskers represent 10–90th percentiles, box bounds represent the 25th to 75th percentiles, and the middle line represents the median. Developmental trajectory of adipose depots across the zebrafish (B). Relative proportions of fish exhibiting fluorescing adipocytes in each depot in the DMSO fish were set as “normal” and the heat map depicts increased proportions of fish in each group with visible adipocytes in each depot. Adipose depots labeled as per the developmental guides provided in Minchin and Rawls, 2017 (PMID: 28348140) and grouped based on anatomical classifications. A value of 9 represents a 9X increase in the proportion of fish in an exposure group PVAT = pancreatic visceral adipose tissue; AVAT = abdominal visceral adipose tissue; RVAT = renal visceral adipose tissue; aCVAT = anterior cardiac visceral adipose tissue; cPOS = central paraosseal non-visceral adipose tissue; OES = esophageal non-visceral adipose tissue; LSAT = lateral truncal adipose tissue; pOCU = posterior ocular adipose tissue; aOCU = anterior ocular adipose tissue; vOCU = ventral ocular adipose tissue; BHD = basihyal hyoid adipose tissue; CHD = ceratohyal hyoid adipose tissue; vOPC = ventral opercular adipose tissue; dOPC = dorsal opercular adipose tissue; and UHD = urihyal hyoid adipose tissue. DMSO = dimethylsulfoxide, vehicle control; TBT = tributyltin chloride; NPEO = nonylphenol polyethoxylated (with varying average ethoxylate chain lengths).
Figure 6
Figure 6
Adipose Patterning in Zebrafish Developmentally Exposed to Nonylphenol and Polyethoxylates. Representative fluorescent images of developmentally exposed zebrafish exposed to control chemicals, nonylphenol, and the nonylphenol polyethoxylates. Anesthetized fish imaged at 30 days post-fertilization, following a 30 min stain (0.5 μg/mL Nile Red). Images obtained at 16× magnification using a yellow fluorescent protein filter. DMSO = dimethylsulfoxide, vehicle control; TBT = tributyltin chloride; NPEO = nonylphenol polyethoxylated (with varying average ethoxylate chain lengths).

Similar articles

Cited by

References

    1. Marcomini A., Filipuzzi F., Giger W. Aromatic surfactants in laundry detergents and hard-surface cleaners: Linear alkylbenzenesulphonates and alkylphenol polyethoxylates. Chemosphere. 1988;17:853–863. doi: 10.1016/0045-6535(88)90058-6. - DOI
    1. Marcomini A., Stelluto S., Pavoni B. Determination of Linear Alkylbenzenesulphonates and Alkylphenol Polyethoxylates in Commercial Products and Marine Waters by Reversed- and Normal-Phase Hplc. Int. J. Environ. Anal. Chem. 1989;35:207–218. doi: 10.1080/03067318908028395. - DOI
    1. Maguire R.J. Review of the Persistence of Nonylphenol and Nonylphenol Ethoxylates in Aquatic Environments. Water Qual. Res. J. 1999;34:37–78. doi: 10.2166/wqrj.1999.003. - DOI
    1. Ying G.-G., Williams B., Kookana R. Environmental fate of alkylphenols and alkylphenol ethoxylates—A review. Environ. Int. 2002;28:215–226. doi: 10.1016/S0160-4120(02)00017-X. - DOI - PubMed
    1. Loos R., Hanke G., Umlauf G., Eisenreich S.J. LC–MS–MS analysis and occurrence of octyl- and nonylphenol, their ethoxylates and their carboxylates in Belgian and Italian textile industry, waste water treatment plant effluents and surface waters. Chemosphere. 2007;66:690–699. doi: 10.1016/j.chemosphere.2006.07.060. - DOI - PubMed

LinkOut - more resources