

Protein prediction for trait mapping in diverse populations
- PMID: 35202437
- PMCID: PMC8870552
- DOI: 10.1371/journal.pone.0264341
Protein prediction for trait mapping in diverse populations
Abstract
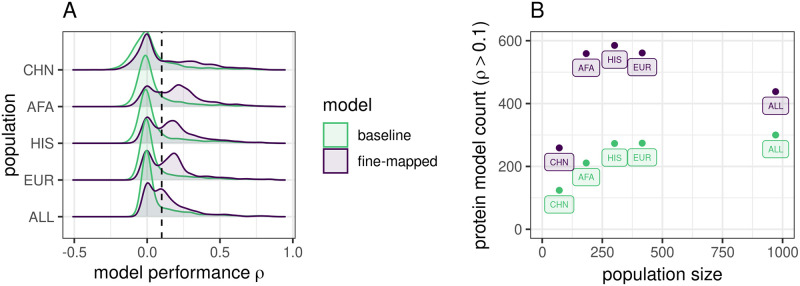
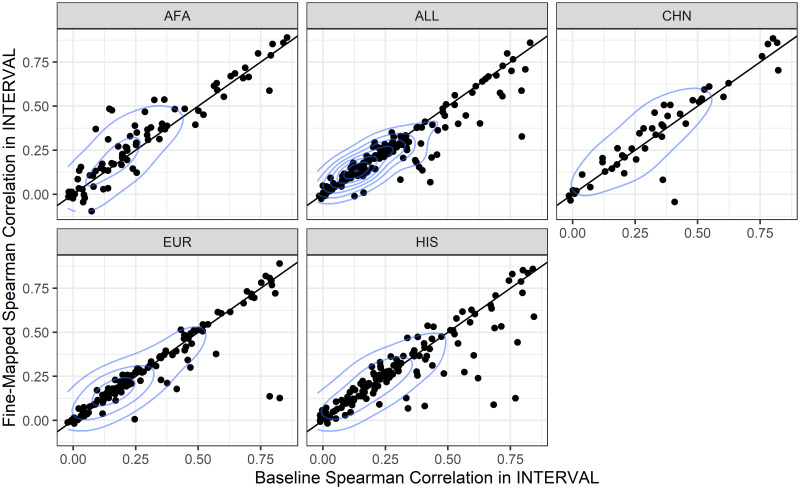
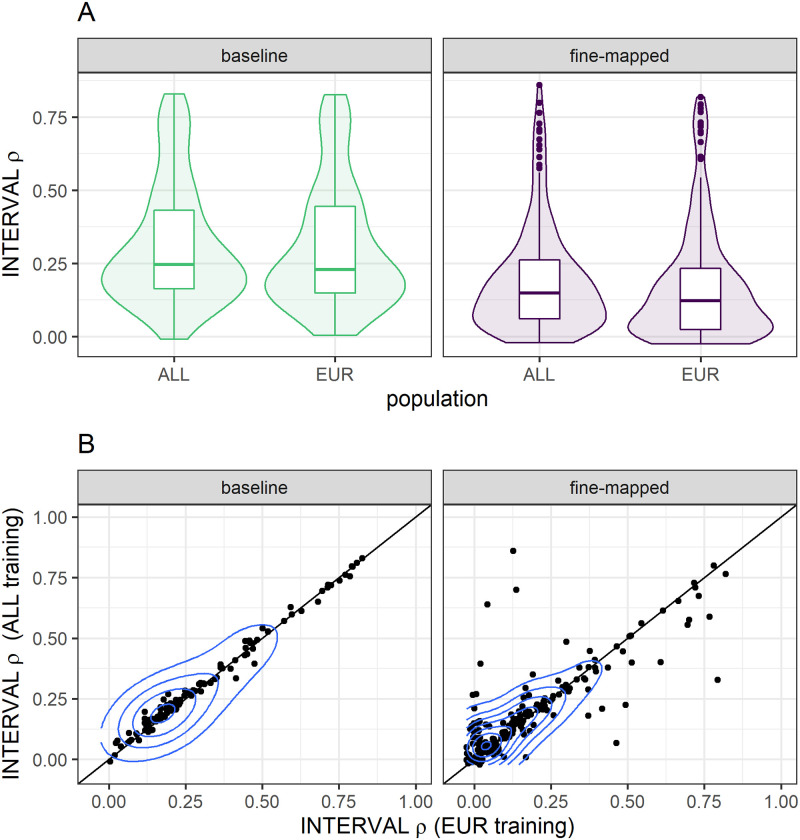
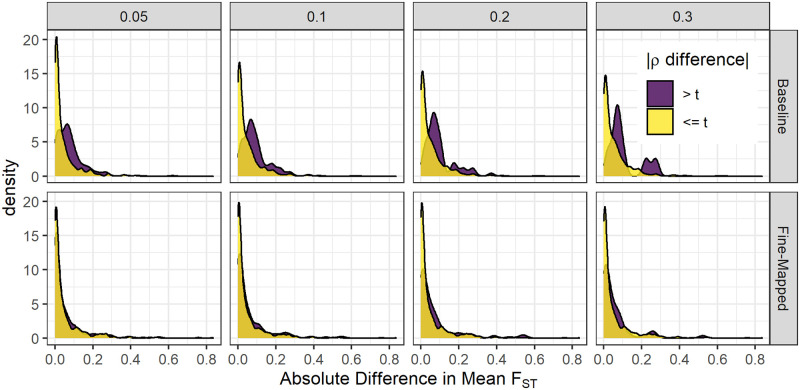
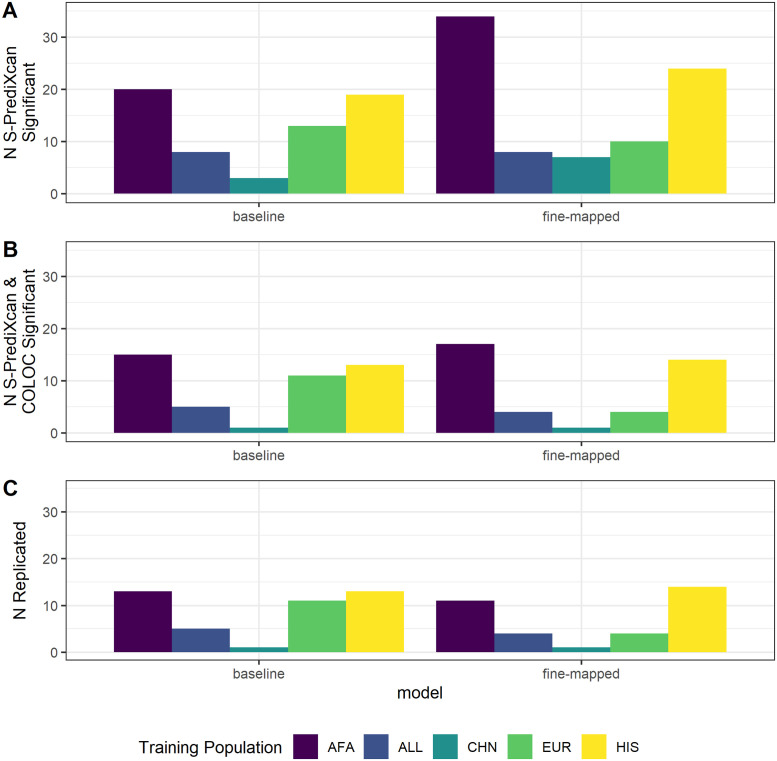
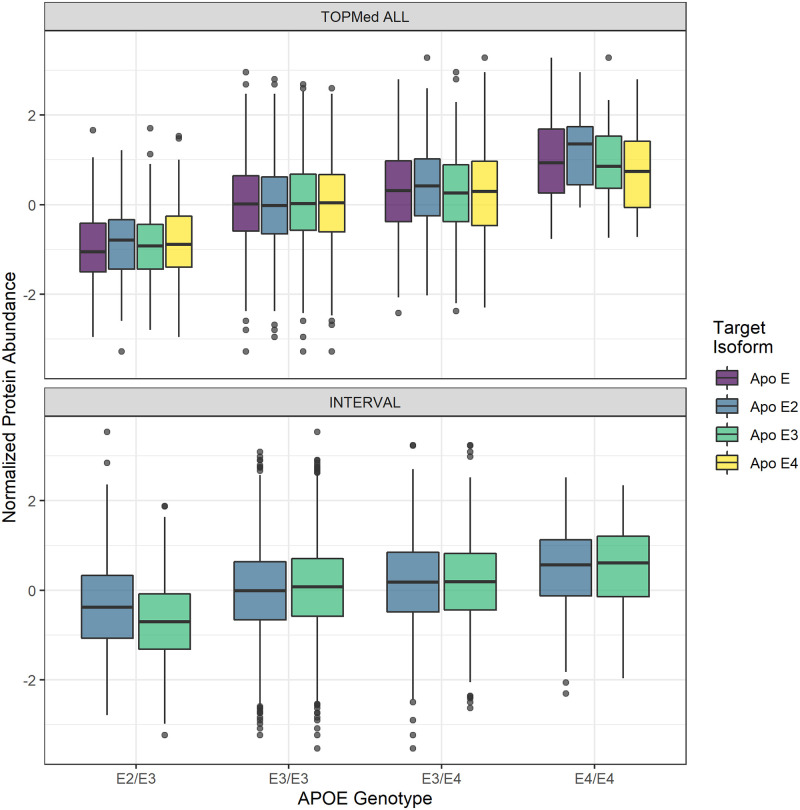
Genetically regulated gene expression has helped elucidate the biological mechanisms underlying complex traits. Improved high-throughput technology allows similar interrogation of the genetically regulated proteome for understanding complex trait mechanisms. Here, we used the Trans-omics for Precision Medicine (TOPMed) Multi-omics pilot study, which comprises data from Multi-Ethnic Study of Atherosclerosis (MESA), to optimize genetic predictors of the plasma proteome for genetically regulated proteome-wide association studies (PWAS) in diverse populations. We built predictive models for protein abundances using data collected in TOPMed MESA, for which we have measured 1,305 proteins by a SOMAscan assay. We compared predictive models built via elastic net regression to models integrating posterior inclusion probabilities estimated by fine-mapping SNPs prior to elastic net. In order to investigate the transferability of predictive models across ancestries, we built protein prediction models in all four of the TOPMed MESA populations, African American (n = 183), Chinese (n = 71), European (n = 416), and Hispanic/Latino (n = 301), as well as in all populations combined. As expected, fine-mapping produced more significant protein prediction models, especially in African ancestries populations, potentially increasing opportunity for discovery. When we tested our TOPMed MESA models in the independent European INTERVAL study, fine-mapping improved cross-ancestries prediction for some proteins. Using GWAS summary statistics from the Population Architecture using Genomics and Epidemiology (PAGE) study, which comprises ∼50,000 Hispanic/Latinos, African Americans, Asians, Native Hawaiians, and Native Americans, we applied S-PrediXcan to perform PWAS for 28 complex traits. The most protein-trait associations were discovered, colocalized, and replicated in large independent GWAS using proteome prediction model training populations with similar ancestries to PAGE. At current training population sample sizes, performance between baseline and fine-mapped protein prediction models in PWAS was similar, highlighting the utility of elastic net. Our predictive models in diverse populations are publicly available for use in proteome mapping methods at https://doi.org/10.5281/zenodo.4837327.
Conflict of interest statement
The authors have declared that no competing interests exist.
Figures
References
-
- Neale BM. UK Biobank GWAS—Neale Lab; 2018. Available from: http://www.nealelab.is/uk-biobank/.
-
- Wheeler E, Leong A, Liu CT, Hivert MF, Strawbridge RJ, Podmore C, et al. Impact of common genetic determinants of Hemoglobin A1c on type 2 diabetes risk and diagnosis in ancestrally diverse populations: A transethnic genome-wide meta-analysis. PLoS medicine. 2017;14(9):e1002383–e1002383. doi: 10.1371/journal.pmed.1002383 - DOI - PMC - PubMed
Publication types
MeSH terms
Substances
Grants and funding
- UL1 RR033176/RR/NCRR NIH HHS/United States
- R01 HL071259/HL/NHLBI NIH HHS/United States
- 75N92020D00001/HL/NHLBI NIH HHS/United States
- U01 HL120393/HL/NHLBI NIH HHS/United States
- R01 HL071250/HL/NHLBI NIH HHS/United States
- N01 HC095167/HL/NHLBI NIH HHS/United States
- HHSN268201500003I/HL/NHLBI NIH HHS/United States
- R01 HL071205/HL/NHLBI NIH HHS/United States
- N01 HC095166/HL/NHLBI NIH HHS/United States
- R01 HL071258/HL/NHLBI NIH HHS/United States
- P30 DK020595/DK/NIDDK NIH HHS/United States
- N01 HC095160/HL/NHLBI NIH HHS/United States
- 75N92020D00002/HL/NHLBI NIH HHS/United States
- HHSN268201500003C/HL/NHLBI NIH HHS/United States
- N01 HC095161/HL/NHLBI NIH HHS/United States
- 75N92020D00005/HL/NHLBI NIH HHS/United States
- N01 HC095168/HL/NHLBI NIH HHS/United States
- R01 HL071251/HL/NHLBI NIH HHS/United States
- R01 HL120393/HL/NHLBI NIH HHS/United States
- UL1 TR001079/TR/NCATS NIH HHS/United States
- N02 HL064278/HL/NHLBI NIH HHS/United States
- N01 HC095169/HL/NHLBI NIH HHS/United States
- MR/L003120/1/MRC_/Medical Research Council/United Kingdom
- N01 HC095159/HL/NHLBI NIH HHS/United States
- 75N92020D00003/HL/NHLBI NIH HHS/United States
- P30 DK063491/DK/NIDDK NIH HHS/United States
- R01 HL071051/HL/NHLBI NIH HHS/United States
- HHSN268201800001C/HL/NHLBI NIH HHS/United States
- R15 HG009569/HG/NHGRI NIH HHS/United States
- UL1 TR001420/TR/NCATS NIH HHS/United States
- 75N92020D00004/HL/NHLBI NIH HHS/United States
- N01 HC095163/HL/NHLBI NIH HHS/United States
- 75N92020D00007/HL/NHLBI NIH HHS/United States
- UL1 TR000040/TR/NCATS NIH HHS/United States
- WT_/Wellcome Trust/United Kingdom
- 75N92020D00006/HL/NHLBI NIH HHS/United States
- R01 HL117626/HL/NHLBI NIH HHS/United States
- N01 HC095162/HL/NHLBI NIH HHS/United States
- UL1 TR001881/TR/NCATS NIH HHS/United States
- N01 HC095165/HL/NHLBI NIH HHS/United States
- N01 HC095164/HL/NHLBI NIH HHS/United States
LinkOut - more resources
Full Text Sources
Medical
Research Materials
