. 2022 Mar 15;225(6):jeb243738.
doi: 10.1242/jeb.243738. Epub 2022 Mar 28.

Context-dependent influence of threat on honey bee social network dynamics and brain gene expression

Affiliations

Context-dependent influence of threat on honey bee social network dynamics and brain gene expression

Ian M Traniello et al. J Exp Biol. .

Abstract

Adverse social experience affects social structure by modifying the behavior of individuals, but the relationship between an individual's behavioral state and its response to adversity is poorly understood. We leveraged naturally occurring division of labor in honey bees and studied the biological embedding of environmental threat using laboratory assays and automated behavioral tracking of whole colonies. Guard bees showed low intrinsic levels of sociability compared with foragers and nurse bees, but large increases in sociability following exposure to a threat. Threat experience also modified the expression of caregiving-related genes in a brain region called the mushroom bodies. These results demonstrate that the biological embedding of environmental experience depends on an individual's societal role and, in turn, affects its future sociability.

Keywords: Apis mellifera; Automated behavioral tracking; Biological embedding; Neurogenomics; Social insects.


Conflict of interest statement

Competing interests The authors declare no competing or financial interests.

Figures
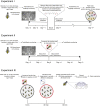
Fig. 1.
Fig. 1.
Overview of experimental design and analysis. Experiment I: bees were barcoded, transferred to an observation hive, and allowed to age for 3 days prior to the first day of observation (corresponding to 3 days prior to treatment). On day 0, bees were removed and treated with juvenile hormone analog (JHA), acetone or cold anesthesia, and returned to the observation hive. At the end of the experiment, bees were removed, paint-marked and transferred to small dishes for behavioral observations. In dish cartoon (far right), colors correspond to the following behavioral states, as described in the Materials and Methods: generalist, dark green; forager, orange; nurse, purple; guard, pink; non-responder, light green; background, yellow. Experiment II: general design was similar to that of experiment I, but automated monitoring did not begin until the bees in the observation hive were allowed to age undisturbed for 4 days. On day 0, 35 intruder bees were added to the observation hive to generate a colony disturbance, which lasted ∼5 min. Resident bees were left undisturbed for the remainder of the experiment. Experiment III: bees were paint-marked, added to dishes and left undisturbed for 7 days. At 0 min on day 7, a single intruder bee or negative control was added to each dish; the intruder was removed after 5 min, regardless of vital status. Resident bees were then left undisturbed for 60 min, after which a larva was introduced for 5 min. Dishes were then left undisturbed for 30 min, after which nurses (bees that displayed affiliative caregiving toward the larva and did not respond aggressively toward the intruder in the previous assay) were collected for mushroom body gene expression analysis via qPCR. Images are not drawn to scale.
Fig. 2.
Fig. 2.
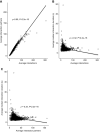
Metrics of honey bee sociability are highly correlated with each other. (A) A strong positive correlation exists between the number of interactions and the number of interaction partners. (B) Moderate negative correlations were found between interaction duration and the number of interactions and (C) interaction partners. Spearman's correlation, P<2.2e-16 for all comparisons. Analyses were performed with data averaged across all days of the experiment (n=5779 bees observed in eight observation hives). Shaded areas around the regression lines represent 95% confidence intervals.
Fig. 3.
Fig. 3.
The total numbers of interactions and interaction partners were stable over time, but not the median interaction duration for individual honey bees. Correlograms depict Spearman's correlation between days of observation before (day −) and after (day +) colony-wide perturbation (see Materials and Methods). The correlation coefficient of each comparison is listed for all comparisons; underlying circles, shown only for significant comparisons, are colored according to the correlation coefficient as depicted by the color bar on the right, and circle diameter represents the absolute value of the coefficient. Red Xs denote correlations that were below a P-value of 1e-10 (n=5779 bees observed in eight observation hives).
Fig. 4.
Fig. 4.
Task-related and individual differences in sociability in trophallaxis social network. (A–C) Violin plots depict the mean number of interactions (A), interaction partners (B) or median interaction duration (C) over the last 2 days of the experiment, log-scaled and normalized to the mean value of the relevant metric in baseline bees (n=1526 bees across six observation hives). Letters designate significantly different groups after Tukey correction (P<0.005). Violin plots are constructed as follows: raw data are shown as points, solid black line represents mean with 95% confidence interval as pale white above and below, whiskers show lower and upper quartiles (25% and 75%, respectively), and overall plot shape represents a smoothed density curve outlining the complete data distribution.
Fig. 5.
Fig. 5.
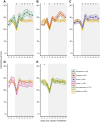
Colony perturbation causes long-term changes in sociability in all task-related behavioral groups except guards. Contrasts between baseline bees and either behavioral groups or non-responders for each day of the experiment reveal sustained differences in sociability for (A) generalists, (B) foragers or (C) nurses, but not (D) guards or (E) non-responders (GLMM with Šidák-corrected contrasts, *P<0.05) following perturbation (n=1526 bees across six observation hives). Shaded areas around line graphs represent the 95% confidence interval; gray shaded rectangle represents time post-perturbation.
Fig. 6.
Fig. 6.
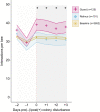
Automated behavioral monitoring reveals changes in sociability following colony disturbance. Bees that responded aggressively to colony disturbance (‘guards’, pink) showed an increase in the frequency of social interactions relative to a negative behavioral control (‘baseline’, yellow) shortly after the disturbance (day 0, morning), and this effect persisted for the remainder of the experiment (days +1, +2 and +3). Significance (P<0.05, black asterisk) is based on total daily social interactions in guards compared with baseline. We found no differences between bees that tended to the queen (‘retinue’, blue) and baseline for any day pre- or post-disturbance. Y-axis represents average interactions per bee per day. n=3878 bees across five observation hives. All P-values resulting from post hoc comparisons are corrected for multiple testing via the Šidák method. ‘Day’ is denoted relative to the disturbance (i.e. day 0 is the day of the disturbance, day −2 is 2 days prior to the disturbance, day +2 is 2 days after the disturbance, etc.). Shaded areas around line graphs represent the 95% confidence interval; gray shaded rectangle represents time post-disturbance.
Fig. 7.
Fig. 7.
Social adversity affects affiliative caregiving and brain gene expression. (A) Threat-experienced nurses displayed significantly less caregiving than threat-naïve nurses (that received an inanimate ‘control’ object); to avoid the possibility that physical harm reduced caregiving performance, we only considered nurses that did not engage the intruder. Linear mixed model, P<0.05, n=35 threat-experienced and 39 threat-naïve nurse bees. Affiliative caregiving scores were log-transformed (see Materials and Methods). (B) Mushroom body qPCR results showed consistent differences in gene expression between threat-experienced and -naïve groups. Letters denote P<0.05, Tukey’s HSD post hoc tests following ANOVA; n=16–18 individual bees per group. Sample sizes are pooled across two colonies, assayed separately. Statistical details are shown in Table 1. Violin plots were constructed as described in Fig. 3.

References

    1. Alaux, C. and Robinson, G. E. (2007). Alarm pheromone induces immediate-early gene expression and slow behavioral response in honey bees. J. Chem. Ecol. 33, 1346-1350. 10.1007/s10886-007-9301-6 - DOI - PubMed
    1. Amdam, G. V., Rueppell, O., Fondrk, M. K., Page, R. E. and Nelson, C. M. (2009). The nurse's load: early-life exposure to brood-rearing affects behavior and lifespan in honey bees (Apis mellifera). Exp. Gerontol. 44, 467-471. 10.1016/j.exger.2009.02.013 - DOI - PMC - PubMed
    1. Ament, S. A., Wang, Y. and Robinson, G. E. (2010). Nutritional regulation of division of labor in honey bees: toward a systems biology perspective. Wiley Interdiscip. Rev. Syst. Biol. Med. 2, 566-576. 10.1002/wsbm.73 - DOI - PubMed
    1. Aristizabal, M. J., Anreiter, I., Halldorsdottir, T., Odgers, C. L., McDade, T. W., Goldenberg, A., Mostafavi, S., Kobor, M. S., Binder, E. B., Sokolowski, M. B.et al. (2019). Biological embedding of experience: A primer on epigenetics. Proc. Natl. Acad. Sci. U. S. A. 117, 23261-23269. 10.1073/pnas.1820838116 - DOI - PMC - PubMed
    1. Arundell, K. L., Wedell, N., Dunn, A. M. (2014). The impact of predation risk and of parasitic infection on parental care in brooding crustaceans. Anim. Behav. 96, 97-105. 10.1016/j.anbehav.2014.08.002 - DOI

Publication types