. 2022 Jun 3;145(5):1726-1742.
doi: 10.1093/brain/awac079.

A new form of axonal pathology in a spinal model of neuromyelitis optica

Affiliations

A new form of axonal pathology in a spinal model of neuromyelitis optica

Marina Herwerth et al. Brain. .

Abstract

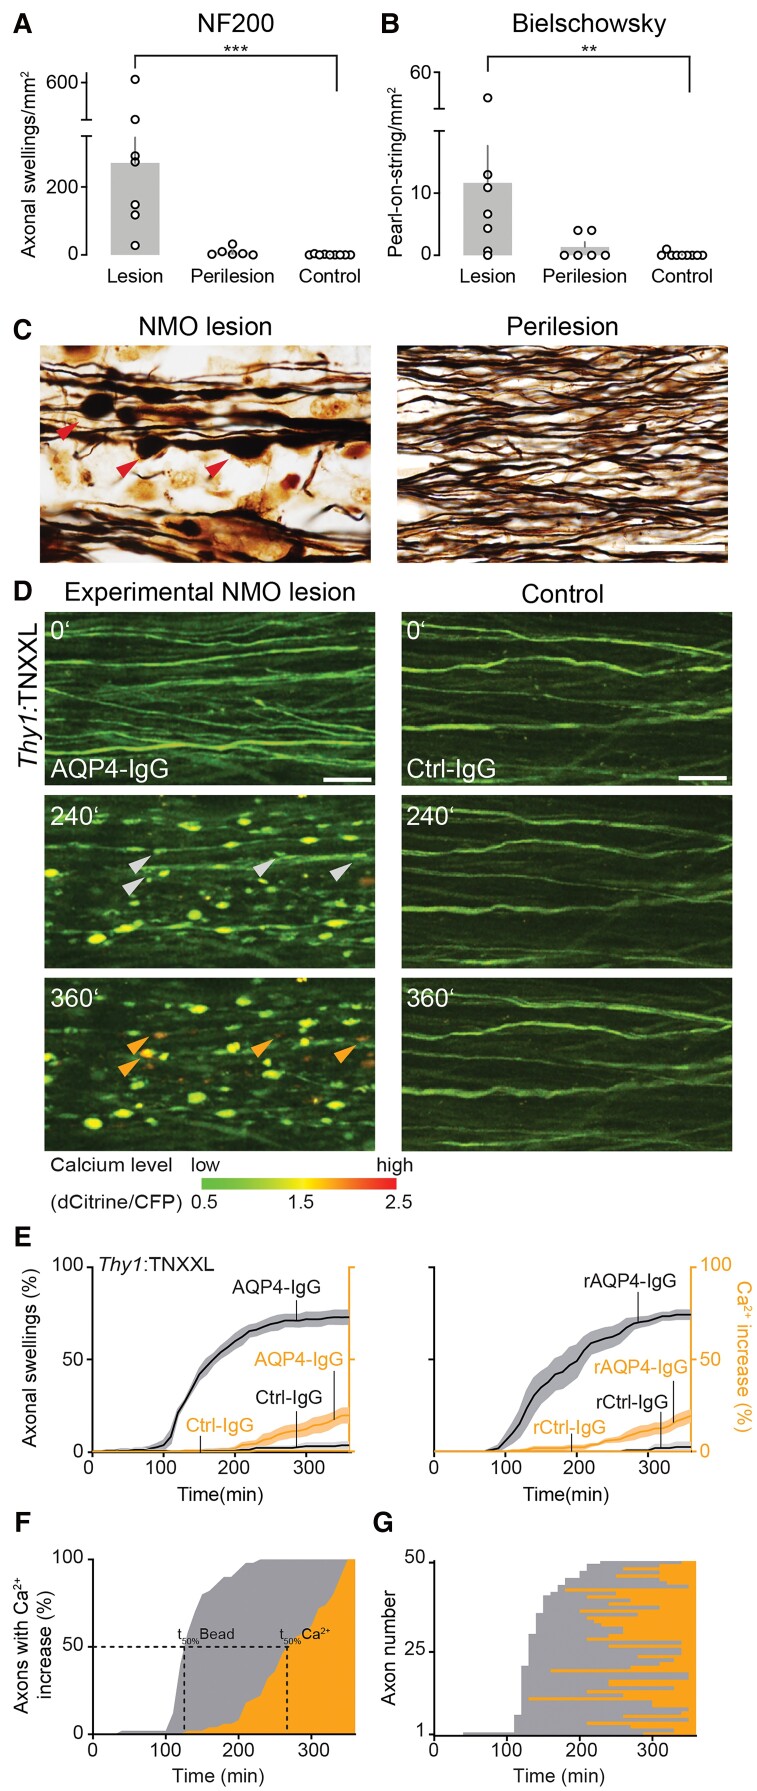
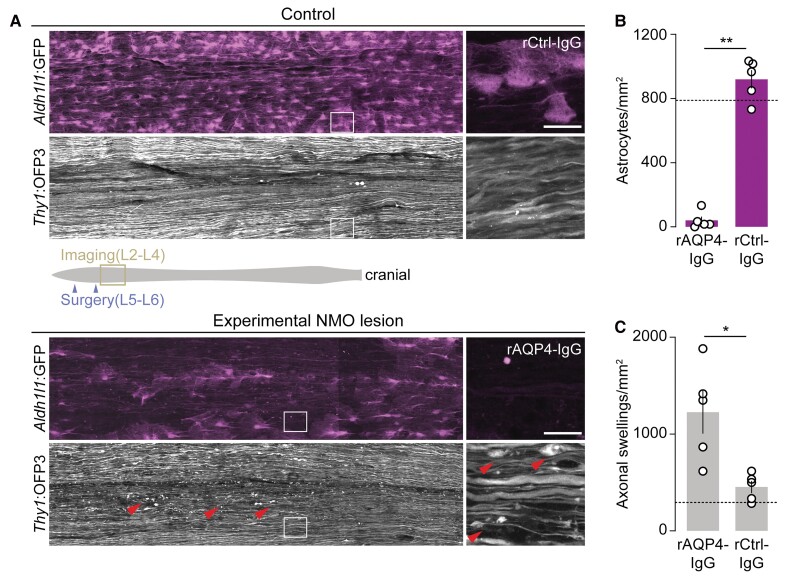
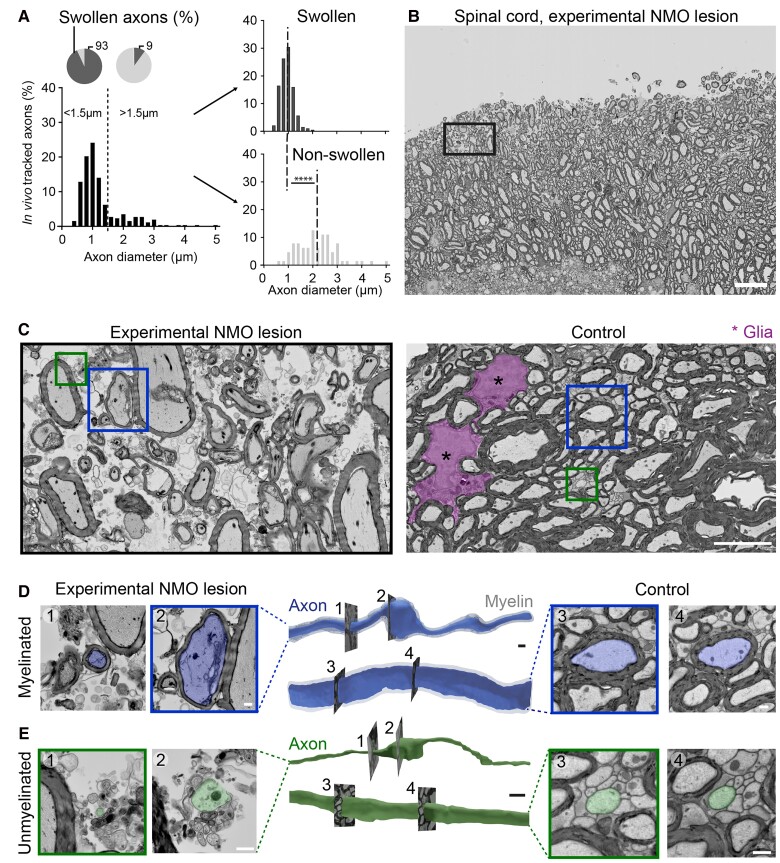
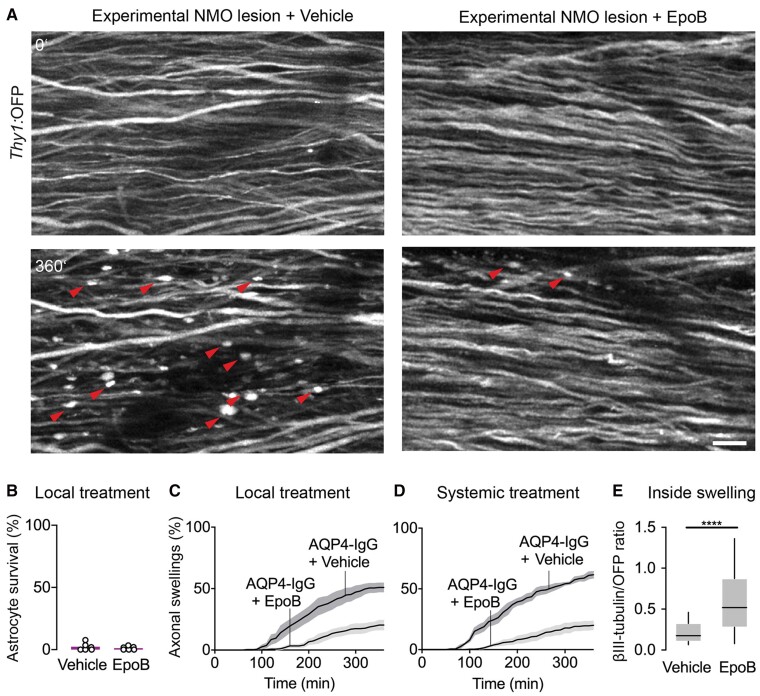
Neuromyelitis optica is a chronic neuroinflammatory disease, which primarily targets astrocytes and often results in severe axon injury of unknown mechanism. Neuromyelitis optica patients harbour autoantibodies against the astrocytic water channel protein, aquaporin-4 (AQP4-IgG), which induce complement-mediated astrocyte lysis and subsequent axon damage. Using spinal in vivo imaging in a mouse model of such astrocytopathic lesions, we explored the mechanism underlying neuromyelitis optica-related axon injury. Many axons showed a swift and morphologically distinct 'pearls-on-string' transformation also readily detectable in human neuromyelitis optica lesions, which especially affected small calibre axons independently of myelination. Functional imaging revealed that calcium homeostasis was initially preserved in this 'acute axonal beading' state, ruling out disruption of the axonal membrane, which sets this form of axon injury apart from previously described forms of traumatic and inflammatory axon damage. Morphological, pharmacological and genetic analyses showed that AQP4-IgG-induced axon injury involved osmotic stress and ionic overload, but does not appear to use canonical pathways of Wallerian-like degeneration. Subcellular analysis demonstrated remodelling of the axonal cytoskeleton in beaded axons, especially local loss of microtubules. Treatment with the microtubule stabilizer epothilone, a putative therapy approach for traumatic and degenerative axonopathies, prevented axonal beading, while destabilizing microtubules sensitized axons for beading. Our results reveal a distinct form of immune-mediated axon pathology in neuromyelitis optica that mechanistically differs from known cascades of post-traumatic and inflammatory axon loss, and suggest a new strategy for neuroprotection in neuromyelitis optica and related diseases.

Keywords: aquaporin-4; astrocytopathy; neurodegeneration; neuroinflammation; neuromyelitis optica.


Figures

Figure 1
Figure 1
Axonal beading occurs in NMO lesions and precedes calcium rise. (A) Density of beaded axons quantified in NF200 staining and (B) Bielschowsky silver impregnations. NMO lesions (beaded axons/μm2: Bielschowsky: 11.7 ± 6.0, NF200: 271.1 ± 75.6; n = 7 patients), perilesion (Bielschowsky: 1.3 ± 0.8, NF200: 8.3 ± 4.9; n = 6), control white matter (Bielschowsky: 0.1 ± 0.1, NF200: 0.7 ± 0.5; n = 9). Data represent mean ± SEM; NMO lesions versus control **P = 0.004 (left), ***P = 0.0002 (right); Kruskal–Wallis test followed by Dunn’s multiple comparisons test. (C) Representative ‘pearls-on-string’ axonal beading (red arrowheads) morphology in a Bielschowsky silver impregnation of an early NMO lesion (left). Very few beadings were observed in perilesional white matter (right). Scale bar = 20 µm. (D) In vivo two-photon time-lapse imaging showing development of axonal beadings (white arrowheads) and intracellular calcium rise (orange arrowheads) at the indicated times (minutes) after AQP4-Ig/complement application. Axons remain unaffected in control experiments (Ctrl-IgG/complement). Calcium levels pseudo-colour coded as indicated; scale bar = 20 µm. (E) Increase of beaded (grey) and high-calcium-containing axons (orange) in Thy1:TNXXL mice over 6 h after experimental NMO lesion induction. The majority of labelled axons showed beading (NMO left: AQP4-IgG: 73.0 ± 3.7%, n = 5 mice; rAQP4-IgG: 74.3 ± 2.4%, n = 4; versus control right: Ctrl-IgG: 3.4 ± 1.7%, n = 4; rCtrl-IgG 2.5 ± 2.5%, n = 3), Mann–Whitney test, *P (AQP4-IgG versus Ctrl-IgG) = 0.015, in some followed by calcium rise (threshold: dCitrine/CFP ≥ 1.5; NMO left, red graph: AQP4-IgG: 19.6 ± 3.9%; rAQP4-IgG: 19.4 ± 3.1% versus control Ctrl-IgG: 0.5 ± 0.5%; rCtrl-IgG 0 ± 0%). Data represent mean ± SEM. n > 200 axons were analysed for each condition. (F) Population and (G) individual axon data (ordered by time of beading onset) showing the relative time course of beading (grey) and calcium elevation (orange) in the subset of axons that lost calcium homeostasis. While on average, the calcium rise was delayed by 136 ± 9 min [t50%(beading) − t50%(calcium rise); mean ± SEM], on an axon-to-axon level, there was no consistent temporal relationship between the time of beading and of calcium rise. n = 50 high-calcium axons from five experiments.
Figure 2
Figure 2
Astrocyte depletion leads to persistent axonal beading in experimental NMO lesions. (A) Representative overview confocal images of spinal cord whole mounts of Aldh1l1:GFP × Thy1:OFP3 mice. In control tissue (top), astrocytes (Aldh1l1:GFP, magenta) remained mostly unaffected 24 h after superfusion with rCtrl-IgG/complement (90 min) with only a small number of axons showing swellings (Thy1:OFP3, grey), possibly due to surgery. In experimental NMO lesions 24 h after superfusion with rAQP4-IgG/complement (for 90 min; bottom), astrocyte loss and axonal beadings (arrowheads) were apparent. Note patchy astrocyte loss probably due to the non-homogenous distribution of rAQP4-IgG/complement in subdural space; only substantially astrocyte-depleted areas were included in analysis. (B) Astrocyte density within analysed areas of chronic lesions and control-treated spinal tissue (rCtrl-IgG: 920 ± 57 versus rAQP4-IgG: 40 ± 24 mm−2, n = 5 mice each). (C) Density of beaded axons in experimental NMO lesions versus control-treated spinal tissue (rCtrl-IgG: 453 ± 63 versus rAQP4-IgG: 1227 ± 222 mm−2, n = 5 mice each). Only astrocyte-depleted regions were included in the analysis for the rAQP4-IgG group. Dashed lines indicate the average density of astrocytes (B) and swollen axons (C) quantified in mice without any surgical interventions (n = 3 mice). Schematic representation of spinal cord (grey) with surgery (purple arrowheads) and imaging (yellow box) areas is shown in A. Boxed areas are magnified on the right. n ≥ 48 axons were analysed per animal. Data are represented as mean ± SEM. Mann–Whitney test; **P = 0.0079 in B; *P = 0.0159 in C. Scale bars = 40 µm.
Figure 3
Figure 3
Electron microscopy analysis of axonal pathology in experimental NMO lesions. (A) Histograms of axon calibre distribution of the axon population imaged in vivo in Thy1:TNXXL mice (>250 axons from n = 5 mice, binning 0.2 µm). Overall population (left) and split into swollen/non-swollen (right) after 6 h of AQP4-IgG/complement application. Pie charts: thin axons were more likely to swell (<1.5 µm: 93 ± 1.7% versus >1.5 µm: 9.1 ± 3.2%; n = 5 mice). Dotted dashed lines in right diagrams represents mean of initial diameter in swollen and non-swollen axon populations. Data represent mean ± SEM. Mann–Whitney test, ****P < 0.0001. (B and C) Volume EM analysis by tape-based scanning EM of mouse spinal lesions 6 h after NMO induction (resolution: 20 × 20 × 200 nm3). (B) Cross-section image of dorsal spinal column. Boxed area: xy position of the 3D data series used in C. Scale bar = 20 µm. Higher magnification images of experimental NMO lesion (C, left) shows oedema, glial cell loss and axonal injury. In control tissue (right), tightly packed axons and glial cells (magenta) were visible without signs of oedema or cell loss. Boxes: Axons analysed in D and E. Scale bar = 5 µm. (D and E) 3D surface rendering of myelinated (D; axon: blue, myelin: grey) and unmyelinated axons (E; green). Representative cross-sections of non-swollen (1) and swollen (2) axon segments in experimental NMO lesion (left) and of non-swollen axons with comparable diameters (3, 4) in control conditions (right). Scale bar = 1 µm.
Figure 4
Figure 4
Axonal beadings show cytoskeletal disruptions, driven by ionic- and osmotic overload. (A) High-resolution transmission EM analysis of swollen axons in an experimental NMO lesion shows oedema and microtubule disorganization (red) within beadings (left, 1). Well-arranged, densely packed microtubules (red) are visible in neighbouring non-swollen axon areas (2) and in control tissue (right, 1). Scale bar = 200 nm. (B) Confocal image of Thy1:OFP3 spinal cord axons (green), stained with βIII-tubulin antibody (red) after 6 h application of AQP4-IgG or Ctrl-IgG/complement. Red arrowheads point to an axon bead containing disorganized microtubules. Scale bar = 5 µm. (C) Quantification of βIII-tubulin mean fluorescent intensity (MFI) normalized to OFP signal of Thy1:OFP3 axons in control tissue (median: 0.75, n = 137 axons) and experimental NMO lesions (median, outside: 0.69; inside: 0.32, n = 102 axons; n = 5 mice for each condition). Box-and-whisker plot: 10–90 percentile. Kruskal–Wallis test followed by Dunn’s multiple comparisons test using axons, ***P < 0.0001. (D) Percentage of swollen axons within 6 h of experimental NMO lesion induction was similar in SARM1-deficient KO versus heterozygous mice in Aldh1l1:GFP × Thy1:OFP3 background (SARM1−/−: 54.0 ± 3.1%; SARM−/+: 55.5 ± 2.7%; from n = 5 mice each), as well as to wild-type Thy1:OFP3 mice (cf. F). (E) Local application of hyperosmolar (200% of the initial osmolarity) mannitol solution delayed and diminished beading in NMO spinal lesions (mean ± SEM: 31.5 ± 10.4%, n = 5 Thy1:TNXXL mice). Percentage of swollen axons induced by AQP4-IgG/complement under normal osmotic conditions from Fig. 1 replotted for comparison (73.0 ± 3.7%, n = 5). Mann–Whitney test, **P = 0.0079. (F) Local treatment with voltage-gated sodium channel blocker TTX (1 µM) reduced the number of swollen axons (mean ± SEM, TTX: 25.0 ± 3.2%; vehicle: 52.4 ± 2.4%; n = 6 Aldh1l1:GFP × Thy1:OFP3 mice for each condition). Mann–Whitney test, **P = 0.0022. (G) Astrocyte depletion via application of the pro-apoptotic drug, HA-14 (left, astrocyte survival after 3 h, mean ± SEM: 29.2 ± 2.6%, n = 4) induced sensitivity of axons to develop beadings following a mild hypo-osmotic change (90% aCSF; right, at 190 min, mean ± SEM: 12.8 ± 2.4%, n = 3; control DMSO: 2.2 ± 0.2%, n = 3; Mann–Whitney test, P = 0.1). (H) Quantification of βIII-tubulin in spinal tissue following the local treatment with microtubule destabilizing drug Nocodazole. Scale bar 10 µm. βIII-tubulin MFI normalized to OFP signal of Thy1:OFP3 axons in control (DMSO, median: 0.18, n = 100 axons, n = 2 mice) and Nocodazole treated mice (Noco, median: 0.04, n = 99 axons, n = 2 mice). Box-and-whisker plot: min to max. Mann–Whitney test, ****P < 0.0001 (middle). Microtubule destabilization induced axonal beadings under hypo-osmolar condition (right, at 190 min; Noco: 11.9 ± 3.0%, n = 5; DMSO 2.2 ± 0.2%, n = 3; Mann–Whitney test, *P = 0.0179).
Figure 5
Figure 5
Microtubule stabilization protects axons from beading. (A) In vivo two-photon imaging of Aldh1l1:GFP × Thy1:OFP mice spinal cord axons within 6 h of experimental NMO lesion induction with local epoB (5 µg/ml) or vehicle application. Red arrowheads indicate axonal beading, which is diminished with epoB treatment. Scale bar = 20 µm. (B) Unchanged depletion of spinal cord astrocytes following local epoB or vehicle treatment (survival after 3 h, epoB: 2.3 ± 1.3% versus vehicle: 1.2 ± 0.6%; n = 6 mice each). (C) Quantification of axonal beading after 6 h local epoB treatment (epoB: 19.9 ± 3.1%; vehicle: 50.9 ± 3.8%, n = 6 mice each). Mann–Whitney test, P < 0.01. (D) The fraction of beaded axons was reduced following systemic administration of epoB 24 h before lesion induction (after 6 h: 19.2 ± 3.4% versus vehicle: 61.6 ± 2.5%, n = 5, 4 mice, respectively) Mann–Whitney test; P < 0.05. (E) Quantification of βIII-tubulin staining mean fluorescent intensity (MFI) normalized to OFP signal in Thy1:OFP mice. Local epoB treatment preserved tubulin staining compared to vehicle (median, vehicle: 0.17 versus epoB: 0.52, n = 188, 65 axons respectively in five mice each). Mann–Whitney test; ****P < 0.0001. Box-and-whisker plot: 10–90 percentile. Data represent mean ± SEM in BD.

Comment in

References

    1. Wingerchuk DM, Banwell B, Bennett JL, et al. International consensus diagnostic criteria for neuromyelitis optica spectrum disorders. Neurology. 2015;85:177–189. - PMC - PubMed
    1. Fujihara K. Neuromyelitis optica spectrum disorders: still evolving and broadening. Curr Opin Neurol. 2019;32:385–394. - PMC - PubMed
    1. Lennon VA, Wingerchuk DM, Kryzer TJ, et al. A serum autoantibody marker of neuromyelitis optica: Distinction from multiple sclerosis. Lancet. 2004;364:2106–2112. - PubMed
    1. Lennon VA, Kryzer TJ, Pittock SJ, Verkman AS, Hinson SR. IgG marker of optic-spinal multiple sclerosis binds to the aquaporin-4 water channel. J Exp Med. 2005;202:473–477. - PMC - PubMed
    1. Hinson SR, Romero MF, Popescu BF, et al. Molecular outcomes of neuromyelitis optica (NMO)-IgG binding to aquaporin-4 in astrocytes. Proc Natl Acad Sci USA. 2012;109:1245–1250. - PMC - PubMed

Publication types