

Lipid levels and the risk of dementia: A dose-response meta-analysis of prospective cohort studies
- PMID: 35202496
- PMCID: PMC8935316
- DOI: 10.1002/acn3.51516
Lipid levels and the risk of dementia: A dose-response meta-analysis of prospective cohort studies
Abstract
Objectives: We performed a dose-response meta-analysis to estimate the association between lipid profiles with the risk of dementia and the potential differences according to the subtype of dementia based on prospective studies.
Methods: We searched PubMed, Embase and Web of Science for relevant articles and performed a meta-analysis. We applied fixed or random-effects models to calculate pooled relative risk (RR) with their 95% confidence intervals (CI). The dose-response relationship was assessed by restricted cubic spline.
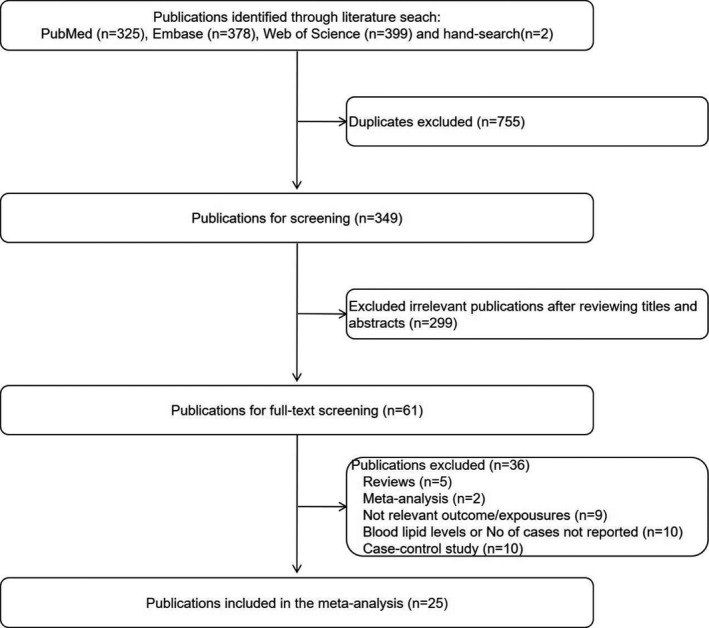
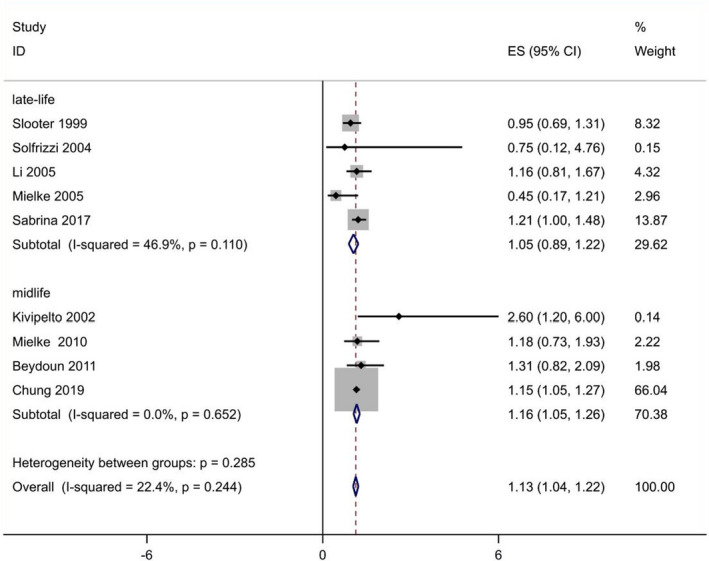
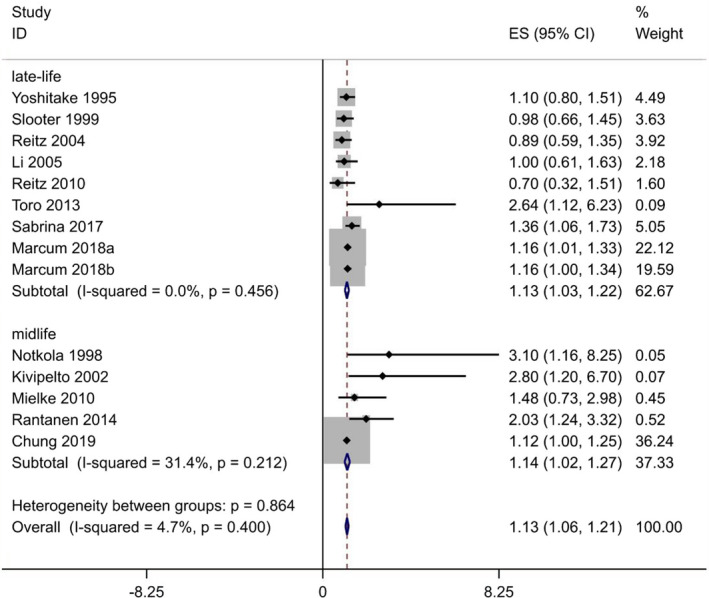
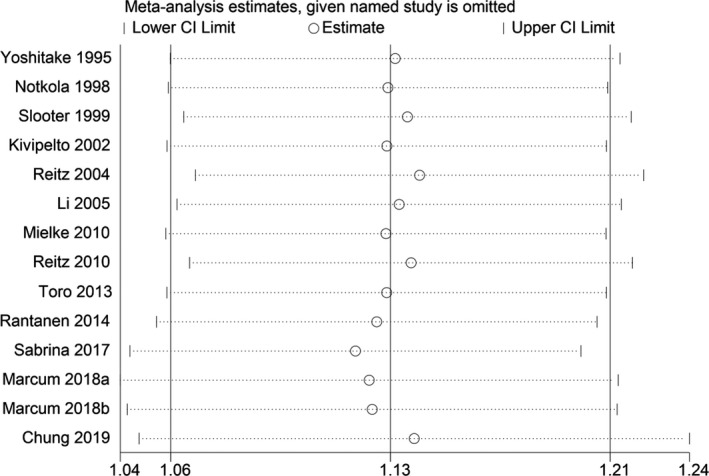
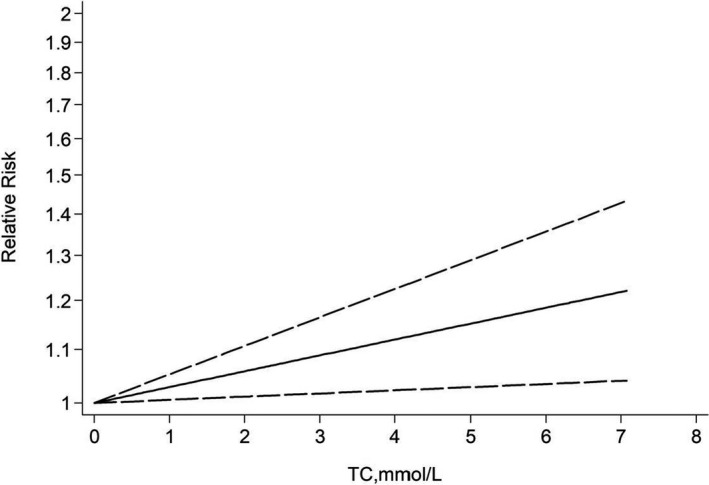
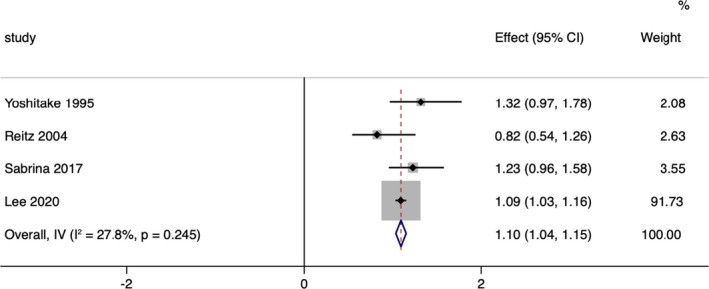
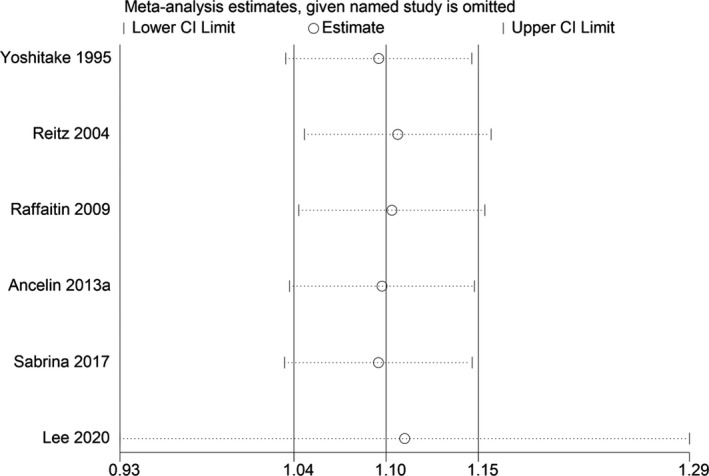
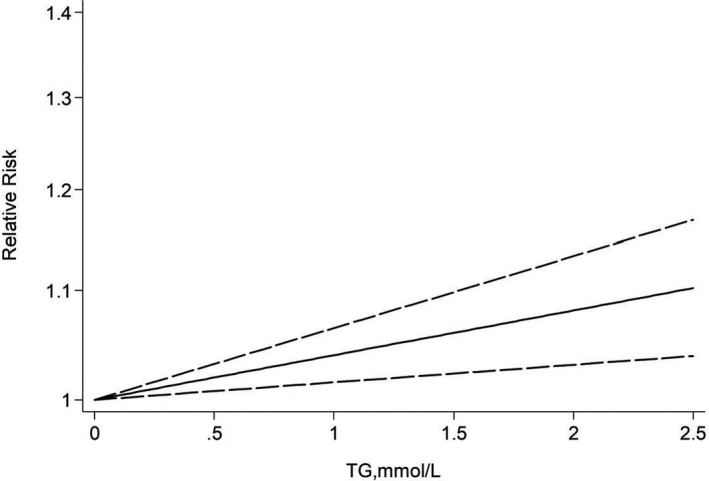
Results: Twenty-five prospective studies comprising 362,443 participants and 20,121 cases were included in the final analysis. We found that increased risk of all-cause dementia could be predicted by elevated total cholesterol (TC) (RR = 1.13, 95% CI 1.04-1.22). When looking at dementia subtypes, we also observed high TC and triglycerides (TG) may increase the future risk of Alzheimer's disease (AD), with a pooled RR of 1.13 (95% CI: 1.06-1.21) and 1.10 (95% CI: 1.04-1.15) respectively. Moreover, a dose-response analysis revealed a linear association between TC or TG and the risk of AD, with a pooled RR of 1.09 (95% CI: 1.02-1.16) and 1.12 (95% CI: 1.05-1.21) for per 3-mmol/L increment in TC and TG, respectively.
Conclusions: Current evidence suggest that every 3-mmol/L increase in blood TC or TG is linearly associated with a 9% or 12% increase in RR of AD, supporting the notion that high TC and TG levels appear to play a causal role in the development of AD.
© 2022 The Authors. Annals of Clinical and Translational Neurology published by Wiley Periodicals LLC on behalf of American Neurological Association.
Conflict of interest statement
The authors declare no conflict of interest.
Figures
Similar articles
-
Hyperhomocysteinemia and risk of incident cognitive outcomes: An updated dose-response meta-analysis of prospective cohort studies.Ageing Res Rev. 2019 May;51:55-66. doi: 10.1016/j.arr.2019.02.006. Epub 2019 Feb 28. Ageing Res Rev. 2019. PMID: 30826501 Review.
-
Smoking is associated with an increased risk of dementia: a meta-analysis of prospective cohort studies with investigation of potential effect modifiers.PLoS One. 2015 Mar 12;10(3):e0118333. doi: 10.1371/journal.pone.0118333. eCollection 2015. PLoS One. 2015. PMID: 25763939 Free PMC article. Review.
-
Dietary Fat Intake and Risk of Alzheimer's Disease and Dementia: A Meta-Analysis of Cohort Studies.Curr Alzheimer Res. 2018;15(9):869-876. doi: 10.2174/1567205015666180427142350. Curr Alzheimer Res. 2018. PMID: 29701155
-
Effects of α-linolenic acid intake on blood lipid profiles:a systematic review and meta-analysis of randomized controlled trials.Crit Rev Food Sci Nutr. 2021;61(17):2894-2910. doi: 10.1080/10408398.2020.1790496. Epub 2020 Jul 9. Crit Rev Food Sci Nutr. 2021. PMID: 32643951
-
Coffee Consumption and Risk of Dementia and Alzheimer's Disease: A Dose-Response Meta-Analysis of Prospective Studies.Nutrients. 2018 Oct 14;10(10):1501. doi: 10.3390/nu10101501. Nutrients. 2018. PMID: 30322179 Free PMC article. Review.
Cited by
-
Blood RNA transcripts show changes in inflammation and lipid metabolism in Alzheimer's disease and mitochondrial function in mild cognitive impairment.J Alzheimers Dis Rep. 2024 Dec 23;8(1):1690-1703. doi: 10.1177/25424823241307878. eCollection 2024. J Alzheimers Dis Rep. 2024. PMID: 40034360 Free PMC article.
-
Association between Subjective Cognitive Complaints and Sleep Disturbance among Community-Dwelling Elderly Individuals in Japan.Healthcare (Basel). 2024 Jun 22;12(13):1245. doi: 10.3390/healthcare12131245. Healthcare (Basel). 2024. PMID: 38998780 Free PMC article.
-
Primary care biomarkers and dementia in people of the Torres Strait, Australia: extended data analysis.Front Dement. 2023 Jul 31;2:1218709. doi: 10.3389/frdem.2023.1218709. eCollection 2023. Front Dement. 2023. PMID: 39081976 Free PMC article.
-
Systematic evaluation of multifactorial causal associations for Alzheimer's disease and an interactive platform MRAD developed based on Mendelian randomization analysis.Elife. 2024 Oct 11;13:RP96224. doi: 10.7554/eLife.96224. Elife. 2024. PMID: 39392298 Free PMC article.
-
Elevated blood glucose levels are associated with the progression of brain hypometabolism, and HDL-C and APOE4 add to this association.medRxiv [Preprint]. 2024 Sep 23:2024.09.20.24314082. doi: 10.1101/2024.09.20.24314082. medRxiv. 2024. PMID: 39399037 Free PMC article. Preprint.
References
-
- Burns M, Duff K. Cholesterol in Alzheimer's disease and tauopathy. Ann N Y Acad Sci. 2002;977:367‐375. - PubMed
-
- Sparks DL, Liu H, Scheff SW, Coyne CM, Hunsaker JC III. Temporal sequence of plaque formation in the cerebral cortex of non‐demented individuals. J Neuropathol Exp Neurol. 1993;52(2):135‐142. - PubMed
-
- Michikawa M. Cholesterol paradox: is high total or low HDL cholesterol level a risk for Alzheimer's disease? J Neurosci Res. 2003;72:141‐146. - PubMed
Publication types
MeSH terms
Substances
LinkOut - more resources
Full Text Sources
Medical
Miscellaneous
