Review
. 2022 Jun 7;28(32):e202104191.
doi: 10.1002/chem.202104191. Epub 2022 Apr 12.

From Light to Structure: Photo Initiators for Radical Two-Photon Polymerization

Affiliations
Review

From Light to Structure: Photo Initiators for Radical Two-Photon Polymerization

Thomas Wloka et al. Chemistry. .

Abstract

Two-photon polymerization (2PP) represents a powerful technique for the fabrication of precise three-dimensional structures on a micro- and nanometer scale for various applications. While many review articles are focusing on the used polymeric materials and their application in 2PP, in this review the class of two-photon photo initiators (2PI) used for radical polymerization is discussed in detail. Because the demand for highly efficient 2PI has increased in the last decades, different approaches in designing new efficient 2PIs occurred. This review summarizes the 2PIs known in literature and discusses their absorption behavior under one- and two-photon absorption (2PA) conditions, their two-photon cross sections (σTPA ) as well as their efficiency under 2PP conditions. Here, the photo initiators are grouped depending on their chromophore system (D-π-A-π-D, D-π-D, etc.). Their polymerization efficiencies are evaluated by fabrication windows (FW) depending on different laser intensities and writing speeds.

Keywords: microfabrication; photo initiator; two-photon absorption; two-photon cross-section; two-photon polymerization.


Conflict of interest statement

The authors declare no conflict of interest.

Figures

Figure 1
Figure 1
Schematic representation of the structure of bis(diethylamino)benzophenone (BDAB).
Figure 2
Figure 2
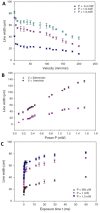
Line width investigations of BDAB in EBPADMA depending on (A) writing speed/velocity, (B) laser power and (C) laser exposure time. Adapted with permission from Ref. [36] © The Optical Society.
Figure 3
Figure 3
SEM image of fabricated PEG structure with 2 wt% BDAB. Reproduced with the permission of Ref. [37]. Copyright 2011, Elsevier.
Figure 4
Figure 4
SEM images of microhelices fabricated with a zirconium−silicon hybrid sol‐gel material and 1 wt% BDAB. Adapted with the permission of Ref. [42]. Copyright 2019, John Wiley and Sons.
Figure 5
Figure 5
Schematic representation of the structure of B3BP.
Figure 6
Figure 6
Schematic representation of the structures of the benzophenone derivatives.
Scheme 1
Scheme 1
Schematic representation of the aldol condensation of acetone and N,N‐dimethylaminobenzaldehyde with NaOH as base.
Figure 7
Figure 7
Schematic representation of the structure of benzylidene acetone derivatives with extended π‐systems.
Figure 8
Figure 8
UV spectrum of BA‐2 to BA‐5 in chloroform. Adapted with permission from Ref. [46]. Copyright 2006, Royal Society of Chemistry.
Figure 9
Figure 9
UV‐Spectra of BA‐6 and BA‐8 in chloroform. Adapted with permission from Ref. [46]. Copyright 2006, Royal Society of Chemistry.
Figure 10
Figure 10
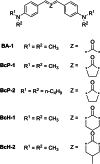
Schematic representation of the structure of various benzylidene photo initiators with different ring sizes.
Figure 11
Figure 11
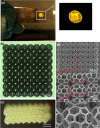
Fabricated scaffolds using BcH‐2. (a) Sample holder with the polymerized structure embedded in the resin. (b) Top view and (c) side view of the fabricated buckyball scaffold. (d) SEM images of the scaffold at serval magnifications. Republish with permission of Ref. [50]. Copyright 2020, IOP Publishing.
Figure 12
Figure 12
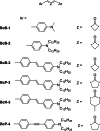
Schematic representation of the structure of 2PI with different ring sizes of the central ketone and various substituents reported by Nazir et al.
Figure 13
Figure 13
Fabrication windows of BcB‐1 to BcP‐4. The low‐power end shows polymerization thresholds, whereas the burning threshold is represented in the high‐power end of the scale (red). The green area represents the ideal laser intensities for the fabrication of stable structures. Adapted with permission of Ref. [33]. Copyright 2015, John Wiley and Sons.
Figure 14
Figure 14
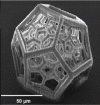
3D dice structures constructed applying different laser powers, with BcP‐4. Adapted with permission of Ref. [33]. Copyright 2015, John Wiley and Sons.
Figure 15
Figure 15
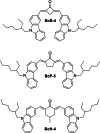
Schematic representation of the chemical structures of carbazole benzylidene derivatives.
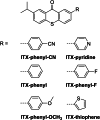
Figure 16
Figure 16
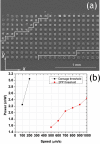
SEM micrograph of the Great Wall of China fabricated with BcP‐5. Adapted with permission of Ref. [53]. Copyright 2019, SPST.
Figure 17
Figure 17
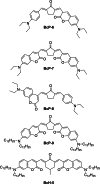
Schematic representation of the structures of the coumarin based benzylidene cycloketones.
Figure 18
Figure 18
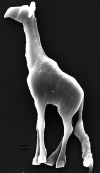
3D model structure of a giraffe fabricated with BcP‐6 at 163 μW laser power and 110 μm/s writing speed. Reproduced with permission from Ref. [60]. Copyright 2010, American Chemical Society.
Figure 19
Figure 19
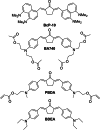
Schematic representation of the structures of BcP‐10, PBDA, BA740 and BDEA.
Figure 20
Figure 20
Structuring tests with BA740 (0.2 %) in LCM. Representative SEM micrograph (plant view of SchwarzP unit cells with 250 μm). The colored circles represent the obtained results in the heat map. Dark red: Bulk polymerization, loss of structure. Red: Bulk polymerization is sealing the pores. Yellow: Most precise 3D SchwarzP structure, best TPP writing conditions. Blue: Polymerized structures are not stable/load bearing. With x: Not a single trace of polymerization, no TPP writing possible. Reproduced with permission from Ref. [62]. Copyright 2017, John Wiley and Sons.
Figure 21
Figure 21
Gear structure fabricated with PBDA and PEG‐DA 400 as monomer. Reproduced with permission from Ref. [64]. Copyright 2019, Royal Society of Chemistry.
Figure 22
Figure 22
Schematic representation of the structures of alkinone based 2PIs.
Figure 23
Figure 23
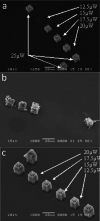
Fabrication tests with a) O−DPD, b) S−DPD and c) N−DPD at 0.025 wt%. Adapted with permission from Ref. [67]. Copyright 2007, John Wiley and Sons.
Figure 24
Figure 24
Dragonfly model fabricated by 2PP with B3 K as 2PI. Reproduced with permission from Ref. [45]. Copyright 2009, American Chemical Society.
Figure 25
Figure 25
Schematic representation of the chemical structures of AQ−N and AQ−O.
Figure 26
Figure 26
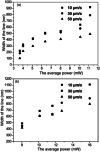
Line width dependence versus the average laser power for AQ−N (a) and AQ−O (b). Adapted with permission from Ref. [77]. Copyright 2007, Elsevier.
Figure 27
Figure 27
Schematic representation of the structure of B3AN and BB3AN.
Figure 28
Figure 28
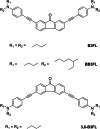
Schematic representation of the structures of the fluorenones B3Fl, BB3Fl and 3,6‐B3FL.
Figure 29
Figure 29
3D structures: (a) St. Stephen's Cathedral, (b) Tarantula Spider, (c) detail of the London Tower Bridge and (d) detailed view of the woodpile structure. Reproduced with permission from Ref. [43]. Copyright, John Wiley and Sons.
Figure 30
Figure 30
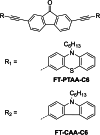
Schematic representation of the structures of carbazole and phenothiazine modified fluorenone 2PIs.
Figure 31
Figure 31
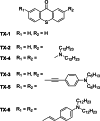
Schematic representation of the structures of the 2PIs TX‐1 to TX‐6 with a thioxanthone core.
Figure 32
Figure 32
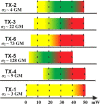
Fabrication windows of thioxanthone based 2PI TX‐1 to TX‐6. Yellow area: Polymerization threshold. Green area: Stable structuring. Red area: Burning threshold. Adapted with permission from Ref. [90]. Copyright 2015, American Chemical Society (https://pubs.acs.org/doi/10.1021/acs.macromol.5b00336).
Figure 33
Figure 33
(a) SEM recording showing an array of microstructures fabricated with TX‐2. (b) Hollow 3D microstructure with spikes on the surface using TX‐3 as initiator. Adapted with permission from Ref. [90]. Copyright 2015, American Chemical Society (https://pubs.acs.org/doi/10.1021/acs.macromol.5b00336).
Figure 34
Figure 34
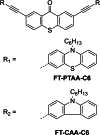
Schematic representation of the structures of carbazole and phenothiazine modified thioxanthone 2PIs.
Figure 35
Figure 35
Schematic representation of the structures of thioxanthone based photo initiators made for the investigation in STED‐DLW.
Figure 36
Figure 36
SEM image of photopolymerization with BDAPT and PETA as monomer. The highlighted box displays the area where polymerization was interrupted by the depletion laser. Adapted with permission from Ref. [94]. Copyright 2019, John Wiley and Sons.
Figure 37
Figure 37
Schematic representation of the structures of the D‐π‐A/D initiators based on ITX.
Figure 38
Figure 38
Bar chart of the (a) average two‐photon cross‐section at 800 nm and (b) average writing threshold of the 2PIs with a writing speed of 100 μm/s at 800 nm. Reproduced with permission from Ref. [95]. Copyright 2021, American Society of Chemistry.
Figure 39
Figure 39
Writing threshold of the ITX derivatives in comparison to ITX under the exposure of the inhibition laser at 638 nm at different laser powers. Reproduced with permission from Ref. [95]. Copyright 2021, American Society of Chemistry.
Figure 40
Figure 40
SEM image of fabricated lines using ITX−phenyl−OCH3 with the inhibition area, revealing no polymerization during the switched on inhibition laser at 638 nm. Adapted with permission from Ref. [95]. Copyright 2021, American Society of Chemistry.
Figure 41
Figure 41
Overview of the LPNCE process. (a) Sputter coating, (b) dropping photoresist, (c) fabrication of polymer via 2PP using PETA as monomer, (d) removing of the unpolymerized photoresist, (e) etching of the gold with KI3 surface and (f) dissolving of the polymer. Reproduced with permission from Ref. [97]. Copyright 2014, World Scientific Publishing Co. PTE. LTD.
Figure 42
Figure 42
SEM image of fabricated micro circle via LPNCE. (a) Circles with a radius of 5 μm and a line width of 1.2 μm. (b) Outerring radius and width of 10 μm and 0.9 μm, and inner ring, 5 μm and 0.9 μm, respectively. Reproduced with permission from Ref. [97]. Copyright 2014, World Scientific Publishing Co. PTE. LTD.
Figure 43
Figure 43
Schematic representation of the structure of the pyridinyl and pyridiniumyl based 2PIs.
Figure 44
Figure 44
Schematic representation of the structures of dipolar, quadrupolar and octopolar 2PIs BTrz, 2BTrz and 3BTrz.
Figure 45
Figure 45
SEM image of a complex 3D sphere fabricated with 2BTrz as 2PI. Adapted with permission from Ref. [102]. Copyright see http://creativecommons.org/licenses/by/4.0/.
Figure 46
Figure 46
Schematic representation of the structures of the thiophene based 2PIs.
Figure 47
Figure 47
SEM image of the speed power screening of BHA−1T. Classification by color: (green) excellent structures, (yellow) good structures with slightly contorted shapes, (red) structures with identifiable shapes but with small errors, (blue) not identifiable structures. Adapted with permission from Ref. [105]. Copyright see https://creativecommons.org/licenses/by‐nc/3.0/.
Figure 48
Figure 48
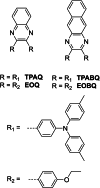
Schematic representation of the structures of quinoxaline and benzquioxaline based photo initiators.
Figure 49
Figure 49
SEM image of the fabricated lines using (a) TPAQ or (b) TPABQ as initiators. Adapted with permission from Ref. [109]. Copyright 2009, Royal Society of Chemistry.
Figure 50
Figure 50
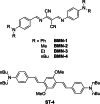
Schematic representation of the structures of the benzylidenediaminomaleonitrile based 2PIs.
Figure 51
Figure 51
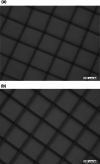
SEM image of fabricated microgrids with BMN‐3 at (a) 755 nm and (b) 820 nm. The scale bar is set to 10 μm. Adapted with permission from Ref. [111]. Copyright 2004, Royal Society of Chemistry.
Figure 52
Figure 52
Schematic representation of the structures of BSEA, 2PCK, G2CK and E2CK.
Figure 53
Figure 53
Fabricated woodpile structure fabricated using a writing speed of 110 μm/s, a laser power of 0.8 mW, BSEA as photo initiator and resin R1 in water. Adapted with permission from Ref. [112]. Copyright 2009, Elsevier.
Figure 54
Figure 54
Fabrication windows of the water‐soluble 2PIs P2CK, E2CK and G2CK. Adapted with permission from Ref. [115]. Copyright 2013, Royal Society of Chemistry.
Figure 55
Figure 55
Schematic representation of the structure of the 2PIs T1, BESA and T3.
Figure 56
Figure 56
Schematic representation of the structure of BTABcP‐1.
Figure 57
Figure 57
SEM image of a voxel array of PEtOx‐DA (DP 18) and BTABcP‐1 as initiator. The exposure time ranged from 40 to 400 ms (Δ=40 ms; right to left) and the laser power ranged from 10 to 410 mw (bottom to top, Δ=50 mW). Adapted with permission from Ref. [8]. Copyright 2021, Elsevier.
Figure 58
Figure 58
SEM images of the line arrays fabricated by 2PP using BTABcP‐1 and PEtOx‐DA. The side view shows the fabricated lines in an 60° angle and the black arrow marks the last alone standing line. Adapted with permission from Ref. [8]. Copyright 2021, Elsevier.
Figure 59
Figure 59
Schematic representation of the structure of the anthracene compound N.
Figure 60
Figure 60
SEM image of a fabricated woodpile microstructure with PEGda and the N/2‐Hp‐b‐CD complex WI as photo initiator. Adapted with permission from Ref. [121]. Copyright 2014, Royal Society of Chemistry.
Figure 61
Figure 61
SEM pictures of the fabricated 3D microstructures in form of an adenovirus. (a–c) Top view of the structures fabricated with 7.27 mW, 9.46 mW and 11.27 mW. (d) Side view of fabricated adenovirus structure at 8 mW. All structures were fabricated with a writing speed of 110 μm/s. Reproduced with permission from Ref. [124]. Copyright 2015, Royal Society of Chemistry.
Figure 62
Figure 62
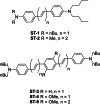
Schematic representation of the structures of the stilbene based 2PIs ST‐1 to ST‐5.
Figure 63
Figure 63
2PP fabricated cantilevers with one of the stilbene based 2PI. Adapted with permission from Ref. [9]. Copyright 1999, Springer Nature.
Figure 64
Figure 64
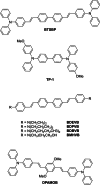
Schematic representation of the structures of 2PIs bearing triphenylamine moieties and biphenyl centers and the 2PA dye DPAMOB.
Figure 65
Figure 65
Micro‐grid fabricated with BDBVB as photo initiator. Reproduced with permission from Ref. [134]. Copyright 2009, Springer Nature.
Figure 66
Figure 66
Schematic representation of the structures of PVBB and DPVBB.
Figure 67
Figure 67
Schematic representation of the structures of the two‐branched (V‐Shape) and the three‐branched (Oct) 2PIs.
Figure 68
Figure 68
Schematic representation of the structures of the fluorenone based 2PIs F(PHT)2 , F(TPA)2 , FL‐1 and FL‐2.
Figure 69
Figure 69
Voxel array fabricated using FL‐2 as initiator with a laser power of 5 mW and an exposure time of 2 ms. Reproduced with permission from Ref. [145]. Copyright 2004, Korean Chemical Society.
Figure 70
Figure 70
Fabricated micro structure using FL‐2 (B) and its corresponding bit map image (A). Reproduced with permission from Ref. [145]. Copyright 2004, Korean Chemical Society.
Figure 71
Figure 71
Schematic representation of the structures of the triazole bridged fluorene 2PIs.
Figure 72
Figure 72
Two‐photon absorption spectra for the triazole containing fluorene 2PIs. Adapted with permission from Ref. [146]. Copyright 2020, John Wiley and Sons.
Figure 73
Figure 73
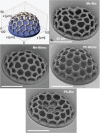
SEM images of complex 3D structures in form of a buckyball dome fabricated with the triazole containing fluorine based 2PIs. Adapted with permission from Ref. [146]. Copyright 2020, John Wiley and Sons.
Figure 74
Figure 74
Schematic representation of the structures of the anthracene based photo initiators AN‐1 to AN‐3 synthesized by Xing et al.
Figure 75
Figure 75
SEM pictures of fabricated line arrays using (a) AN‐1, (b) AN‐2, (c) AN‐3 and (d) Benzil. Reproduced with permission from Ref. [132]. Copyright 2012, Royal Society of Chemistry.
Figure 76
Figure 76
Schematic representation of the structure of WSPI.
Figure 77
Figure 77
Woodpile structures of PEGda with WSPI as photo initiator at a water content of 50 wt%. The laser power range was 10 to 300 mW (Δ=40 mW) and the writing speed was 1 to 10 mm/s (Δ=3 mm/s). This image was adapted with the permission of the publisher and the authors of Ref. [159]. Copyright 2012, SPIE.
Figure 78
Figure 78
Schematic representation of the structure of DAS.
Figure 79
Figure 79
Polymerization thresholds of DAS and P2CK at concentrations of 1 mM and 2 mM. Adapted with permission from Ref. [162]. Copyright 2018, Royal Society of Chemistry.
Figure 80
Figure 80
Schematic representation of the structures of V shaped photo initiators based on carbazole.
Figure 81
Figure 81
Plot of the fabricated fiber versus the exposure time for the resins R1 , R2 , R3 . The fabrication was performed at a laser power of 3.67 mW. Adapted with permission from Ref. [164]. Copyright 2011, Royal Society of Chemistry.
Figure 82
Figure 82
SEM image of a fly fabricated via 2PP using BMNBC as initiator. Adapted with permission from Ref. [164]. Copyright 2011, Royal Society of Chemistry.
Figure 83
Figure 83
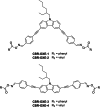
Schematic representation of the structures of carbazole based photo initiators CRB‐1 to CRB‐4.
Figure 84
Figure 84
UV‐Vis absorption spectra of CBR‐1 to CBR‐4 in CHCl3. Reproduced with permission from Ref. [165]. Copyright 2018, John Wiley and Sons.
Figure 85
Figure 85
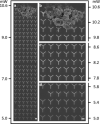
SEM image of the fabricated Y structures evaluating CBR‐4 as photo initiator, (a) full view of the structures along the laser power gradient and (b)–(d) enlargement of different segments of (a). Reproduced with permission from Ref. [165]. Copyright 2018, John Wiley and Sons.
Figure 86
Figure 86
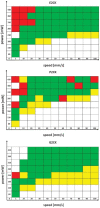
Display of the fabrication windows of the initiators CBR‐1 to CBR‐4. Adapted with permission from Ref. [165]. Copyright 2018, John Wiley and Sons.
Figure 87
Figure 87
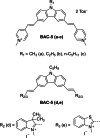
Schematic representation of the structures of BAC‐5(a–e).
Figure 88
Figure 88
Microgrid structure fabricated via 2PP using 0.1 wt% BAC‐5 c as 2PI. Reproduced with permission from Ref. [173]. Copyright 2007, Royal Society of Chemistry.
Figure 89
Figure 89
Schematic representation of the structure of the carbazole (CRB‐5 and CRB‐6) and phenothiazine (PHZ‐1 and PHZ‐2) based 2PIs.
Figure 90
Figure 90
Schematic representation of the oxime ester containing 2PIs with carbazole core.
Figure 91
Figure 91
(a) Fabrication window of the investigated carbazole 2PIs containing oxime ester moieties and (b) complex 3D‐structure fabricated with CBR−OXE‐4. Adapted with permission from Ref. [178]. Copyright 2020, John Wiley and Sons.
Figure 92
Figure 92
Schematic representation of the structures of the tri‐dentrical initiators TPA‐1 to TPA‐6.
Figure 93
Figure 93
Optical micrograph of the microgrid fabricated with SR349 and 2PI TPA‐4. Reproduced with permission from Ref. [181]. Copyright 2007, Royal Society of Chemistry.
Figure 94
Figure 94
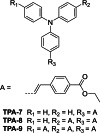
Schematic representation of the structures of the different branched initiators TPA‐7 to TPA‐9.
Figure 95
Figure 95
Fabrication windows of TPA‐7 to TPA‐9 at 50 μm/s writing speed. Reproduced with permission from Ref. [182]. Copyright 2017, Royal Society of Chemistry.
Figure 96
Figure 96
SEM images showing fabricated structures produced via 2PP (from left to right with the initiators TPA‐7 to TPA‐9). Reproduced with permission from Ref. [182]. Copyright 2017, Royal Society of Chemistry.
Figure 97
Figure 97
Schematic representation of the structures of BMVPC as the guest, and CB7 as the host.
Figure 98
Figure 98
(a) Top view of the SEM image of the hexagonal grid scaffold fabricated using the BMVPC/CB7 complex. (b) Tilted view in the hexagonal grid scaffold. (c) Confocal fluorescence image of the stained HeLa cells and (d) bright‐field image. Reproduced with permission from Ref. [187]. Copyright 2019, American Chemical Society.
Figure 99
Figure 99
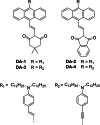
Schematic representation of the structures of the 1,3‐diketone based photo initiators DA‐1 to DA‐4.
Figure 100
Figure 100
Determination of the fabrication windows of DA‐1 to DA‐4 using 800 nm as polymerization wavelength. Adapted with permission from Ref. [61]. Copyright 2016, Royal Society of Chemistry.
Figure 101
Figure 101
(a) SEM image of the fabricated hollow pyramids with increasing laser power using DA‐3 as initiator. (b) Hollow pyramid fabricated at a laser power of 30 mW with DA‐3. Reproduced with permission from Ref. [61]. Copyright 2016, Royal Society of Chemistry.
Figure 102
Figure 102
Schematic representation of the structures of the silyl modified 2PIs DA‐5 to DA‐7.
Figure 103
Figure 103
Fabrication windows of the silylated 2PIs DA‐6/DA‐7 and DA‐5 (2PI concentration 6.3×10⁻⁶ mol 2PI/g resin). Adapted with permission from Ref. [193]. Copyright 2017, Royal Society of Chemistry.
Figure 104
Figure 104
Schematic representation of the structures of the 1,3,5‐triphenyl‐2‐pyrazoline 2PIs.
Figure 105
Figure 105
SEM image of the fabrication array prepared with PI−CF3 at a concentration of 1 wt% in PETA. Adapted with permission from Ref. [198]. Copyright 2021, Elsevier.
Figure 106
Figure 106
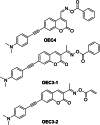
Schematic representation of the oxime esters substituted coumarin 2PIs.
Figure 107
Figure 107
(a) Fabrication window of the oxime ester substituted coumarin initiators. (b),(c) 3D complex structures fabricated using OEC‐2 as photo initiator. Adapted with permission from Ref. [200]. Copyright 2019, John Wiley and Sons.
Figure 108
Figure 108
Schematic representation of the structure of the carbazole based 2PI OXE with an oxime ester group.
Figure 109
Figure 109
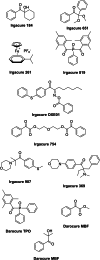
Schematic representation of the structures of the commercially available photo initiators investigated in the studies of Schafer et al.
Figure 110
Figure 110
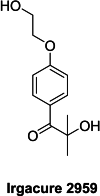
Schematic representation of the structure of Irgacure 2959.
Figure 111
Figure 111
Dynamic range of I2959 in different polyAAs and different PEGda monomers. PHEG−A13 (Df=12.9), PHEG−A9 (Df=9.4), PHEG−MA21 (Df=20.7), PHEG−MA11 (Df=11.2). Adapted with permission from Ref. [207]. Copyright 2014, Elsevier.
Figure 112
Figure 112
(a) SEM image of microneedle array fabricated with gentamicin‐doped SR610 (Sartomer, Paris France) and I369. (b) Fabricated microneedle array against Staphylococcus aureus. Growth inhibition area around the array was 26.8 mm large. Adapted with permission from Ref. [125]. Copyright 2010, John Wiley and Sons. (c) CAD design for the hydrogel scaffold structure. (d) SEM image of the scaffold fabricated by using I369 and PEGda. Adapted with permission from Ref. [208]. Copyright 2010, IOP Publishing.
Figure 113
Figure 113
(a) Hypodermic needle. Adapted with permission from Ref. [126]. Copyright 2007, John Wiley and Sons. (b) Micro grid structure fabricated by 2PP using I369 as 2PI. Adapted with permission from Ref. [128] ©The Optical Society.
Figure 114
Figure 114
SEM image of a three‐level cage structure fabricated with PETA/BisGMA (80/20) and I819 as 2PI. The square pore sizes are 35 μm. Adapted with permission from Ref. [214]. Copyright 2016, John Wiley and Sons.
Figure 115
Figure 115
SEM image of fabricated microstructures with I819 as 2PI. The laser intensity was increased from 16 to 32 mW in 4 mW steps (left to right). Adapted with permission from Ref. [216] ©The Optical Society.
Figure 116
Figure 116
Schematic representation of the structure of Irgacure TPO−L.
Figure 117
Figure 117
Linear absorption spectrum (left, curve, c=7×10⁻³ mol/L) and two‐photon absorption cross‐section spectrum (right, circles, c=9×10⁻¹ mol/L) of Irgacure TPO−L in ethanol. Reproduced with permission from Ref. [218]. Copyright 2008, Springer Nature.
Figure 118
Figure 118
Determined polymerization (circle) and damage (triangle) thresholds in dependence on the 2PI concentration. Every sample was irradiated with 725 nm laser wavelength for 5 s. Reproduced with permission from Ref. [218]. Copyright 2004, AIP Publishing.
Figure 119
Figure 119
(a)/(b) SEM image of the fabricated 3D micro structure “H A I R” on top of a human hair. The scale bars are 10 μm each. Reproduced with permission from Ref. [218]. Copyright 2004, AIP Publishing. (c)/(d) SEM images of a fabricated woodpile structure. Reproduced with permission from Ref. [220]. Copyright 2013, American Chemical Society.
Figure 120
Figure 120
(a) SEM image of the fabricated woodpile structures fabricated with Irgacure TPO−L. The laser intensities varied from 1.55 mW (left) to 3.5 mW (right) and the writing speed from 100 μm/s (bottom row) to 1000 μm/s (top‐left area) with 100 μm/s steps. (b) Plot of the processing parameters corresponding to the polymerization threshold (circles) and damage threshold (squares). Reproduced with permission from Ref. [220]. Copyright 2013, American Chemical Society.
Figure 121
Figure 121
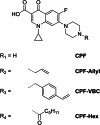
Schematic representation of the structures of modified CPF based photo initiators for 2PP.

Similar articles

Cited by

References

    1. Göppert-Mayer M., Ann. Phys. 1931, 401, 273–294.
    1. Kaiser W., Garrett C. G. B., Phys. Rev. Lett. 1961, 7, 229–231.
    1. Maruo S., Nakamura O., Kawata S., Opt. Lett. 1997, 22, 132–134. - PubMed
    1. Wollhofen R., Buchegger B., Eder C., Jacak J., Kreutzer J., Klar T. A., Opt. Mater. Express 2017, 7, 2538–2559.
    1. Claus T. K., Richter B., Hahn V., Welle A., Kayser S., Wegener M., Bastmeyer M., Delaittre G., Barner-Kowollik C., Angew. Chem. Int. Ed. 2016, 55, 3817–3822; - PubMed
    2. Angew. Chem. 2016, 128, 3882–3887.