. 2022 Mar 17;185(6):1041-1051.e6.
doi: 10.1016/j.cell.2022.01.029. Epub 2022 Feb 3.

T cell reactivity to the SARS-CoV-2 Omicron variant is preserved in most but not all individuals

Affiliations

T cell reactivity to the SARS-CoV-2 Omicron variant is preserved in most but not all individuals

Vivek Naranbhai et al. Cell. .

Erratum in

Abstract

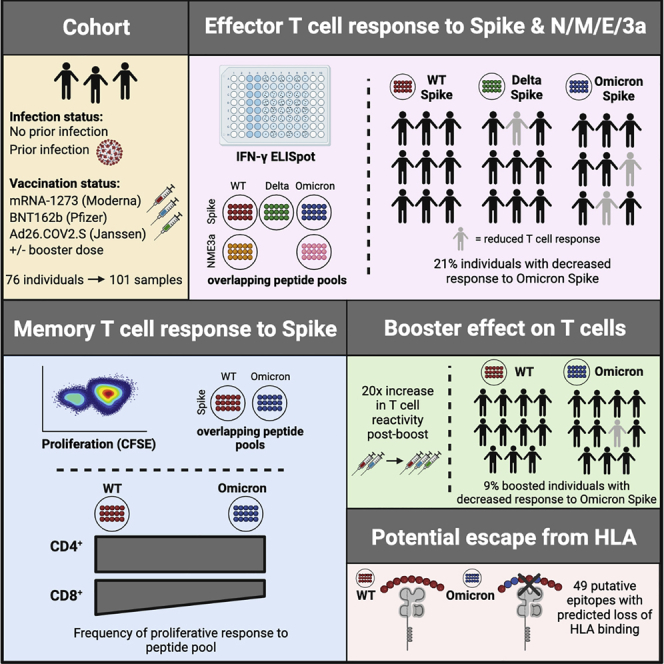
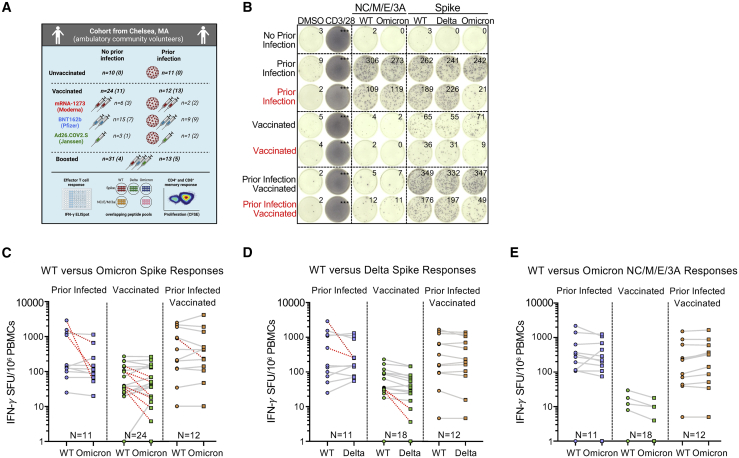
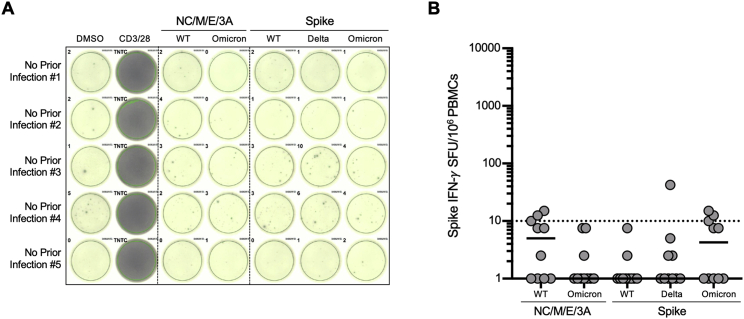
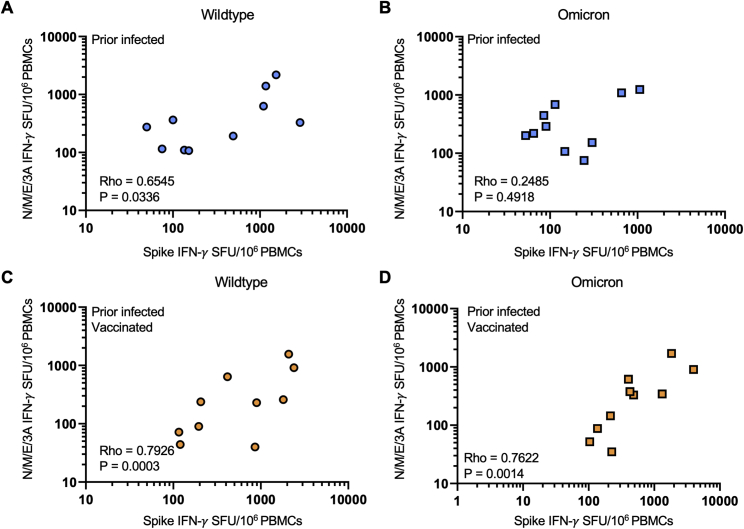
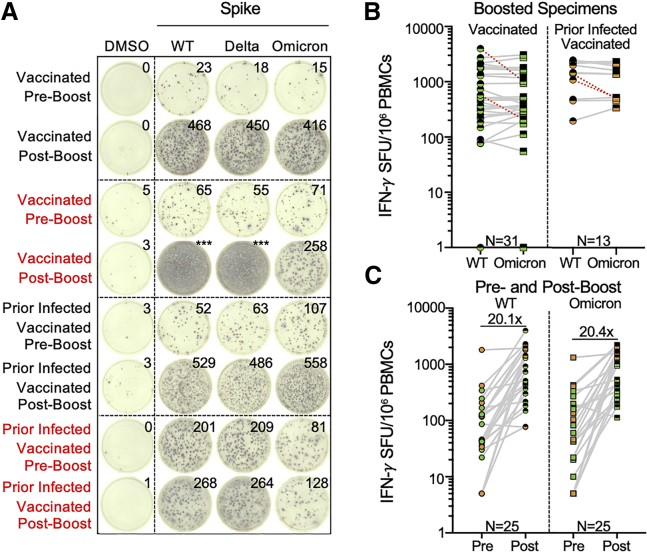
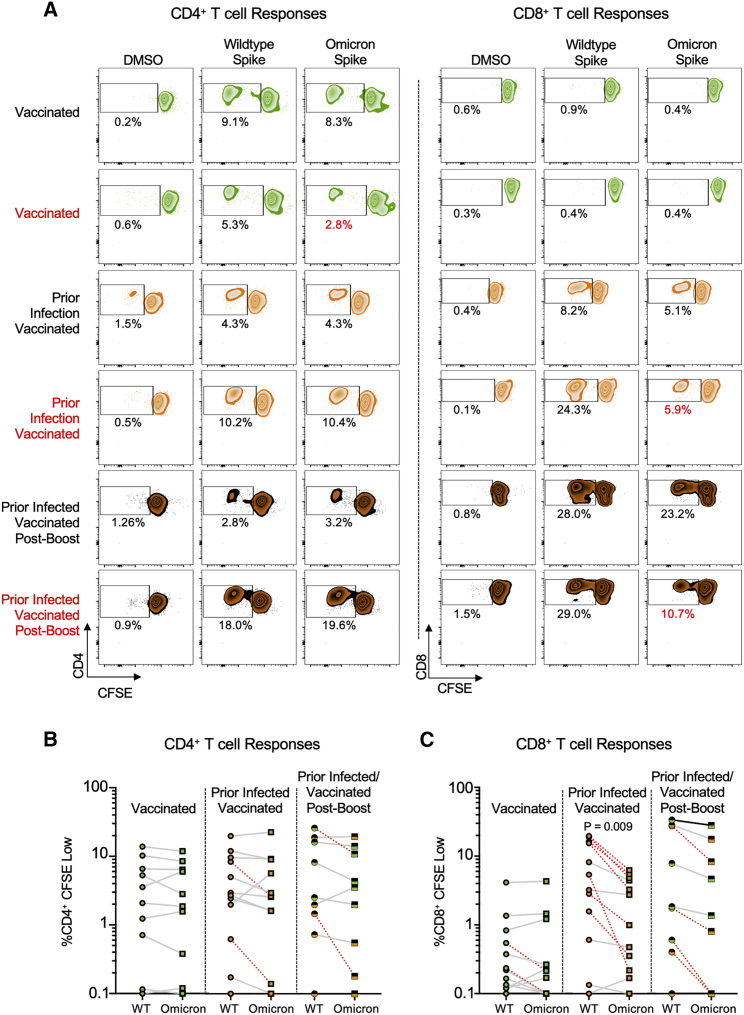
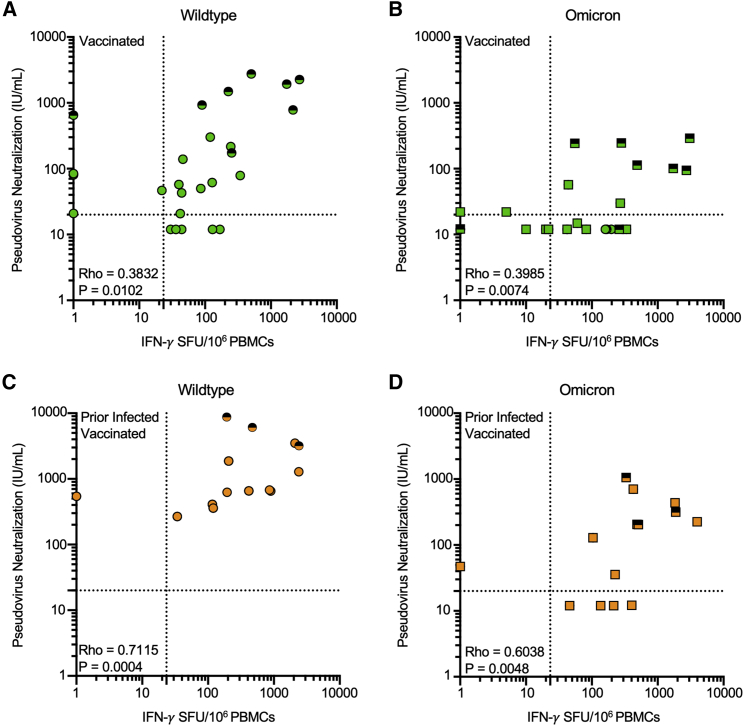
The SARS-CoV-2 Omicron variant (B.1.1.529) contains mutations that mediate escape from antibody responses, although the extent to which these substitutions in spike and non-spike proteins affect T cell recognition is unknown. In this study, we show that T cell responses in individuals with prior infection, vaccination, both prior infection and vaccination, and boosted vaccination are largely preserved to Omicron spike and non-spike proteins. However, we also identify a subset of individuals (∼21%) with a >50% reduction in T cell reactivity to the Omicron spike. Evaluation of functional CD4+ and CD8+ memory T cell responses confirmed these findings and revealed that reduced recognition to Omicron spike is primarily observed within the CD8+ T cell compartment potentially due to escape from HLA binding. Booster vaccination enhanced T cell responses to Omicron spike. In contrast to neutralizing immunity, these findings suggest preservation of T cell responses to the Omicron variant, although with reduced reactivity in some individuals.

Keywords: COVID-19; Delta; HLA; Omicron; SARS-CoV-2; T cell; epitopes; neutralization; vaccination; variants.


Conflict of interest statement

Declaration of interests G.D.G. has filed patent application PCT/US2021/028245.

Figures

None
Graphical abstract
Figure 1
Figure 1
Effector T cell reactivity to the SARS-CoV-2 Omicron variant is preserved in most but not all individuals with prior infection and/or primary series vaccination (A) Schematic of the study created with Biorender.com: participants were enrolled in Chelsea, Massachusetts and were stratified according to whether they had documented asymptomatic or symptomatic SARS-CoV-2 infection (ascertained by antinucleocapsid antibody testing) and vaccination status (see Table S1). In total, 101 PBMC samples from 76 individuals were studied. However, 25 individuals provided samples prior to and after receipt of additional booster vaccine doses. Total (CD4+ and CD8+) effector T cell reactivity to SARS-CoV-2 overlapping peptide pools from wild-type, Omicron, or Delta spike and from wild-type or Omicron nonspike structural and accessory proteins (nucleocapsid/membrane/envelope/ORF3A, i.e., NC/M/E/3A) was assessed by IFN-γ ELISpot (the number is shown for each group). CD4+ and CD8+ memory T cell response to wild-type or Omicron spike was assessed in a subset of participants by CFSE-based proliferation assay (see Figure 3). Numbers for each group are shown in parentheses. Table S2 describes the degree of overlap in peptide pools. (B) Representative IFN-γ ELISpot responses for study participants following no stimulation (dimethyl sulfoxide [DMSO] only), anti-CD3 and anti-CD28 stimulation (positive control), overlapping NC/M/E/3A peptide pools from wild-type SARS-CoV-2 and Omicron variant, and overlapping spike peptide pools from wild-type, Delta, and Omicron variant. Those delineated in red are representative examples of individuals with >50% decreased T cell responses to the Omicron spike peptide pool compared with wild type. The median magnitude of wild-type or Omicron spike responses among negative controls (individuals without prior infection or vaccination) was 0–5 SFU/106 cells (see Figure S1). (C) Comparative IFN-γ ELISpot spot forming units (SFUs) per 106 peripheral blood mononuclear cells (PBMCs) in individuals with prior infection, vaccination, and both prior infection and vaccination with overlapping wild-type and Omicron spike peptide pools. Overall T cell responses to wild type and Omicron were comparable across all groups by multivariate regression, although red dashed lines indicate the 10 participants with a >50% decrease (0.3log10) in reactivity. (D) Comparative IFN-γ ELISpot responses in individuals with prior infection, vaccination, and both prior infection and vaccination with overlapping wild-type and Delta spike peptide pools. Overall T cell responses to wild type and Delta were comparable across all groups, although red dashed lines indicate the 4 participants with a >50% decrease (0.3log10) in reactivity. (E) Comparative IFN-γ ELISpot responses in individuals with prior infection, initial vaccination series, and both prior infection and vaccination to overlapping peptide pools of the wild type and Omicron NC/M/E/3A. In (C–E), each dot is a single participant. Circles denote responses to wild-type peptides and squares to Omicron or Delta peptides. Dots are colored by prior infection and vaccine stratum (blue for prior infection and no vaccination, green for no prior infection and vaccination with primary series, and orange for both prior infection and vaccination with primary series). In (C–E), pair-wise comparison of effector T cell reactivity toward wild type versus variant by a paired t test (not adjusted for multiple comparisons or covariates) was not significant. See also Figures S1 and S2 and Tables S1–S4.
Figure S1
Figure S1
The magnitude of wild-type or Omicron effector T cell responses in negative individuals without prior infection or vaccination, related to Figure 1 (A) Representative IFN-γ ELISpot responses for five participants with no prior SARS-CoV-2 infection (by history and confirmed with negative antinucleocapsid antibody testing), following no stimulation (dimethyl sulfoxide [DMSO] only), anti-CD3 and anti-CD28 stimulation (positive control), overlapping NC/M/E/3A peptide pools from wild-type SARS-CoV-2 and Omicron variant, and overlapping spike peptide pools from wild-type, Delta and Omicron variant. (B) The magnitude of wild-type or omicron nucleocapsid, membrane, envelope, ORF3A (NC/M/3A), and spike in ten evaluated participants. For each peptide pool, the horizontal line denotes the median. The horizontal dotted line denotes a response of 10 SFU/106 PBMC.
Figure S2
Figure S2
Effector T cell responses to spike and nonspike structural proteins are correlated for wild type and Omicron among individuals with prior infection with or without vaccination, related to Figure 1 (A) Scatter plot of magnitude of effector T cell response (IFN-γ SFU per 106 PBMCs) directed against spike and nonspike structural and accessory proteins (nucleocapsid, membrane, envelope, and ORF3A) from wild-type SARS-CoV-2 in prior infected individuals. (B) Scatter plot of magnitude of effector T cell response (IFN-γ SFU per 106 PBMCs) directed against spike and nonspike structural and accessory proteins (nucleocapsid, membrane, envelope, and ORF3A) from the SARS-CoV-2 Omicron variant in prior infected individuals. (C) Scatter plot of magnitude of effector T cell response (IFN-γ SFU per 106 PBMCs) directed against spike and nonspike structural and accessory proteins (nucleocapsid, membrane, envelope, and ORF3A) from wild-type SARS-CoV-2 in prior infected and vaccinated individuals. (D) Scatter plot of magnitude of effector T cell response (IFN-γ SFU per 106 PBMCs) directed against spike and nonspike structural and accessory proteins (nucleocapsid, membrane, envelope, and ORF3A) from the SARS-CoV-2 Omicron variant in prior infected and vaccinated individuals. In (A–D), each dot is a single participant. Circles denote responses to wild-type peptides and squares to Omicron peptides. Dots are colored by prior infection and vaccine stratum (blue prior infection and no vaccination and orange for both prior infection and vaccination with primary series). Spearman correlation coefficients are denoted in each panel.
Figure 2
Figure 2
Effector T cell responses to SARS-CoV-2 wild type and Omicron are enhanced by additional booster vaccination (A) Representative IFN-γ ELISpot responses for study participants. Shown are IFN-γ ELISpot responses following no stimulation (dimethyl sulfoxide [DMSO] only), anti-CD3 and anti-CD28 stimulation (positive control), and overlapping spike protein peptide pools from wild-type and Omicron variant in individuals with no prior infection and vaccinated or with prior infection and vaccinated sampled prior to receipt of booster (preboost) or after booster (postboost) vaccine doses. Those delineated in red indicate representative examples of individuals with >50% decreased T cell responses to the Omicron spike peptide pool in comparison with wild type. (B) Comparative IFN-γ ELISpot responses in individuals with and without prior infection following booster vaccination (range 8–54 days following booster dose). Red dashed lines indicate the 4 participants with a >50% decrease (0.3log10) in T cell reactivity to Omicron relative to wild type. (C) Comparative T cell reactivity pre and postbooster vaccination (8–10 days following booster dose) in 25 participants to both wild-type and Omicron spike protein. Booster vaccination elicited an ∼20-fold increase in T cell response magnitude to both spike proteins. In (B and C), each dot is a single participant. Circles denote responses to wild-type peptides and squares to Omicron peptides. Dots are colored by prior infection and vaccine stratum (green for no prior infection and vaccination with primary series and orange for both prior infection and vaccination with primary series). Fill denotes sampling preboost (full filled) or postboost (half filled). In (B), pair-wise comparison of effector T cell reactivity toward wild type versus variant by a paired t test (not adjusted for multiple comparisons or covariates) was not significant. See also Figure 2 and Tables S3 and S4.
Figure S3
Figure S3
Gating strategy for CFSE proliferation assay, related to Figure 3 Representative gating strategy for identification of proliferating CD3+ CD4+ and CD3+ CD8+ CFSE low T cells in response to peptide pools of interest. The gate establishing the frequency of CFSE low CD4 + or CD8 + cells was chosen based on minimizing responses in two negative-control (DMSO) wells and verified using positive control (CD3/CD28) wells.
Figure 3
Figure 3
Proliferative spike-specific CD4+ T cell responses are preserved against Omicron, but CD8+ T cell responses are reduced (A) Representative CFSE responses for study participants. Shown are CD4+ (left) and CD8+ (right) T cell responses following no stimulation (dimethyl sulfoxide [DMSO] only) and overlapping spike protein peptide pools from wild-type and Omicron variant. Those delineated in red indicate representative examples of individuals with >50% decreased T cell responses to the Omicron spike peptide pool in comparison with wild type. (B) Comparative %CD4+ CFSE Low cells in individuals with vaccination, both prior infection and vaccination, and prior infection, initial vaccination, and booster vaccination in response to overlapping wild-type and Omicron spike peptide pools. Data are means of technical duplicates. Red dashed lines indicate the 4 individuals with a >50% decrease (0.3log10) in proliferative response. Pair-wise comparison of memory CD4+ T cell proliferation to wild-type versus Omicron spike by a paired t test (not adjusted for multiple comparisons or covariates) was not significant. (C) Comparative %CD8+ CFSE Low cells in individuals with vaccination, both prior infection and vaccination, and prior infection, initial vaccination, and booster vaccination in response to overlapping wild-type and Omicron spike peptide pools. Data are means of technical duplicates. Red dashed lines indicate the 13 individuals with a >50% decrease (0.3log10) in proliferative response. Pair-wise comparison of proliferative CD8+ T cell responses in previously infected, vaccinated individuals (p = 0.009) and across all study participants (p < 0.005) to wild-type versus Omicron spike by a paired t test (not adjusted for multiple comparisons or covariates) revealed a significant reduction in response to Omicron spike. See Figure S3 and Table S5.
Figure 4
Figure 4
Effector T cell responses to Omicron are present in individuals with undetectable neutralization of Omicron (A) Scatter plot of magnitude of effector T cell response (IFN-γ SFU per 106 PBMCs) and Pseudovirus neutralization (IU/mL) against wild-type SARS-CoV-2 in vaccinated individuals. (B) Scatter plot of magnitude of effector T cell response (IFN-γ SFU per 106 PBMCs) and Pseudovirus neutralization (IU/mL) against SARS-CoV-2 Omicron variant in vaccinated individuals. (C) Scatter plot of magnitude of effector T cell response (IFN-γ SFU per 106 PBMCs) and Pseudovirus neutralization (IU/mL) against wild-type SARS-CoV-2 in prior infected, vaccinated individuals. (D) Scatter plot of magnitude of effector T cell response (IFN-γ SFU per 106 PBMCs) and Pseudovirus neutralization (IU/mL) against SARS-CoV-2 Omicron variant in prior infected, vaccinated individuals. Serum neutralization of pseudotyped virus entry into ACE2-expressing 293T cells was previously reported in the same participants at the same time points (Garcia-Beltran et al., 2022). In (A–D), each dot is a single participant. Circles denote responses to wild-type peptides and squares to Omicron peptides. Dots are colored by prior infection and vaccine stratum (green for no prior infection and vaccination with primary series and orange for both prior infection and vaccination with primary series). Fill denotes sampling preboost (full filled) or postboost (half filled). Spearman correlation coefficients are denoted in each panel. Dotted lines denote a pseudoneutralization titer threshold of 20 (Garcia-Beltran et al., 2021c) and a T cell response threshold of 23.3 SFU/106 PBMC (the maximal response detected among unvaccinated individuals without prior infection).

Update of

Comment in

References

    1. Barlos K., Chatzi O., Gatos D., Stavropoulos G. 2-Chlorotrityl chloride resin: studies on anchoring of Fmoc-amino acids and peptide cleavage. Int. J. Pept. Protein Res. 1991;37:513–520. - PubMed
    1. Behrendt R., White P., Offer J. Advances in Fmoc solid-phase peptide synthesis. J. Pept. Sci. 2016;22:4–27. - PMC - PubMed
    1. Garcia-Beltran W.F., Denis K.J., Hoelzemer A., Lam E.C., Nitido A.D., Sheehan M.L., Berrios C., Ofoman O., Chang C.C., Hauser B.M., Feldman J. mRNA-based COVID-19 vaccine boosters induce neutralizing immunity against SARS-CoV-2 Omicron variant. Cell. 2022;185:457–466.e4. - PMC - PubMed
    1. Garcia-Beltran W.F., Lam E.C., St. Denis K., Nitido A.D., Garcia Z.H., Hauser B.M., Feldman J., Pavlovic M.N., Gregory D.J., Poznansky M.C., et al. Multiple SARS-CoV-2 variants escape neutralization by vaccine-induced humoral immunity. Cell. 2021;184:2523. - PMC - PubMed
    1. Garcia-Beltran W.F., St Denis K.J., Hoelzemer A., Lam E.C., Nitido A.D., Sheehan M.L., Berrios C., Ofoman O., Chang C.C., Hauser B.M., et al. mRNA-based COVID-19 vaccine boosters induce neutralizing immunity against SARS-CoV-2 Omicron variant. medRxiv. 2021 medRxiv:2021.12.14.21267755. - PMC - PubMed