. 2022 Jul:210:112890.
doi: 10.1016/j.envres.2022.112890. Epub 2022 Feb 22.

A multi-tissue study of immune gene expression profiling highlights the key role of the nasal epithelium in COVID-19 severity

Collaborators, Affiliations

A multi-tissue study of immune gene expression profiling highlights the key role of the nasal epithelium in COVID-19 severity

Alberto Gómez-Carballa et al. Environ Res. 2022 Jul.

Abstract

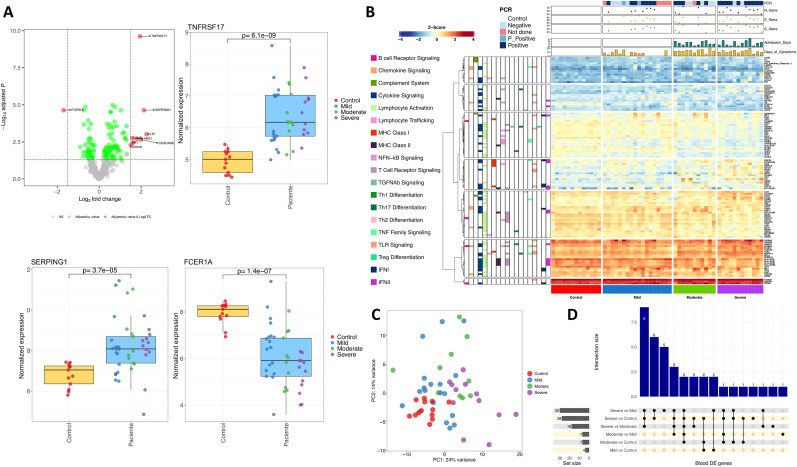
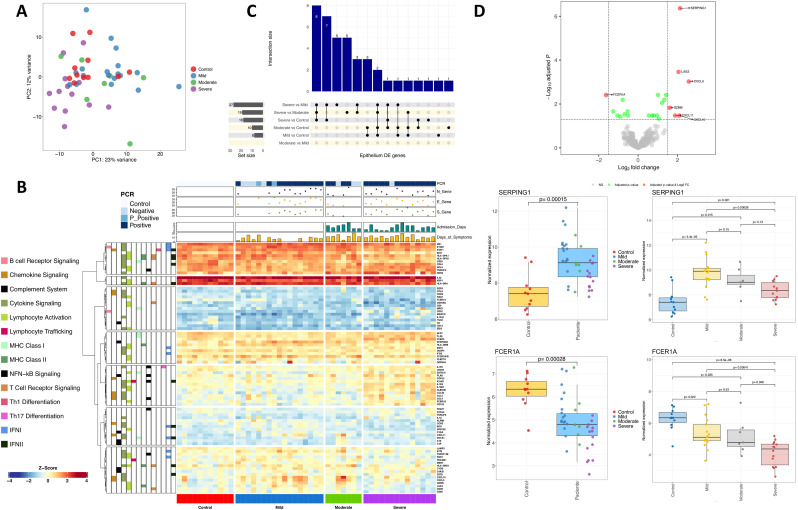
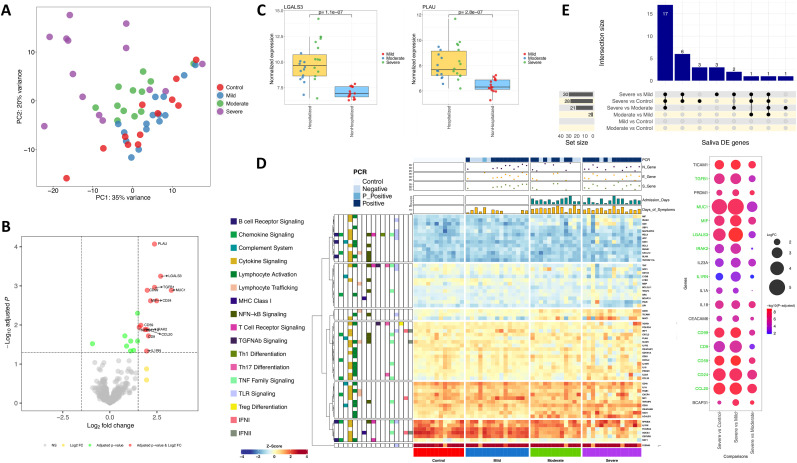
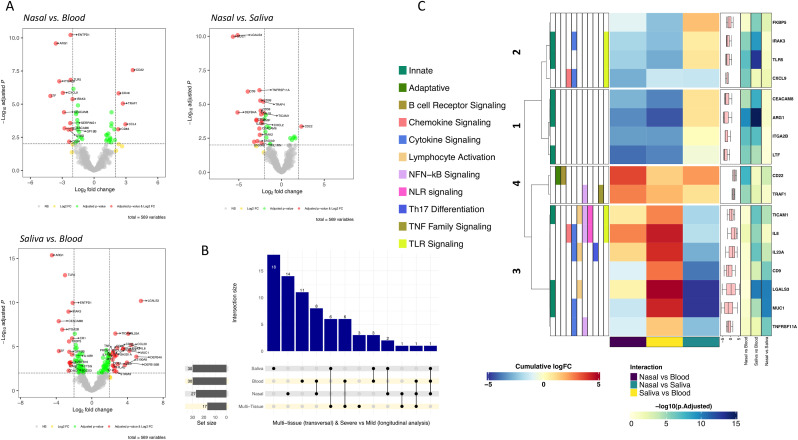
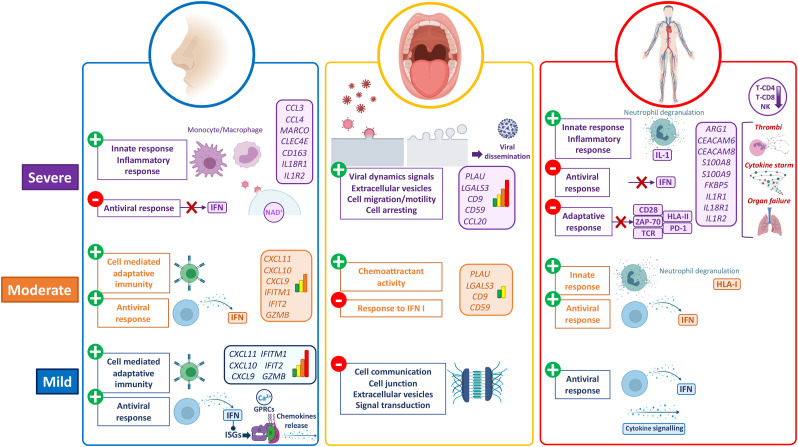
Coronavirus Disease-19 (COVID-19) symptoms range from mild to severe illness; the cause for this differential response to infection remains unknown. Unravelling the immune mechanisms acting at different levels of the colonization process might be key to understand these differences. We carried out a multi-tissue (nasal, buccal and blood; n = 156) gene expression analysis of immune-related genes from patients affected by different COVID-19 severities, and healthy controls through the nCounter technology. Mild and asymptomatic cases showed a powerful innate antiviral response in nasal epithelium, characterized by activation of interferon (IFN) pathway and downstream cascades, successfully controlling the infection at local level. In contrast, weak macrophage/monocyte driven innate antiviral response and lack of IFN signalling activity were present in severe cases. Consequently, oral mucosa from severe patients showed signals of viral activity, cell arresting and viral dissemination to the lower respiratory tract, which ultimately could explain the exacerbated innate immune response and impaired adaptative immune responses observed at systemic level. Results from saliva transcriptome suggest that the buccal cavity might play a key role in SARS-CoV-2 infection and dissemination in patients with worse prognosis. Co-expression network analysis adds further support to these findings, by detecting modules specifically correlated with severity involved in the abovementioned biological routes; this analysis also provides new candidate genes that might be tested as biomarkers in future studies. We also found tissue specific severity-related signatures mainly represented by genes involved in the innate immune system and cytokine/chemokine signalling. Local immune response could be key to determine the course of the systemic response and thus COVID-19 severity. Our findings provide a framework to investigate severity host gene biomarkers and pathways that might be relevant to diagnosis, prognosis, and therapy.

Keywords: COVID-19 severity; Co-expression analysis; Differential expression analysis; Gene expression; Immune response; Multi-tissue; Pathways analysis; SARS-CoV-2.


Conflict of interest statement

The authors declare that they have no known competing financial interests or personal relationships that could have appeared to influence the work reported in this paper.

Figures

Fig. 1
Fig. 1
A) Volcano plot showing the DEGs between cases and healthy controls in blood samples. Boxplots of the most relevant genes and the P-value of the statistical test are also shown. B) Heatmap and cluster analysis of the DEGs between all categories in blood samples. Only genes with a log2FC |>1| were represented. Gene clusters were generated using k-means partitioning. C) PCA of immune transcriptomic data from blood samples of the different COVID-19 categories analyzed using all genes from the panel detected above the background. D) Upsetplot of the common DEGs between categories compared in blood samples.
Fig. 2
Fig. 2
A) PCA of immune transcriptomic data from nasal epithelium samples of the different disease categories analyzed using all genes from the panel detected above the background. B) Heatmap and cluster analysis of the DEGs between all categories in nasal epithelium samples. Only genes with a log2FC |>1| were represented. Gene clusters were generated using k-means partitioning. C) Upsetplot of the common DEGs between categories compared in nasal epithelium samples. D) Volcano plot showing the DEGs between COVID-19 samples and healthy controls in nasal epithelium samples. Boxplots of the most relevant genes and the P-value of the statistical test are also shown.
Fig. 3
Fig. 3
A) PCA of immune transcriptomic data from saliva samples of the different disease categories analyzed using all genes from the panel detected above the background. B) Volcano plot showing the DEGs between hospitalized and non-hospitalized saliva samples. C) Boxplots of the most relevant genes from the comparison of hospitalized vs. non-hospitalized saliva samples and the P-value of the statistical test. D) Heatmap and cluster analysis of the DEGs between all categories in saliva samples. Only genes with a log2FC |>1| were represented. Gene clusters were generated using k-means partitioning. E) Upsetplot of the common DEGs between categories compared in saliva samples. Bubble plot represents log2FC and adjusted P-value from the 18 DEGs between severe and all remaining categories. Green color in gene names indicates genes also included in the hospitalized signature. (For interpretation of the references to color in this figure legend, the reader is referred to the Web version of this article.)
Fig. 4
Fig. 4
A) Volcano plots showing the DEGs between severities (severe/mild) and different tissue samples (thresholds: P-adjusted = 0.01, cumulative log2FC = |2|). B) Upsetplot of the DEGs between severe and mild categories in all tissues as well as in the multi-tissue transversal analysis. C) Heatmap and cluster analysis of the DEGs between severities (severe/mild) and different tissue samples (thresholds: P-adjusted = 10E-6, cumulative log2FC = |2.5|). Gene clusters were generated using k-means partitioning.
Fig. 5
Fig. 5
Schematic representation of the main findings in gene expression and pathway analysis of COVID-19 severity in nasal, oral and blood tissues. The figure was built with Biorender (https://biorender.com/) resources.

References

    1. Alfi O., Yakirevitch A., Wald O., Wandel O., Izhar U., Oiknine-Djian E., Nevo Y., Elgavish S., Dagan E., Madgar O., et al. Human nasal and lung tissues infected ex vivo with SARS-CoV-2 provide insights into differential tissue-specific and virus-specific innate immune responses in the upper and lower respiratory tract. J. Virol. 2021 - PMC - PubMed
    1. Althouse B.M., Wenger E.A., Miller J.C., Scarpino S.V., Allard A., Hebert-Dufresne L., Hu H. Superspreading events in the transmission dynamics of SARS-CoV-2: opportunities for interventions and control. PLoS Biol. 2020;18 - PMC - PubMed
    1. Aschenbrenner A.C., Mouktaroudi M., Krämer B., Oestreich M., Antonakos N., Nuesch-Germano M., Gkizeli K., Bonaguro L., Reusch N., Baßler K., et al. Disease severity-specific neutrophil signatures in blood transcriptomes stratify COVID-19 patients. Genome Med. 2021;13:7. - PMC - PubMed
    1. Barral-Arca R., Pardo-Seco J., Bello X., Martinón-Torres F., Salas A. Ancestry patterns inferred from massive RNA-seq data. RNA. 2019;25:857–868. - PMC - PubMed
    1. Barral-Arca R., Pardo-Seco J., Martinón-Torres F., Salas A. A 2-transcript host cell signature distinguishes viral from bacterial diarrhea and it is influenced by the severity of symptoms. Sci. Rep. 2018;8:8043. - PMC - PubMed

Publication types