. 2022 Apr;298(4):101763.
doi: 10.1016/j.jbc.2022.101763. Epub 2022 Feb 21.

Development of high-affinity nanobodies specific for NaV1.4 and NaV1.5 voltage-gated sodium channel isoforms

Affiliations

Development of high-affinity nanobodies specific for NaV1.4 and NaV1.5 voltage-gated sodium channel isoforms

Lakshmi Srinivasan et al. J Biol Chem. 2022 Apr.

Abstract

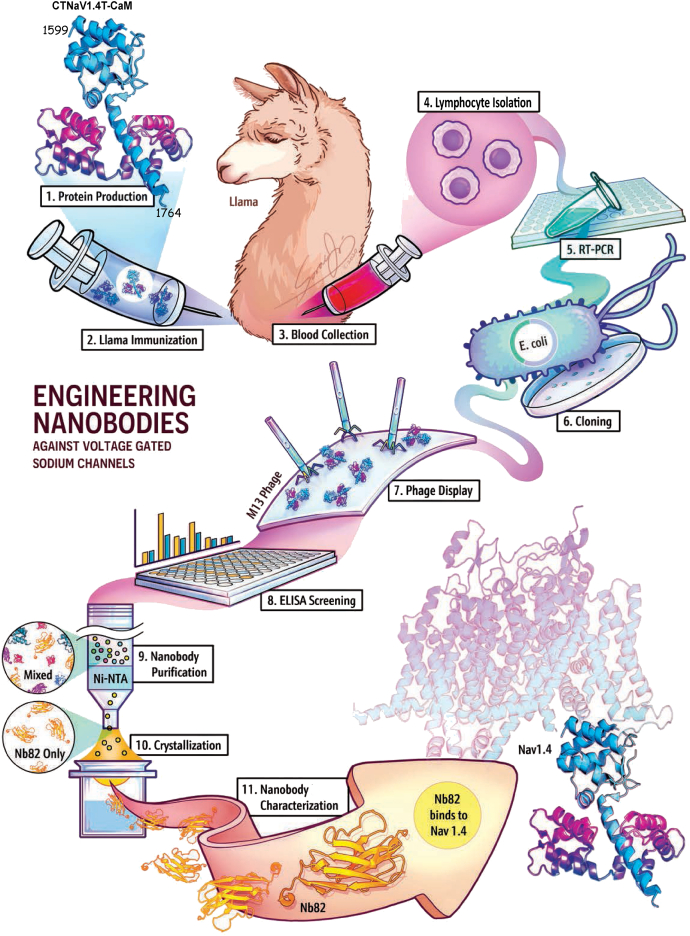
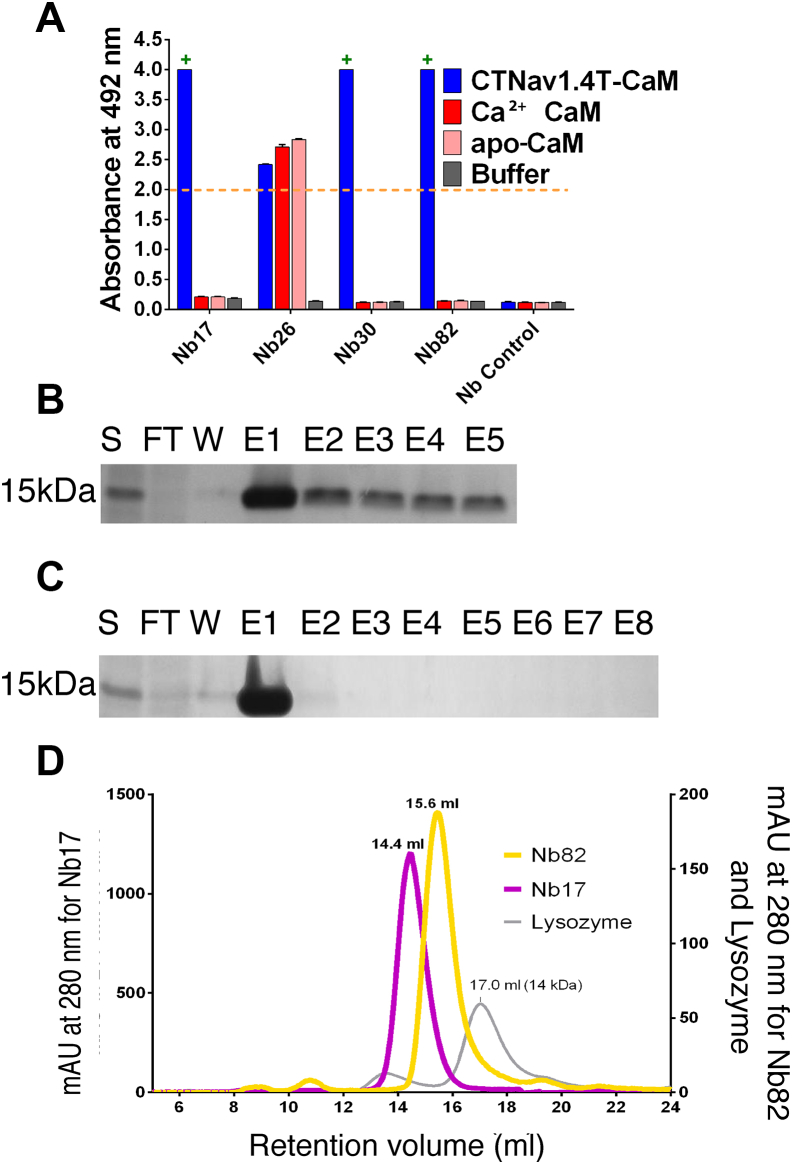
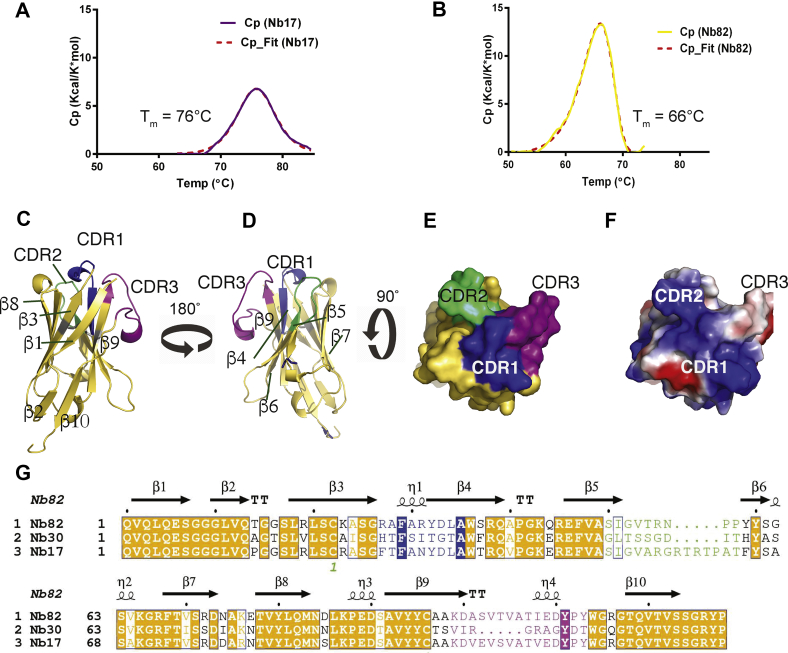
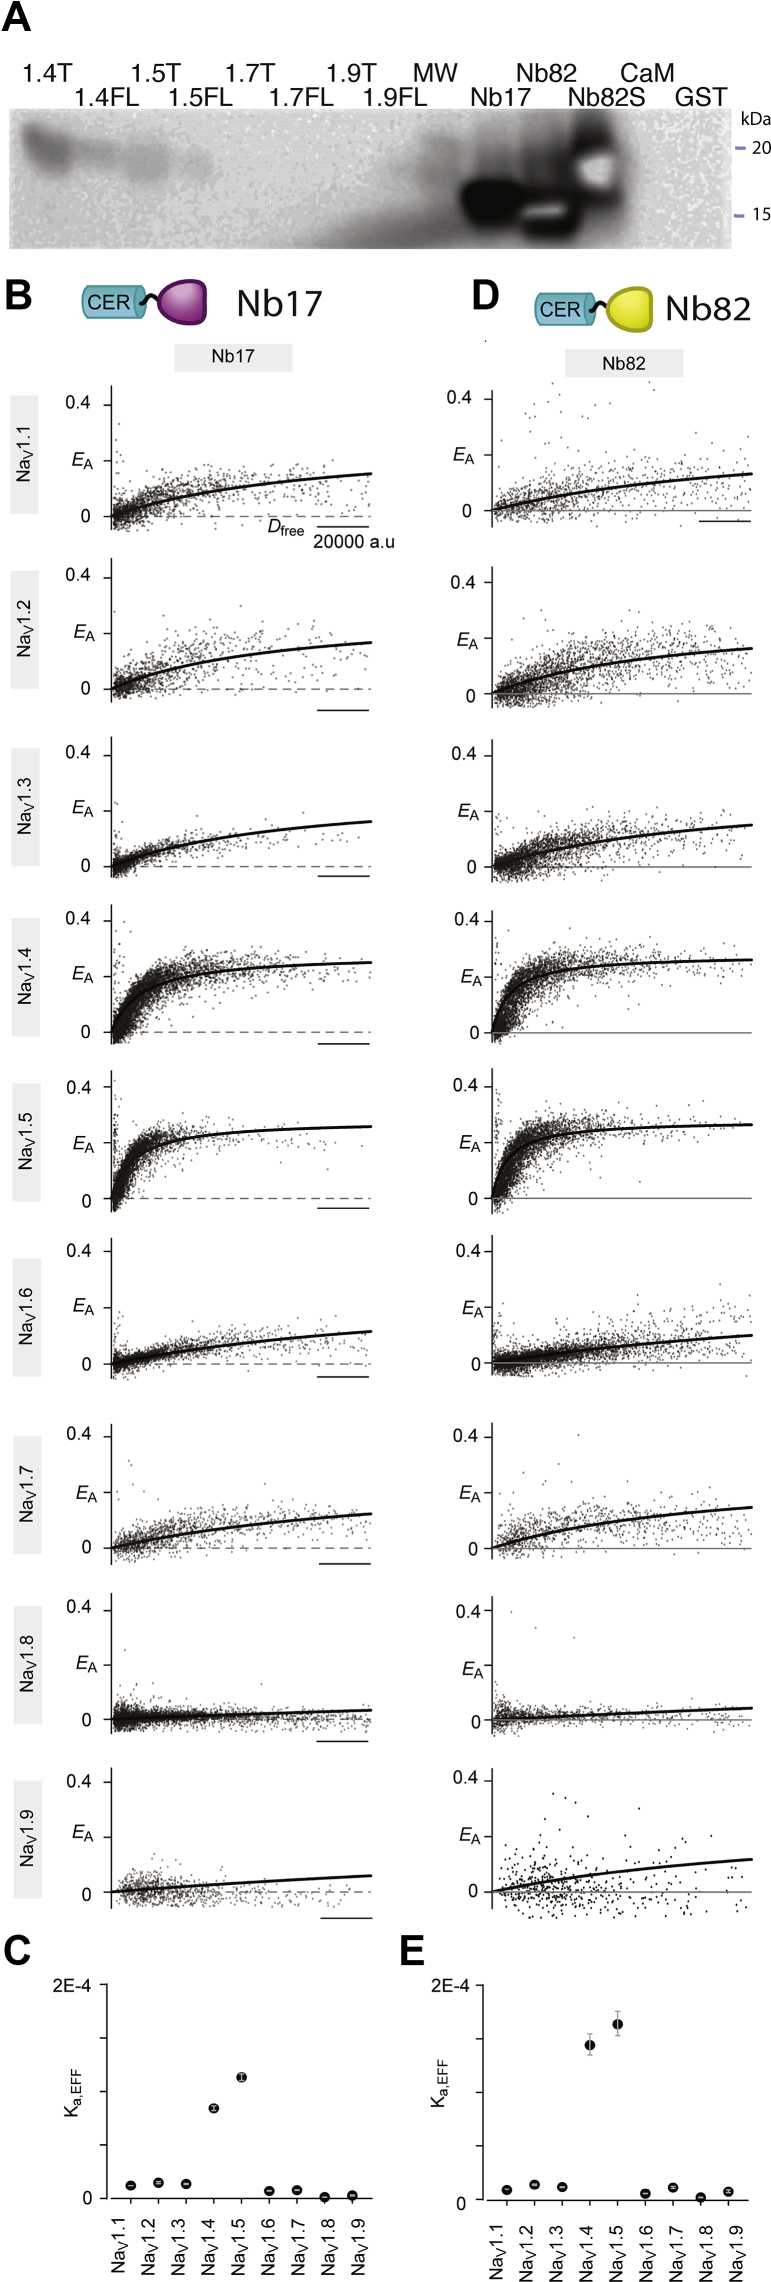
Voltage-gated sodium channels, NaVs, are responsible for the rapid rise of action potentials in excitable tissues. NaV channel mutations have been implicated in several human genetic diseases, such as hypokalemic periodic paralysis, myotonia, and long-QT and Brugada syndromes. Here, we generated high-affinity anti-NaV nanobodies (Nbs), Nb17 and Nb82, that recognize the NaV1.4 (skeletal muscle) and NaV1.5 (cardiac muscle) channel isoforms. These Nbs were raised in llama (Lama glama) and selected from a phage display library for high affinity to the C-terminal (CT) region of NaV1.4. The Nbs were expressed in Escherichia coli, purified, and biophysically characterized. Development of high-affinity Nbs specifically targeting a given human NaV isoform has been challenging because they usually show undesired crossreactivity for different NaV isoforms. Our results show, however, that Nb17 and Nb82 recognize the CTNaV1.4 or CTNaV1.5 over other CTNav isoforms. Kinetic experiments by biolayer interferometry determined that Nb17 and Nb82 bind to the CTNaV1.4 and CTNaV1.5 with high affinity (KD ∼ 40-60 nM). In addition, as proof of concept, we show that Nb82 could detect NaV1.4 and NaV1.5 channels in mammalian cells and tissues by Western blot. Furthermore, human embryonic kidney cells expressing holo NaV1.5 channels demonstrated a robust FRET-binding efficiency for Nb17 and Nb82. Our work lays the foundation for developing Nbs as anti-NaV reagents to capture NaVs from cell lysates and as molecular visualization agents for NaVs.

Keywords: FRET; Lama glama; Na(V)1.4; Na(V)1.5; X-ray diffraction; biolayer interferometry; hIPSC-CM; nanobody; voltage-gated sodium channel.


Conflict of interest statement

Conflict of interest S. B. G. is a founder and holds equity in Advanced Molecular Sciences LLC. S. B. G. is consultant to Genesis Therapeutics and Xinthera, Inc. All other authors declare that they have no conflicts of interest with the contents of this article.

Figures

Figure 1
Figure 1
Scheme describing the steps used for the selection of high-affinity nanobodies (Nbs) specific for voltage-gated sodium channels. Step 1: Production of CTNaV1.4T–CaM to use as antigen. Step 2: Llama immunization with CTNaV1.4T–CaM. Step 3: Collection of immune sera from llama on day 35 and day 40 postimmunization. Step 4: Isolation of lymphocytes to extract total RNA. Step 5: RT–PCR to obtain complementary DNA of VHH domains. Step 6: Cloning of VHH complementary DNA (750 bp) into Escherichia coli shuttle vector for phage display. Step 7: Phage display for selection of Nbs against CTNaV1.4T–CaM in M13 phage. Step 8: Screening phage library by ELISA for high-binding Nb clones. Step 9: Cloning in pHEN6 vector and purification of selected Nb clones (Nb17, Nb30, and Nb82) in E. coli. Step 10: Crystallization of Nb82 using commercially available sparsematrix screens. Step 11: Characterization of Nb binding to NaV1.4 and NaV1.5 isoforms. This rendition was contributed by Sora Ji (Sorajistudio.com). CaM, calmodulin.
Figure 2
Figure 2
Identification of nanobodies (Nbs) specific for NaV1.4.A, ELISA of the periplasmic extract using positively selected clones. Absorbances higher than 2 (orange dashed line) were considered positive. “+” signs over Nb17, Nb30, and Nb82 indicate that they are specific to CTNaV1.4T–CaM but not to Ca2+ CaM or apo-CaM. B, SDS-PAGE gel of IMAC purification of Nb17. C, same as (B) for Nb82. D, size-exclusion chromatogram of Nb17 (17.4 kDa, purple) and Nb82 (16.8 kDa, yellow). Lysozyme (14 kDa, gray) used as gel filtration molecular weight standard is also included. CaM, calmodulin; E, elution fraction; FT, flow-through; IMAC, immobilized metal affinity chromatography; S, supernatant; W, wash.
Figure 3
Figure 3
Nanobody (Nb) thermal stability and crystal structure of Nb82.A, DSC curve showing the temperature denaturation of Nb17 undergoing reversible denaturation with Tm centered at 75.8 °C. B, same as A. Nb82 undergoes irreversible denaturation with Tm centered at 66.0 °C. C, cartoon representation of Nb82 (yellow) displaying the CDR1 (blue), CDR2 (green), and CDR3 (magenta). D, same as (A) with 180° rotation along the vertical axis. E, bird's eye view of Nb82 in (A) with surface coloring according to the CDRs. F, same as (C) with Nb82 surface colored according to the electrostatic charges. G, sequence alignment of Nb82, Nb30, and Nb17. The three CDR regions are color coded as CDR1 (blue), CDR2 (green), and CDR3 (magenta). The secondary structure elements of Nb82 are placed on top of the alignment. CDR, complementarity-determining region; DSC, differential scanning calorimetry.
Figure 4
Figure 4
Nb17 and Nb82 recognize the NaV-muscle isoforms.A, ELISA bar graphs using purified Nb17 (magenta), the absence of Nb17 (green), Nb82 (orange–yellow), and the absence of Nb82 (gray). The red box clusters NaV proteins that represent muscle isoforms CTNaV1.4T–CaM, CTNaV1.4FL–CaM, CTNaV1.5T–CaM, and CTNaV1.5FL–CaM. The gray box clusters the other NaV isoforms tested, CTNaV1.7T–CaM, CTNaV1.7FL–CaM, CTNaV1.9T, CTNaV1.9FL, and CaM. Data are representative of three independent experiments. B, sequence alignment of CTNaV1.4FL, CTNaV1.5FL, CTNaV1.7FL, and CTNaV1.9FL proteins. The black trace indicates the limits of the T CTNaVT–CaM constructs. CaM, calmodulin; FL, full length; Nb, nanobody; T, truncated.
Figure 5
Figure 5
Selectivity of Nb17 and Nb82 in detecting NaV1.4 and NaV1.5 channels.A, Western blot of purified CTNaV–CaM proteins, CaM alone, and Nb17-His, Nb82-His, CaM, and GST alone showing positive signals for CTNaV1.4T/FL (1.4T/1.4FL), CTNaV1.5T/FL (1.5T/1.5FL), and Nb17, Nb82-His and Nb82-StrepII (Nb82S). No signal is observed in the lanes that contained CTNaV1.7T/FL and CTNaV1.9T/FL suggesting that Nb82 does not recognize these two isoforms. Western blot was developed using Nb82-His as primary antibody and anti-HisHRP antibody as secondary. All Western blot data show one representative experiment of three. CTNaV–CaM proteins are labeled CTNaV1.xT (1.xT) and CTNaV1.xFL (1.xFL). B, Nbs tethered to Cerulean serve as a FRET donor, whereas Venus attached to amino-terminal region of CTNaV1.x serves as a FRET acceptor. Robust FRET is observed between Nb17 and CTNaV1.4/5. Other CTNaVs demonstrate reduced binding. FRET efficiency (EA) is plotted against the free donor concentration (Dfree). Each cell represents data from a single cell. C, the relative association constant, Ka,EFF (in arbitrary units) computed as 1/Kdeff from the fits in (A), demonstrates the preference of Nb17 for CTNaV1.4/1.5 over other NaV isoforms. D, analysis of Nb82 shows strong FRET with CTNaV1.4/5. Other Venus-CTNaV1.x isoforms exhibit weaker binding. E, the Ka,EFF values confirm strong preference of Nb82 for CTNaV1.4/5 over other CTNaV1.x isoforms. CaM, calmodulin; FL, full length; GST, glutathione-S-transferase; HRP, horseradish peroxidase; Nb, nanobody; T, truncated.
Figure 6
Figure 6
Nb82 forms a complex with CTNaV1.4–CaM and CTNaV1.5–CaM detected by size-exclusion chromatography (SEC).A, SEC profile for CTNaV1.4T–CaM + Nb82 (solid blue line) showing the appearance a new peak to the left of the CTNaV1.4T–CaM peak (dashed line) indicating complex formation. B, SDS-PAGE gel showing elution fractions from (A). The CTNaV1.4T–CaM + Nb82 complex elutes at 8.7 ml. C and D, same as A and B, using construct CTNaV1.4FL–CaM. The CTNaV1.4FL–CaM + Nb82 elutes at 8.9 ml. E, SEC profile for CTNaV1.5T–CaM + Nb82 (solid green line) showing the appearance of the peak of the complex to the left at 9.1 ml compared with CTNaV1.5T–CaM (dashed line) at 10.6 ml. F, SDS-PAGE gel showing elution fractions from (E). G and H, same as (E) and (F) using construct CTNaV1.5FL–CaM. The CTNaV1.5FL–CaM + Nb82 complex elutes at 8.4 ml. Gel filtration molecular weight standards. BSA (66 kDa, dashed gray line) and lysozyme (14 kDa, solid gray line) are included in A, C, E, and G. BSA, bovine serum albumin; CaM, calmodulin; FL, full length; Nb, nanobody; T, truncated.
Figure 7
Figure 7
Nb82 binds to CTNaV1.4T–CaM and CTNaV1.5T–CaM with nanomolar affinity.A, BLI sensorgram of Nb82 titrated with CTNaV1.4T–CaM at concentrations 6.25, 12.5, 25, 50, 100, and 200 nM plotted as nanometer shift with time. B, same sensorgram as A but for Nb82 titrated with CTNaV1.5T–CaM. CE, sensorgrams showing no binding of Nb82 to CaM alone, CTNaV1.7T–CaM, or CTNaV1.9T, respectively. BLI, biolayer interferometry; CaM, calmodulin; Nb, nanobody; T, truncated.
Figure 8
Figure 8
Nb17 binds to CTNaV1.4T–CaM and CTNaV1.5T–CaM with nanomolar affinity.A, BLI sensorgram of Nb17 titrated with CTNaV1.4T–CaM at concentrations 6.25, 12.5, 25, 50, 100, and 200 nM plotted as nanometer shift with time. B, same sensorgram as (A) but for Nb17 titrated with CTNaV1.5T–CaM. CE, sensorgrams showing no binding of Nb17 to CaM alone, CTNaV1.7T–CaM, or CTNaV1.9T, respectively. BLI, biolayer interferometry; CaM, calmodulin; Nb, nanobody; T, truncated.
Figure 9
Figure 9
Nanobodies (Nbs) as tools to detect NaVchannels from live cells and tissue homogenates.A, schematic of FRET two-hybrid assay to probe live-cell binding of Nbs to holo-NaV1.5 channels. Nbs tethered to Cerulean serve as a FRET donor, whereas Venus attached to NaV1.5 serves as a FRET acceptor. B, robust FRET is observed between Nb17 and NaV1.5. FRET efficiency (EA) is plotted against the free donor concentration (Dfree). Each cell represents data from a single cell. C, analysis of Nb82 also shows strong FRET with NaV1.5. D, no appreciable FRET is observed between NaV1.5-Venus and Cerulean alone. E, Western blot showing Nb82-His used as the primary antibody recognizing NaV1.4(5) channels from tissues; mouse skeletal muscle, mouse heart, and brain. Blot developed using an anti-His-HRP antibody. F, same as (E) developed using the Pan-NaV antibody (Sigma). G, same as (E) and (F) developed using only anti-His HRP antibody as a control. H, Western blot showing Nb82-His used as the primary antibody recognizing Nav1.5 from hiPSC–CMs. I, same as (H) developed using anti-His HRP antibody as a control. CM, cardiomyocyte; hiPSC, human-induced pluripotent stem cell; HRP, horseradish peroxidase.

References

    1. Fozzard H.A., Hanck D.A. Structure and function of voltage-dependent sodium channels: Comparison of brain II and cardiac isoforms. Physiol. Rev. 1996;76:887–926. - PubMed
    1. George A.L., Jr. Inherited disorders of voltage-gated sodium channels. J. Clin. Invest. 2005;115:1990–1999. - PMC - PubMed
    1. Escayg A., MacDonald B.T., Meisler M.H., Baulac S., Huberfeld G., An-Gourfinkel I., Brice A., LeGuern E., Moulard B., Chaigne D., Buresi C., Malafosse A. Mutations of SCN1A, encoding a neuronal sodium channel, in two families with GEFS+2. Nat. Genet. 2000;24:343–345. - PubMed
    1. Wallace R.H., Scheffer I.E., Barnett S., Richards M., Dibbens L., Desai R.R., Lerman-Sagie T., Lev D., Mazarib A., Brand N., Ben-Zeev B., Goikhman I., Singh R., Kremmidiotis G., Gardner A., et al. Neuronal sodium-channel alpha1-subunit mutations in generalized epilepsy with febrile seizures plus. Am. J. Hum. Genet. 2001;68:859–865. - PMC - PubMed
    1. Wulff H., Christophersen P., Colussi P., Chandy K.G., Yarov-Yarovoy V. Antibodies and venom peptides: New modalities for ion channels. Nat. Rev. Drug Discov. 2019;18:339–357. - PMC - PubMed

MeSH terms