

Stringency of containment and closures on the growth of SARS-CoV-2 in Canada prior to accelerated vaccine roll-out
- PMID: 35202783
- PMCID: PMC8863413
- DOI: 10.1016/j.ijid.2022.02.030
Stringency of containment and closures on the growth of SARS-CoV-2 in Canada prior to accelerated vaccine roll-out
Abstract
Background: Many studies have examined the effectiveness of non-pharmaceutical interventions (NPIs) on SARS-CoV-2 transmission worldwide. However, less attention has been devoted to understanding the limits of NPIs across the course of the pandemic and along a continuum of their stringency. In this study, we explore the relationship between the growth of SARS-CoV-2 cases and an NPI stringency index across Canada before the accelerated vaccine roll-out.
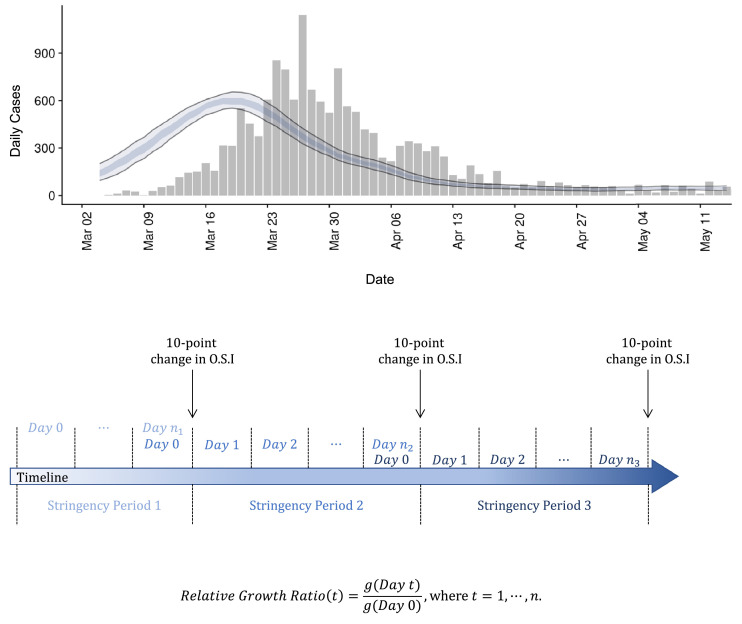
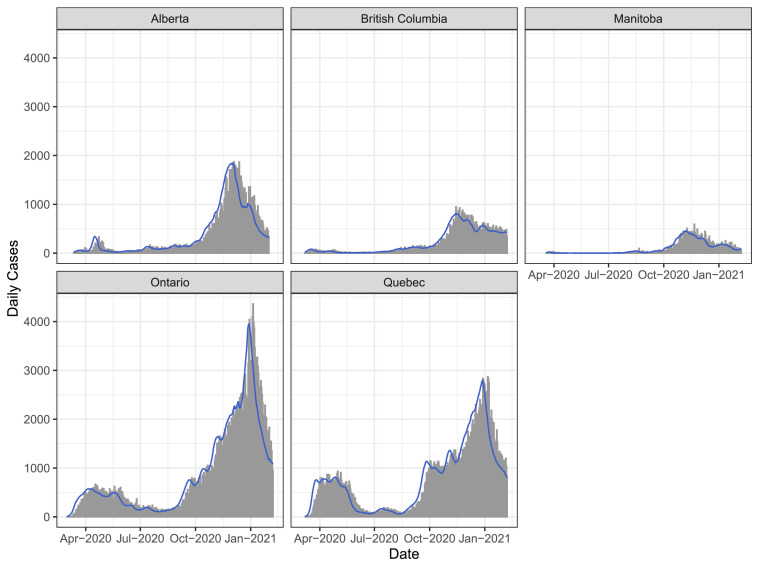
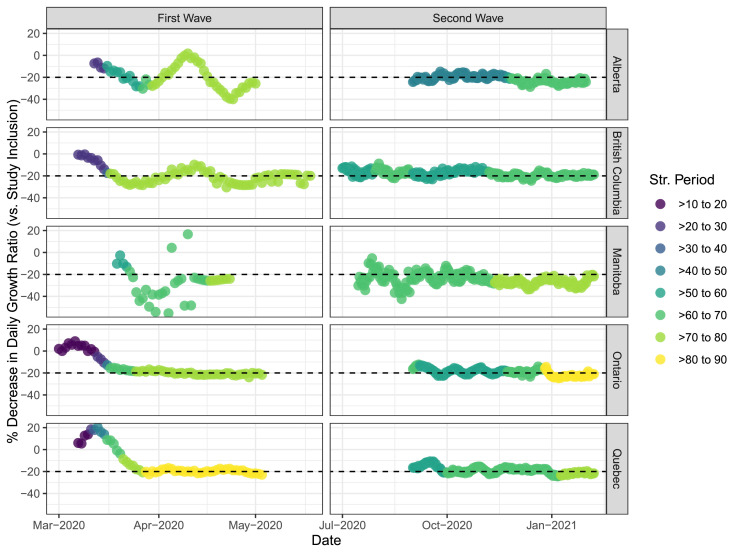
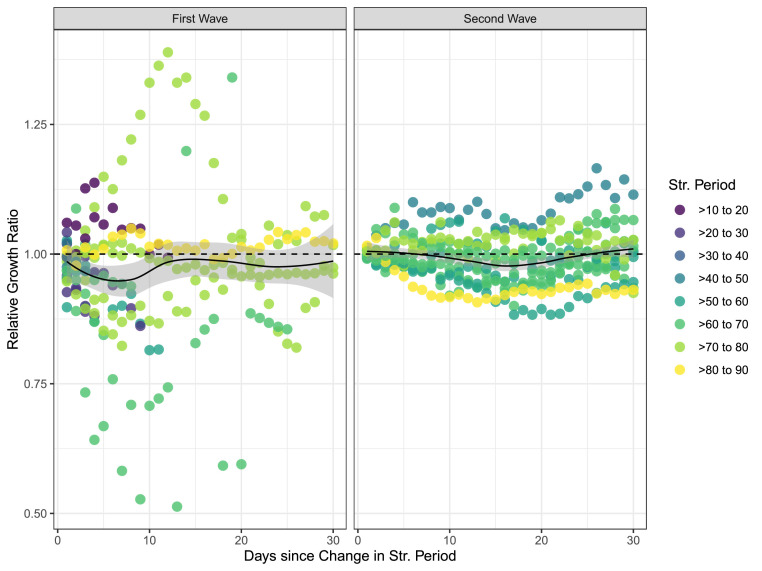
Methods: We conducted an ecological time-series study of daily SARS-CoV-2 case growth in Canada from February 2020 to February 2021. Our outcome was a back-projected version of the daily growth ratio in a stringency period (i.e., a 10-point range of the stringency index) relative to the last day of the previous period. We examined the trends in case growth using a linear mixed-effects model accounting for stringency period, province, and mobility in public domains.
Results: Case growth declined rapidly by 20-60% and plateaued within the first month of the first wave, irrespective of the starting values of the stringency index. When stringency periods increased, changes in case growth were not immediate and were faster in the first wave than in the second. In the first wave, the largest decreasing trends from our mixed effects model occurred in both early and late stringency periods, depending on the province, at a geometric mean index value of 30⋅1 out of 100. When compared with the first wave, the stringency periods in the second wave possessed little association with case growth.
Conclusions: The minimal association in the first wave, and the lack thereof in the second, is compatible with the hypothesis that NPIs do not, per se, lead to a decline in case growth. Instead, the correlations we observed might be better explained by a combination of underlying behaviors of the populations in each province and the natural dynamics of SARS-CoV-2. Although there exist alternative explanations for the equivocal relationship between NPIs and case growth, the onus of providing evidence shifts to demonstrating how NPIs can consistently have flat association, despite incrementally high stringency.
Keywords: Epidemiology; Non-pharmaceutical Interventions; SARS-CoV-2; Stringency Index.
Copyright © 2022 The Authors. Published by Elsevier Ltd.. All rights reserved.
Figures

Similar articles
-
The stringency of the containment measures in response to COVID-19 inversely correlates with the overall disease occurrence over the epidemic wave.Bratisl Lek Listy. 2022;123(9):601-617. doi: 10.4149/BLL_2022_098. Bratisl Lek Listy. 2022. PMID: 36039877
-
Virological evidence of the impact of non-pharmaceutical interventions against COVID-19 in Ecuador, a resource-limited setting.Emerg Microbes Infect. 2023 Dec;12(2):2259001. doi: 10.1080/22221751.2023.2259001. Epub 2023 Sep 12. Emerg Microbes Infect. 2023. PMID: 37698611 Free PMC article.
-
Impact of vaccination and non-pharmaceutical interventions on SARS-CoV-2 dynamics in Switzerland.Epidemics. 2022 Mar;38:100535. doi: 10.1016/j.epidem.2021.100535. Epub 2021 Dec 14. Epidemics. 2022. PMID: 34923396 Free PMC article.
-
Non-pharmaceutical interventions in containing COVID-19 pandemic after the roll-out of coronavirus vaccines: a systematic review.BMC Public Health. 2024 Jun 6;24(1):1524. doi: 10.1186/s12889-024-18980-2. BMC Public Health. 2024. PMID: 38844867 Free PMC article.
-
Effects of non-pharmaceutical interventions on COVID-19 transmission: rapid review of evidence from Italy, the United States, the United Kingdom, and China.Front Public Health. 2024 Oct 17;12:1426992. doi: 10.3389/fpubh.2024.1426992. eCollection 2024. Front Public Health. 2024. PMID: 39484353 Free PMC article.
Cited by
-
Effectiveness of non-pharmaceutical interventions to reduce SARS-CoV-2 transmission in Canada and their association with COVID-19 hospitalization rates.Can Commun Dis Rep. 2022 Oct 1;48(10):438-448. eCollection 2022 Oct 1. Can Commun Dis Rep. 2022. PMID: 38162959 Free PMC article.
-
Counterfactuals of effects of vaccination and public health measures on COVID-19 cases in Canada: what could have happened?Front Public Health. 2023 May 9;11:1173673. doi: 10.3389/fpubh.2023.1173673. eCollection 2023. Front Public Health. 2023. PMID: 37228725 Free PMC article. No abstract available.
-
Incidence of SARS-CoV-2 over four epidemic waves in a low-resource community in Rio de Janeiro, Brazil: A prospective cohort study.Lancet Reg Health Am. 2022 Aug;12:100283. doi: 10.1016/j.lana.2022.100283. Epub 2022 May 26. Lancet Reg Health Am. 2022. PMID: 35663637 Free PMC article.
-
Canada's provincial COVID-19 pandemic modelling efforts: A review of mathematical models and their impacts on the responses.Can J Public Health. 2024 Aug;115(4):541-557. doi: 10.17269/s41997-024-00910-9. Epub 2024 Jul 25. Can J Public Health. 2024. PMID: 39060710 Free PMC article. Review.
-
Influence of Seasonality and Public-Health Interventions on the COVID-19 Pandemic in Northern Europe.J Clin Med. 2024 Jan 6;13(2):334. doi: 10.3390/jcm13020334. J Clin Med. 2024. PMID: 38256468 Free PMC article.
References
-
- Abbott S, Hellewell J, Thompson RN, Sherratt K, Gibbs HP, Bosse NI, et al. Estimating the time-varying reproduction number of SARS-CoV-2 using national and subnational case counts [version 2; peer review: 1 approved with reservations] Wellcome Open Res. 2020;5:112. doi: 10.12688/wellcomeopenres.16006.2. - DOI
-
- Alberta Health. COVID-19 Alberta Statistics: https://www.alberta.ca/stats/covid-19-alberta-statistics.htm (Last accessed: 24 August 2021).
-
- British Columbia Centre for Disease Control. BC COVID-19 Data: http://www.bccdc.ca/health-info/diseases-conditions/covid-19/data (Last accessed: 24 August 2021).
MeSH terms
Substances
LinkOut - more resources
Full Text Sources
Medical
Miscellaneous
