. 2022 Dec 15;33(1):23-34.
doi: 10.1093/cercor/bhac050.

Spike-timing-dependent plasticity rewards synchrony rather than causality

Affiliations

Spike-timing-dependent plasticity rewards synchrony rather than causality

Margarita Anisimova et al. Cereb Cortex. .

Abstract

Spike-timing-dependent plasticity (STDP) is a candidate mechanism for information storage in the brain, but the whole-cell recordings required for the experimental induction of STDP are typically limited to 1 h. This mismatch of time scales is a long-standing weakness in synaptic theories of memory. Here we use spectrally separated optogenetic stimulation to fire precisely timed action potentials (spikes) in CA3 and CA1 pyramidal cells. Twenty minutes after optogenetic induction of STDP (oSTDP), we observed timing-dependent depression (tLTD) and timing-dependent potentiation (tLTP), depending on the sequence of spiking. As oSTDP does not require electrodes, we could also assess the strength of these paired connections three days later. At this late time point, late tLTP was observed for both causal (CA3 before CA1) and anticausal (CA1 before CA3) timing, but not for asynchronous activity patterns (Δt = 50 ms). Blocking activity after induction of oSTDP prevented stable potentiation. Our results confirm that neurons wire together if they fire together, but suggest that synaptic depression after anticausal activation (tLTD) is a transient phenomenon.

Keywords: LTP; hippocampus; optogenetics; rat; synaptic plasticity.


Figures

Fig. 1
Fig. 1
Selecting wavelength and intensity for independent spiking of CheRiff-CA1 and ChrimsonR-CA3 neurons. (A) Confocal image (maximum intensity projection) of an organotypic hippocampal slice culture (DIV 21) taken 7 days after transducing ~30 CA3 neurons with AAVRh10-syn-ChrimsonR-tdTomato (magenta) and electroporating 4 CA1 neurons with pAAV-syn-CheRiff-eGFP (green). Scale bar 500 μm. (B) Color-coded photocurrent amplitude in response to 1 ms light flashes of varying intensity and wavelength of ChrimsonR-CA3 (left) and CheRiff-CA1 neurons (right). Circles indicate parameters used in plasticity experiments. n = 4 recordings per point, from 11 ChrimsonR-CA3 and 7 CheRiff-CA1 neurons. (C) Photocurrent amplitude vs wavelength from the data in (B) at intensities of 1, 5, and 10 mW mm−2. Regions of overlap will depolarize both CheRiff- and ChrimsonR-expressing neurons. At 10 mW mm−2, the maximum current recorded from CheRiff-CA1 neurons was −2100 ± 500 pA at 435 nm (mean ± SEM). Dotted lines indicate the optimal wavelengths to independently activate ChrimsonR-CA3 and CheRiff-CA1 neurons. Mean ± SEM, n = 4 measurements per point. (D) Example membrane responses of a CheRiff-CA1 (upper traces) and a ChrimsonR-CA3 (lower traces) neuron to 2 ms light flashes at 405 nm (1 mW mm−2, blue arrows) and 625 nm (8 mW mm−2, red arrows). Note the CheRiff-CA1 neuron fires a single action potential and the ChrimsonR-CA3 neuron only slightly depolarizes in response to 405 nm light, whereas the ChrimsonR-CA3 neuron fires one action potential in response to 625 nm and there is no response in the CheRiff-CA1 neuron. Note that in these experiments synaptic transmission was blocked.
Fig. 2
Fig. 2
Optogenetic induction of oSTDP produces or timing-dependent tLTP and tLTD. (A) Diagram of the electrophysiological recording setup for on-axis CA1 stimulation through the objective and off-axis CA3 stimulation through the condenser. (B) Experimental configuration with patch-electrode in CA1. (C) Current-clamp recordings from CA1 neurons during oSTDP induction. Top, a CheRiff-transfected (Tr) CA1 neuron during anticausal pairing (−10 ms: 3 violet (405 nm) flashes at 50 Hz and 1 red (625 nm) flash 8 ms after, repeated 300x at 5 Hz). Middle, a CheRiff-transfected CA1 neuron during causal pairing (+10 ms: 1 red flash and 3 violet flashes at 50 Hz 12 ms after). Bottom, a NT CA1 neuron during causal pairing. Black ticks at left indicate −70 mV. (D) Left, example causal pairing experiment from one CheRiff-CA1 neuron. EPSCs were evoked by light stimulation of ChrimsonR-CA3 neurons before (black points) and after (gray points) causal pairing at t = 0 (black arrow). The filled points were significantly different, P < 0.0001, Kolmogorov–Smirnov. Right, averaged EPSCs from the filled points, orange arrow indicates stimulation of ChrimsonR-CA3 neurons. (E) As in panel (D), but after anticausal stimulation (black arrow). The filled gray points were significantly different to the baseline, P = 0.0003, Kolmogorov–Smirnov. (F) Normalized change in EPSC slope 20–25 min after oSTDP induction as in panels (D) (+10, n = 12) and E (−10, n = 11). NT, nontransfected neurons from slices subjected to causal pairing stimulation (n = 6). ***P = 0.0003, ANOVA-Sidak. Mean ± SEM
Fig. 3
Fig. 3
After causal pairing, cFos expression was confined to CheRiff-CA1 neurons when less than 60 ChrimsonR-CA3 neurons were stimulated. Confocal images (average intensity projection) of CA3 and CA1 areas of 3 slice cultures expressing ChrimsonR-tdT in CA3 (magenta) and CheRiff-eGFP in CA1 neurons (green, white arrows indicate nuclei). In red is cFos immunofluorescence. Slices were fixed 1 h after causal pairing stimulation (pattern in Fig. 2D). (A) A slice with fewer than 50 ChrimsonR-CA3 expressing neurons stimulated during pairing. Note that cFos immunoreactivity is restricted to the CheRiff-CA1 neurons and neighboring CA1 neurons are not cFos positive (5 of 6 are cFos positive). (B, C) Slices with more than 50 ChrimsonR-CA3 neurons. Note the cFos positive CA1 neurons in addition to the CheRiff-CA1 neurons. Scale bars 100 μm.
Fig. 4
Fig. 4
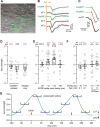
Input to Cheriff-CA1 neurons 3 days after optogenetic STDP. (A) Dodt-contrast image (40x objective) of the CA1 region with overlaid epifluorescence image. Black asterisks: CheRiff-eGFP expressing CA1 pyramidal neurons; white asterisks: NT CA1 pyramidal neurons suitable for recording. Scale bar 25 μm. (B) Yellow light (1 ms, 594 nm) on ChrimsonR-CA3 neurons EPSCs in CA1 neurons of a control (no oSTDP pairing) slice. EPSCs are recorded sequentially from CheRiff-CA1 pyramidal neurons (green, average of 10 gray individual EPSCs) and at least 3 NT CA1 neurons (black average of 10 gray individual EPSCs). (C) Automatically detected EPSC peak (red x) and slope (dashed red line, 20–60% peak) from individual CheRiff-CA1 neurons and the average of NT neurons. (D–F) Red and violet ticks indicate pre- (red) and post-synaptic (violet) light stimulation. (D) Normalized input strength of CheRiff-CA1 neurons recorded from nonpaired control (left: no light stimulation; right: postsynaptic stimulation only) slices and mKate2-CA1 neurons 3 days later. mean ± SEM. n = 12; 7; 10 (left to right). (E) Normalized input strength of CheRiff-CA1 neurons 3 days after 300 pairings of single presynaptic and 3 postsynaptic spikes at 5 Hz. During anticausal pairing the last postsynaptic spike occurred −50 or − 10 ms before the EPSP. During causal pairing the first postsynaptic spike occurred +10 or + 50 ms after the EPSP. n = 10; 24; 25; 10 (left to right). *P < 0.05, ***P < 0.001. (F) Same as (E), but the pairing frequency was reduced to 0.1 Hz (360 pairings in 1 h) or the NMDA receptor antagonist CPPene (1 μM) was in the culture medium (±10 ms pairing 300x at 5 Hz. n = 5; 14; 14; 13, left to right). (G) Mean input strength (data from E) as a function of timing between EPSPs (red) and postsynaptic spike bursts (violet, at mean) at 5 Hz repetition frequency. Two complete cycles are illustrated.
Fig. 5
Fig. 5
Late tLTP after anticausal pairing is time and activity dependent. (A) Input strength 3 days after anticausal (−10 ms) pairing using different numbers of repetitions n = 8; 11; 24; 14 (left to right). The 300 repetition group is replotted from Figure 4E. *P < 0.05 mean ± SEM. (B) Input strength at varying times after anticausal pairing and when spiking was blocked with TTX (1 μM) from 3 to 4 h until 1 day before assessment. n = 11, 9, 24, 8 (left to right). *P < 0.05 mean ± SEM The mean ± SEM 20 min and 3 day data are replotted without the individual points from Figures 2F and 4E. (C) Input strength at varying times after causal pairing and when spiking was blocked with TTX (1 μM) from 3 to 4 h until 1 day before assessment. n = 12, 7, 25, 17 (left to right). *P < 0.05 mean ± SEM The mean ± SEM 20 min and 3 day data are replotted from Figures 2F and 4E.

References

    1. Adamantidis AR, Zhang F, Aravanis AM, Deisseroth K, de Lecea L. Neural substrates of awakening probed with optogenetic control of hypocretin neurons. Nature. 2007:450:420–424. - PMC - PubMed
    1. Bi G, Poo M. Synaptic modifications in cultured hippocampal neurons: dependence on spike timing, synaptic strength, and postsynaptic cell type. J Neurosci. 1998:18:10464–10472. - PMC - PubMed
    1. Bing Z, Meschede C, Chen G, Knoll A, Huang K. Indirect and direct training of spiking neural networks for end-to-end control of a lane-keeping vehicle. Neural Netw. 2020:121:21–36. - PubMed
    1. Bittner KC, Milstein AD, Grienberger C, Romani S, Magee JC. Behavioral time scale synaptic plasticity underlies CA1 place fields. Science (80-). 2017:357:1033–1036. - PMC - PubMed
    1. Boyden ES, Zhang F, Bamberg E, Nagel G, Deisseroth K. Millisecond-timescale, genetically targeted optical control of neural activity. Nat Neurosci. 2005:8:1263–1268. - PubMed

Publication types