. 2022 Feb 15;11(4):680.
doi: 10.3390/cells11040680.

PU.1 Expression Defines Distinct Functional Activities in the Phenotypic HSC Compartment of a Murine Inflammatory Stress Model

Affiliations

PU.1 Expression Defines Distinct Functional Activities in the Phenotypic HSC Compartment of a Murine Inflammatory Stress Model

James S Chavez et al. Cells. .

Abstract

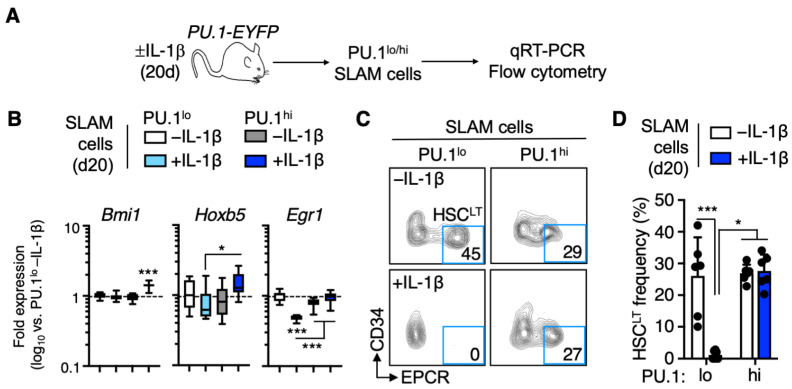
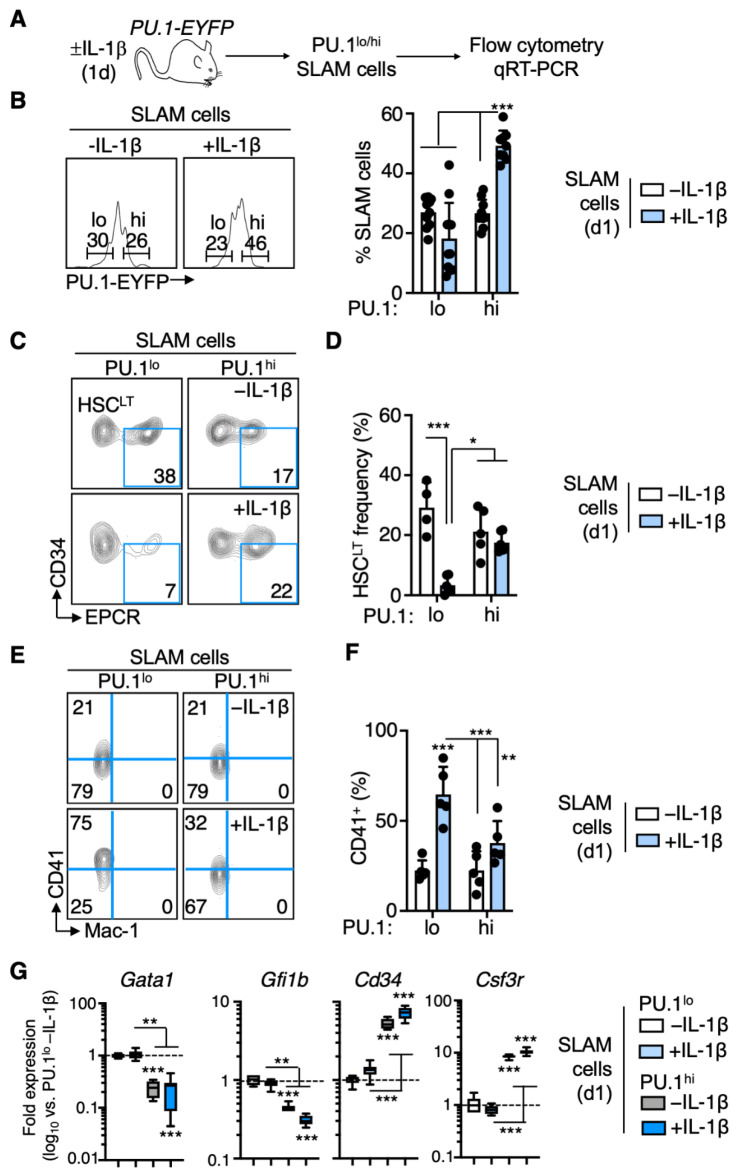
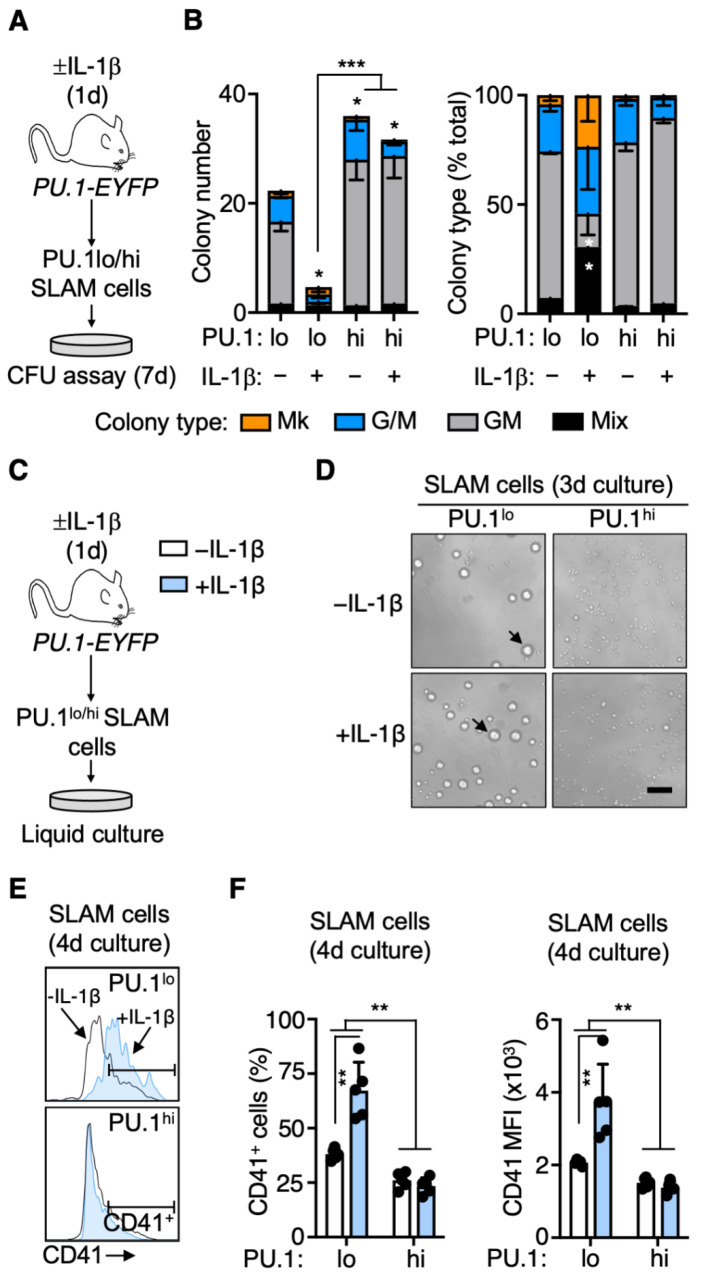
The transcription factor PU.1 is a critical regulator of lineage fate in blood-forming hematopoietic stem cells (HSC). In response to pro-inflammatory signals, such as the cytokine IL-1β, PU.1 expression is increased in HSC and is associated with myeloid lineage expansion. To address potential functional heterogeneities arising in the phenotypic HSC compartment due to changes in PU.1 expression, here, we fractionated phenotypic HSC in mice using the SLAM surface marker code in conjunction with PU.1 expression levels, using the PU.1-EYFP reporter mouse strain. While PU.1lo SLAM cells contain extensive long-term repopulating activity and a molecular signature corresponding to HSC activity at steady state, following IL-1β treatment, HSCLT induce PU.1 expression and are replaced in the PU.1lo SLAM fraction by CD41+ HSC-like megakaryocytic progenitors (SL-MkP) with limited long-term engraftment capacity. On the other hand, the PU.1hi SLAM fraction exhibits extensive myeloid lineage priming and clonogenic activity and expands rapidly in response to IL-1β. Furthermore, we show that EPCR expression, but not CD150 expression, can distinguish HSCLT and SL-MkP under inflammatory conditions. Altogether, our data provide insights into the dynamic regulation of PU.1 and identify how PU.1 levels are linked to HSC fate in steady state and inflammatory stress conditions.

Keywords: PU.1; hematopoiesis; hematopoietic stem cell; inflammation; megakaryocyte; myeloid.


Conflict of interest statement

The authors declare no competing interest.

Figures

Figure 1
Figure 1
PU.1 levels define distinct repopulating activities following chronic IL-1β treatment. (A) Experimental design for isolation and functional characterization of PU.1hi/lo SLAM fractions of PU.1-EYFP mice treated for 20 d IL-1β. (B) Representative FACS plot (left) and summary data (right) showing frequency of PU.1lo and PU.1hi SLAM cells in PU.1-EYFP mice treated for 20 d IL-1β (n = 6–8/grp). Individual values are shown, and bars represent mean values. Data are compiled from two independent experiments. (C) CFU assay of PU.1lo and PU.1hi SLAM cells isolated from PU.1-EYFP mice treated for 20 d IL-1β (n = 3/grp). Individual values are shown, and bars represent mean values. Data are representative of two independent experiments. (D) Experimental design for isolation and transplant of purified PU.1hi and PU.1lo SLAM cells from PU.1-EYFP mice treated for 20 d IL-1β into lethally irradiated recipient mice. (E) Summary data showing donor peripheral blood chimerism in transplanted recipient mice (n = 6–8/grp). Data are compiled from two independent experiments. Bars represent mean values. (F) Summary data showing donor BM SLAM cell chimerism in recipient mice at 20 weeks post transplant (n = 6–8/grp). Individual values are shown, and bars represent mean values. Data are compiled from two independent experiments. Data are shown as means SD. Significance was determined by ANOVA with Tukey’s post-test. * p < 0.05; ** p < 0.01; *** p < 0.001.
Figure 2
Figure 2
EPCR+ HSCLT are depleted from the PU.1lo SLAM fraction following IL-1β treatment. (A) Experimental design for analysis of SLAM cells from PU.1-EYFP mice treated for 20 d IL-1β. (B) Fluidigm qRT-PCR analysis of HSC genes in PU.1lo and PU.1hi SLAM cells from PU.1-EYFP mice treated for 20 d IL-1β (n = 8/grp). Data are expressed as log10 fold change versus PU.1lo -IL-1β. Box represents upper and lower quartiles, with line representing median value. Whiskers represent minimum and maximum values. Data are representative of two independent experiments. (C) Representative FACS plot showing phenotypic HSCLT frequencies within the SLAM gate in PU.1-EYFP mice treated for 20 d IL-1β. (D) Summary data showing phenotypic HSCLT frequency within the SLAM gate of PU.1-EYFP mice treated for 20 d IL-1β (n = 6/grp). Individual values are shown, and bars represent mean values. Data are compiled from two independent experiments. Data are shown as means SD. Significance was determined by ANOVA with Tukey’s post-test. * p < 0.05; *** p < 0.001.
Figure 3
Figure 3
Distinct patterns of lineage priming in the SLAM compartment associated with PU.1 levels. (A) Experimental design for analysis of SLAM cells from PU.1-EYFP mice treated for 20 d IL-1β. (B) Fluidigm qRT-PCR analysis of megakaryocyte/erythroid and myeloid lineage genes in PU.1lo and PU.1hi SLAM cells from PU.1-EYFP mice treated for 20 d IL-1β (n = 8/grp). Data are expressed as log10 fold change versus PU.1lo -IL-1β. Box represents upper and lower quartiles, with line representing median value. Whiskers represent minimum and maximum values. Data are representative of two independent experiments. (C) Representative FACS plot showing frequencies of CD41+ and Mac-1+ cells within the SLAM gate in PU.1-EYFP mice treated for 20 d IL-1β. (D) Frequency of CD41+ cells within the SLAM gate of PU.1-EYFP mice treated for 20 d IL-1β (n = 3–5/grp). Individual values are shown, and bars represent mean values. Data are representative of two independent experiments. (E) Frequency of Mac-1+ cells within the SLAM gate of PU.1-EYFP mice treated for 20 d IL-1β (n = 3–5/grp). Individual values are shown, and bars represent mean values. Data are representative of two independent experiments. Data are shown as means SD. Significance was determined by ANOVA with Tukey’s post-test. * p < 0.05; *** p < 0.001.
Figure 4
Figure 4
Rapid PU.1 induction and expansion of lineage-primed SLAM cells in response to IL-1β. (A) Experimental design for analysis of PU.1-EYFP mice treated for 1 d IL-1 (n = 6/grp). (B) Representative FACS plot (left) and summary data (right) showing frequency of PU.1lo and PU.1hi SLAM cells in PU.1-EYFP mice treated for 20 d IL-1β (n = 8–10/grp). Individual values are shown, and bars represent mean values. Data are compiled from two independent experiments. (C) Representative FACS plot showing phenotypic HSCLT frequencies within the SLAM gate in PU.1-EYFP mice treated for 20 d IL-1β. (D) Summary data showing phenotypic HSCLT frequency within the SLAM gate of PU.1-EYFP mice treated for 20 d IL-1β (n = 4–6/grp). Individual values are shown, and bars represent mean values. Data are compiled from two independent experiments. (E) Representative FACS plot showing frequencies of CD41+ and Mac-1+ cells within the SLAM gate in PU.1-EYFP mice treated for 1 d IL-1β. (F) Frequency of CD41+ cells within the SLAM gate of PU.1-EYFP mice treated for 1 d IL-1β (n = 5/grp). Individual values are shown, and bars represent mean values. Data are representative of two independent experiments. (G) Fluidigm qRT-PCR analysis of genes in PU.1lo and PU.1hi SLAM cells from PU.1-EYFP mice treated for 1 d IL-1β (n = 8/grp). Data are expressed as log10 fold change versus PU.1lo -IL-1β. Box represents upper and lower quartiles with line representing median value. Whiskers represent minimum and maximum values. Data are representative of two independent experiments. Data are shown as means SD. Significance was determined by ANOVA with Tukey’s post-test. * p < 0.05; ** p < 0.01; *** p < 0.001.
Figure 5
Figure 5
PU.1lo SLAM cells from IL-1β-treated mice exhibit characteristics of SL-MkP. (A) Experimental design for in vitro methylcellulose culture analysis of PU.1lo and PU.1hi SLAM cells from PU.1-EYFP mice treated for 1 d IL-1β (n = 3/grp). (B) Colony number (left) and colony type distribution (right) of methylcellulose-cultured PU.1lo and PU.1hi SLAM cells from PU.1-EYFP mice treated for 1 d IL-1β (n = 3/grp). Colony types were based on visual scoring. Colony type distribution is expressed as % total colonies. Data are representative of two independent experiments. Mk: megakaryocytic; G/M. (C) Experimental design for in vitro liquid culture analysis of PU.1lo and PU.1hi SLAM cells from PU.1-EYFP mice treated for 1 d IL-1β (n = 5/grp). (D) Representative phase-contrast microscope images after 3-day culture of PU.1lo and PU.1hi SLAM cells from PU.1-EYFP mice treated for 1 d IL-1β. Scale bar: 100μm. Arrows indicate Mk-progenitor-like cells. (E) Representative histograms of CD41 expression after 4-day culture of PU.1lo and PU.1hi SLAM cells from PU.1-EYFP mice treated for 1 d IL-1β. (F) Summary data showing frequency of CD41+ cells (left) and overall CD41 expression levels (right) after 4-day culture of PU.1lo and PU.1hi SLAM cells from PU.1-EYFP mice treated for 1 d IL-1β (n = 5/grp). Expression data are geometric mean fluorescence intensity (MFI). Individual values are shown, and bars represent mean values. Data are representative of two independent experiments. Data are shown as means SD. Significance was determined by ANOVA with Tukey’s post-test. * p < 0.05; ** p < 0.01. *** p < 0.001.

References

    1. King K.Y., Goodell M.A. Inflammatory modulation of HSCs: Viewing the HSC as a foundation for the immune response. Nat. Rev. Immunol. 2011;11:685–692. doi: 10.1038/nri3062. - DOI - PMC - PubMed
    1. Caiado F., Pietras E.M., Manz M.G. Inflammation as a regulator of hematopoietic stem cell function in disease, aging, and clonal selection. J. Exp. Med. 2021;218:e20201541. doi: 10.1084/jem.20201541. - DOI - PMC - PubMed
    1. Pietras E.M., Mirantes-Barbeito C., Fong S., Loeffler D., Kovtonyuk L.V., Zhang S., Lakshminarasimhan R., Chin C.P., Techner J.-M., Will B., et al. Chronic interleukin-1 exposure drives haematopoietic stem cells towards precocious myeloid differentiation at the expense of self-renewal. Nat. Cell Biol. 2016;18:607–618. doi: 10.1038/ncb3346. - DOI - PMC - PubMed
    1. Ueda Y., Cain D.W., Kuraoka M., Kondo M., Kelsoe G. IL-1R type I-dependent hemopoietic stem cell proliferation is necessary for inflammatory granulopoiesis and reactive neutrophilia. J. Immunol. 2009;182:6477–6484. doi: 10.4049/jimmunol.0803961. - DOI - PMC - PubMed
    1. Hernandez G., Mills T.S., Rabe J.L., Chavez J.S., Kuldanek S., Kirkpatrick G., Noetzli L., Jubair W.K., Zanche M., Meyers J.R., et al. Pro-inflammatory cytokine blockade attenuates myeloid expansion in a murine model of rheumatoid arthritis. Haematologica. 2020;105:585–597. doi: 10.3324/haematol.2018.197210. - DOI - PMC - PubMed

Publication types