. 2022 Feb 16;11(4):684.
doi: 10.3390/cells11040684.

L-Thyroxine Improves Vestibular Compensation in a Rat Model of Acute Peripheral Vestibulopathy: Cellular and Behavioral Aspects

Affiliations

L-Thyroxine Improves Vestibular Compensation in a Rat Model of Acute Peripheral Vestibulopathy: Cellular and Behavioral Aspects

Guillaume Rastoldo et al. Cells. .

Abstract

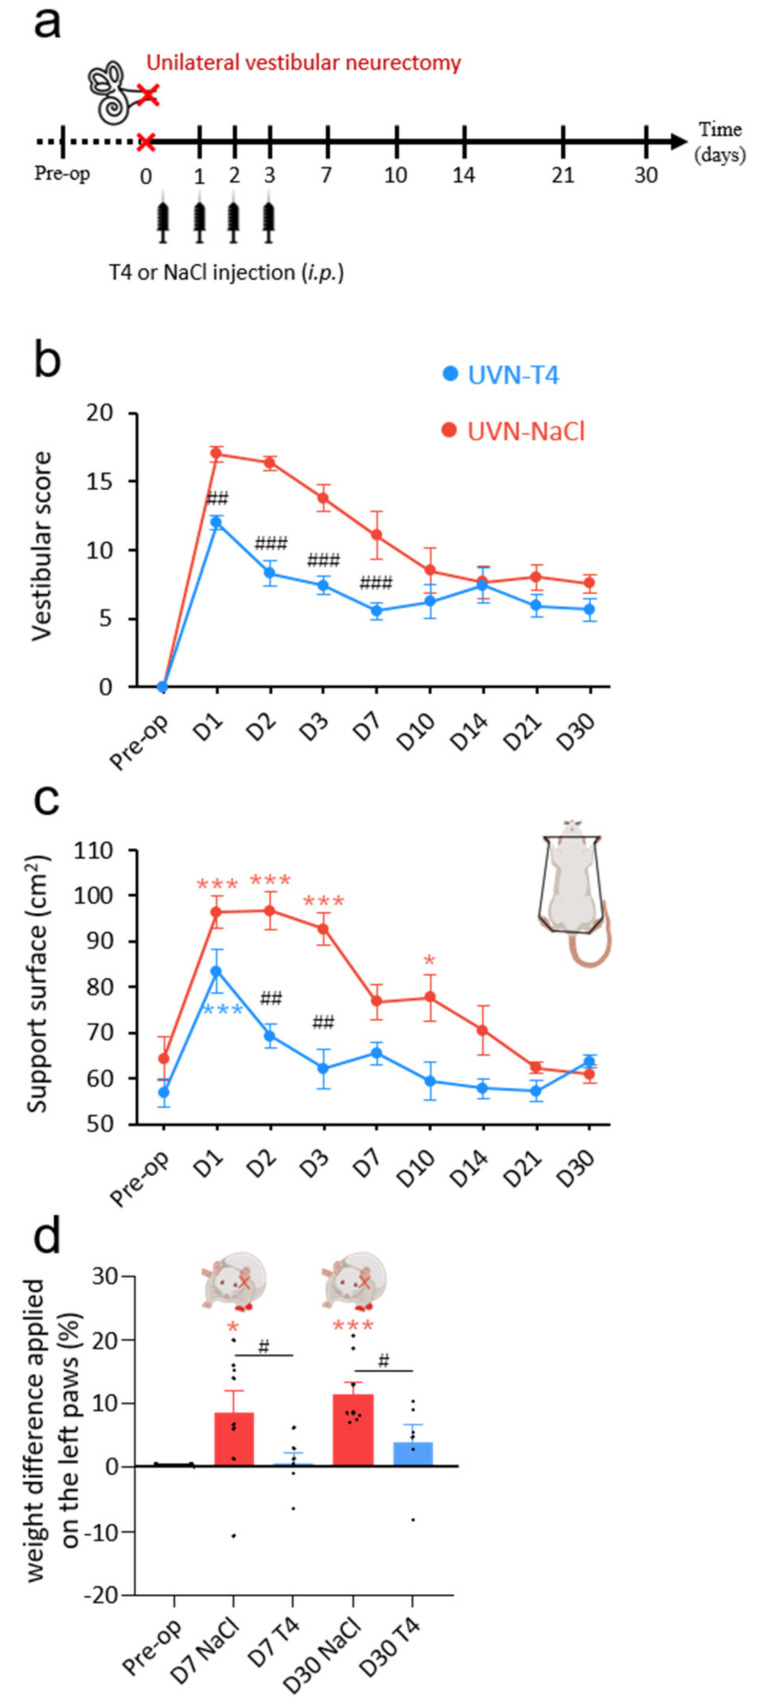
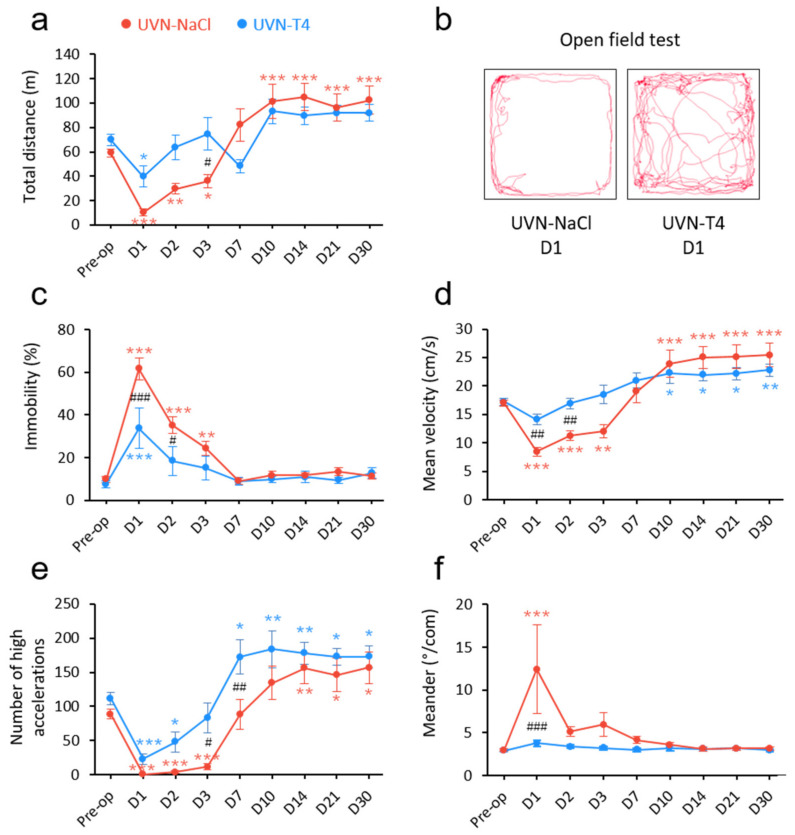
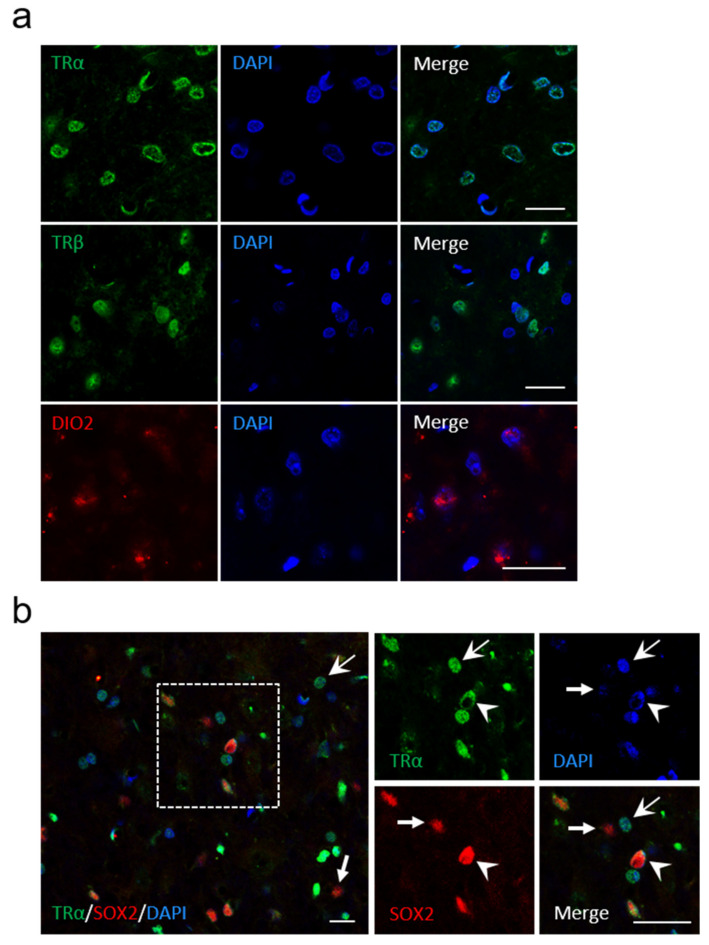
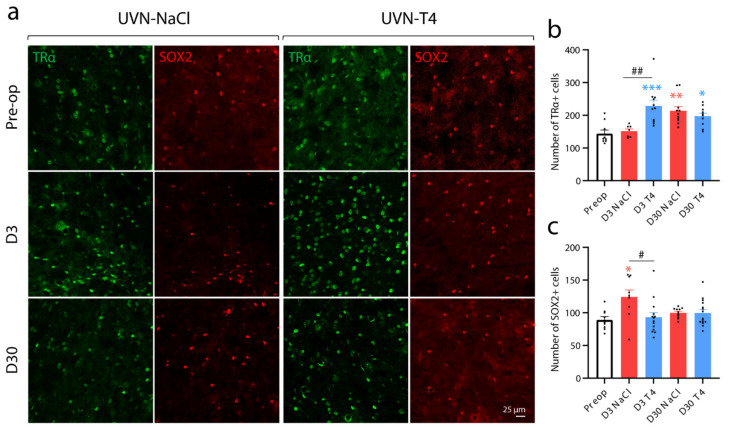
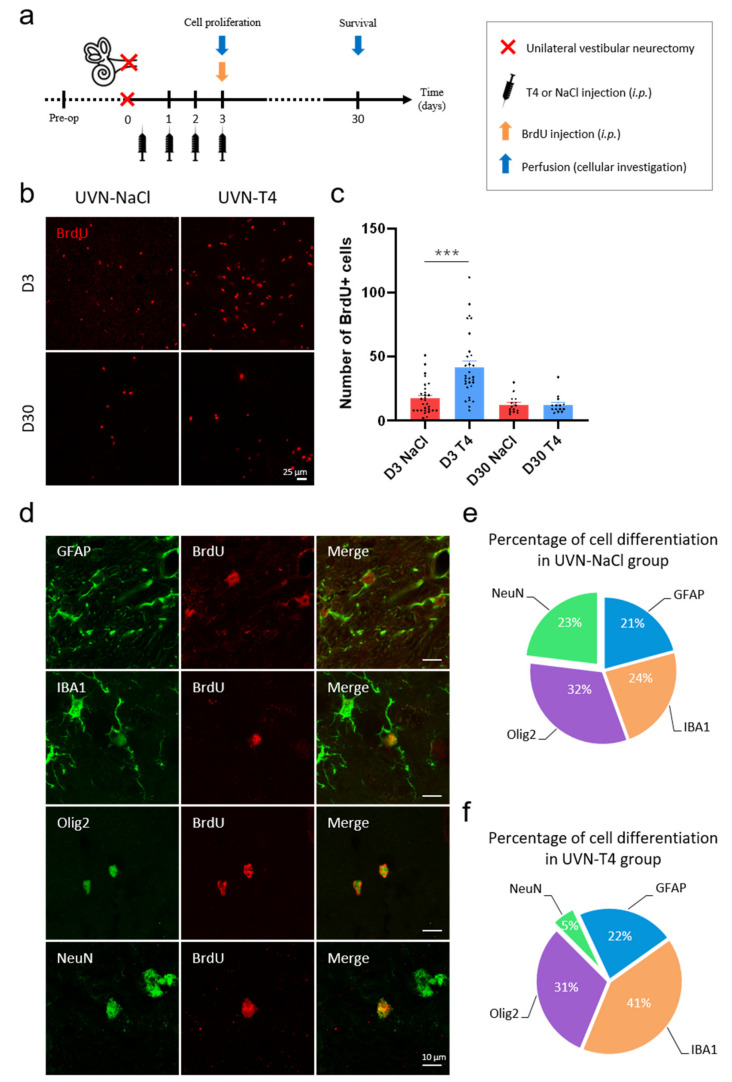
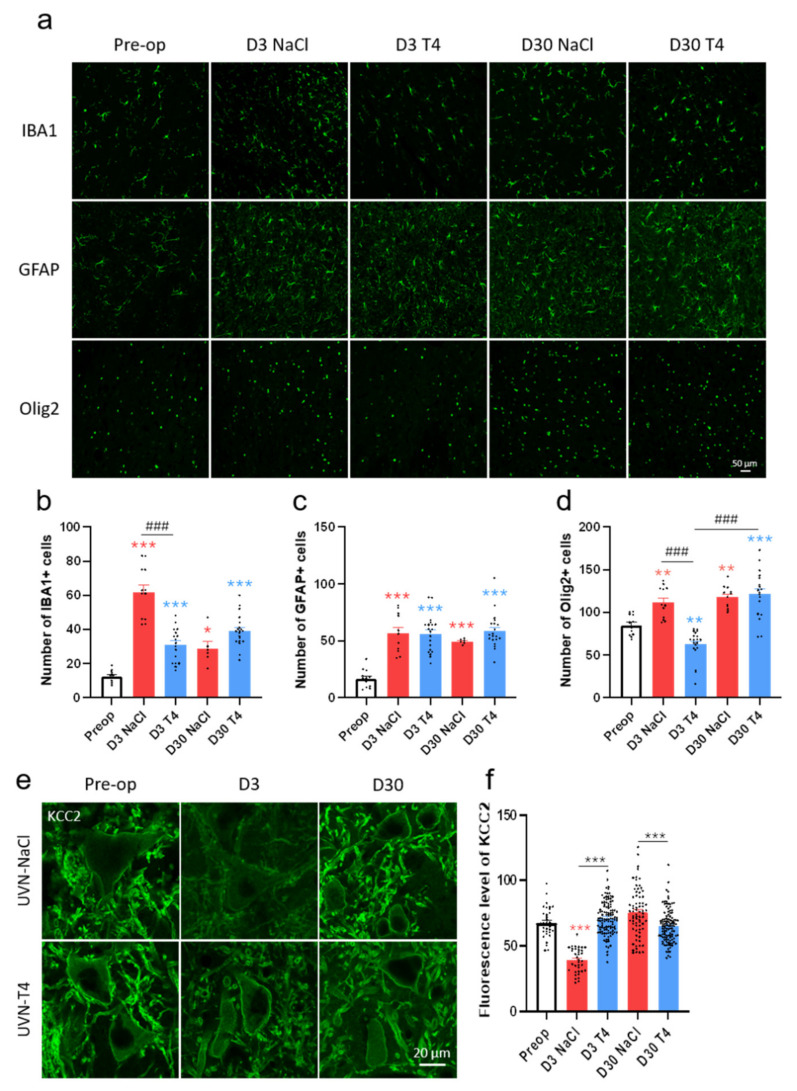
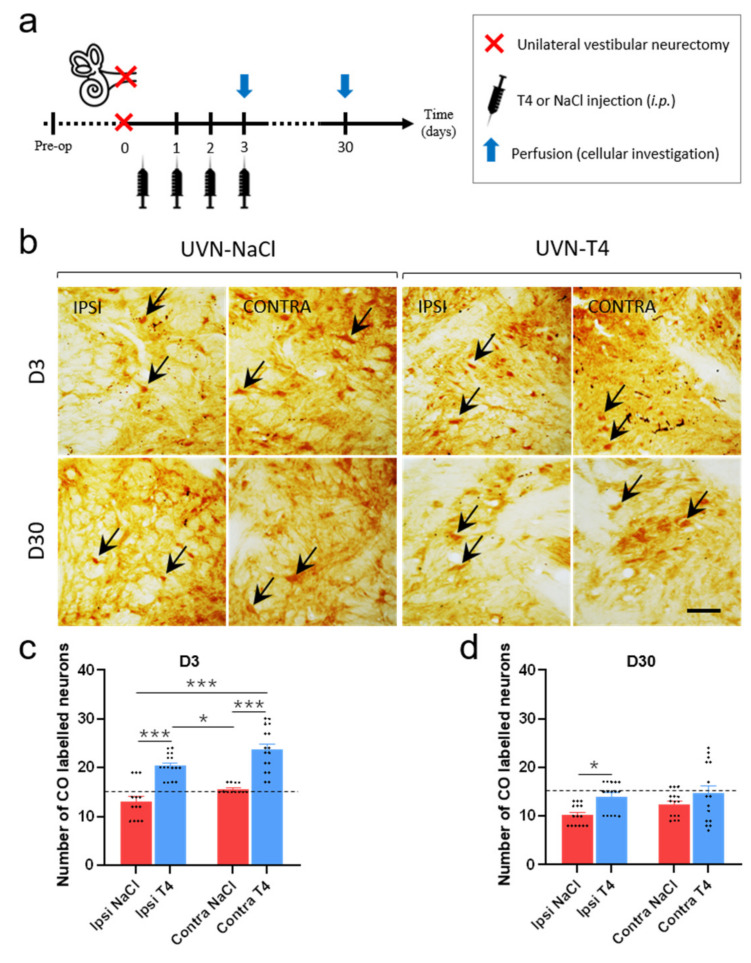
Unilateral vestibular lesions induce a vestibular syndrome, which recovers over time due to vestibular compensation. The therapeutic effect of L-Thyroxine (L-T4) on vestibular compensation was investigated by behavioral testing and immunohistochemical analysis in a rat model of unilateral vestibular neurectomy (UVN). We demonstrated that a short-term L-T4 treatment reduced the vestibular syndrome and significantly promoted vestibular compensation. Thyroid hormone receptors (TRα and TRβ) and type II iodothyronine deiodinase (DIO2) were present in the vestibular nuclei (VN), supporting a local action of L-T4. We confirmed the T4-induced metabolic effects by demonstrating an increase in the number of cytochrome oxidase-labeled neurons in the VN three days after the lesion. L-T4 treatment modulated glial reaction by decreasing both microglia and oligodendrocytes in the deafferented VN three days after UVN and increased cell proliferation. Survival of newly generated cells in the deafferented vestibular nuclei was not affected, but microglial rather than neuronal differentiation was favored by L-T4 treatment.

Keywords: brain metabolism; microglial reaction; neurogenesis; thyroid hormones; vertigo pharmacology; vestibular compensation; vestibular nuclei.


Conflict of interest statement

The authors declare no conflict of interest.

Figures

Figure 1
Figure 1
L-T4 treatment accelerates recovery from UVN-induced postural alterations. (a) Study design used to assess the behavioral effects of acute L-thyroxine (L-T4) treatment after unilateral vestibular neurectomy (UVN). UVN-T4 group received L-T4 injections (10 µg/kg dissolved in saline, i.p.) and UVN-NaCl group received 0.9% NaCl (vehicle, in equivalent volume, i.p.) at the end of the UVN and one injection/day during the first 3 days post-lesion. (b) Curves illustrating the time course (on the abscissae) of the vestibular syndrome (vestibular score on the ordinates) of UVN-NaCl (red) and UVN-T4 (blue) groups. (c) Curves indicating the mean post-operative recovery of the support surface of UVN-NaCl and UVN-T4 groups. (d) Histograms illustrating the weight distribution on the lateral axis of UVN-NaCl and UVN-T4 groups. Error bars represent SEM. A significant difference from the pre-operative value is indicated by * in red for UVN-NaCl group. A significant difference from the pre-operative value is indicated by * in blue for UVN-T4 group. A significant difference between UVN-NaCl (n = 8) and UVN-T4 (n = 7) group is indicated with # in black (* p < 0.05, ** p < 0.01, *** p < 0.001; repeated measure two-way ANOVA and Bonferroni’s post hoc tests).
Figure 2
Figure 2
L-T4 treatment accelerates recovery from UVN-induced locomotor alterations. (a) Curve illustrating the mean post-operative recovery of the total distance moved by UVN-NaCl and UVN-T4 rats in the open field. (b) Video-tracked path of a UVN-NaCl and a UVN-T4 rat one day after UVN in the open field over a 10 min period. (c) Curves illustrating the kinetics of the percentage of time when the animal is immobile of UVN-NaCl (red) and UVN-T4 (blue) groups. (d) Curves illustrating the kinetics of the mean velocity (cm/s) of the animals (calculated from the center-point) of UVN-NaCl and UVN-T4 groups. (e) Curves illustrating the kinetics of the mean number of high accelerations (above 50 cm/s2) of the animals (calculated from the center point) of UVN-NaCl and UVN-T4 groups. (f) Curves illustrating the mean post-operative recovery of meander (sinuous trajectory) in the UVN-NaCl and UVN-T4 groups. Error bars represent SEM. A significant difference from the pre-operative value is indicated by * in red for UVN-NaCl group. A significant difference from the pre-operative value is indicated by * in blue for UVN-T4 group. A significant difference between UVN-NaCl (n = 8) and UVN-T4 (n = 7) group is indicated with # in black (* p < 0.05, ** p < 0.01, *** p < 0.001; repeated measure two-way ANOVA and Bonferroni’s post hoc tests).
Figure 3
Figure 3
Presence of TRα, TRβ and Dio2 in the vestibular nuclei of control rats. (a) confocal immunostaining images confirming the presence of TRα (green), TRβ (green), and Dio2 (red) in the vestibular nuclei of control animals (without UVN). (b) Colocalization of TRα (green), SOX2 (red), and DAPI (blue) if cells in the vestibular nuclei. Head arrows indicate TRαPL/SOX2+/DAPI+ cells, arrows with tail indicate TRα+/SOX2/DAPI+ cells, and small arrows with a tail indicate TRα/SOX2+/DAPI+ cells. Scale bar = 20 µm.
Figure 4
Figure 4
L-T4 treatment prevents the positive regulation of SOX2+ cells and increased the number of TRα+ cells three days after UVN in the deafferented medial vestibular nucleus. (a) Confocal immunostaining images of TRα+ (green) and SOX2+ (red) cells in the deafferented medial vestibular nucleus (MVN) before the lesion (pre-op), three days (D3) or thirty days (D30) after UVN for UVN-NaCl and UVN-T4 groups. (b) Quantitative assessment of the effect of UVN and L-T4 treatment on the number of TRα+ cells in the deafferented MVN. (c) Quantitative assessment of the effect of UVN and L-T4 treatment on the number of SOX2+ cells in the deafferented MVN. Error bars represent SEM. A significant difference from the pre-operative value is indicated by * in red for UVN-NaCl group. A significant difference from the pre-operative value is indicated by * in blue for UVN-T4 group. A significant difference between UVN-NaCl and UVN-T4 group is indicated with # in black (* p < 0.05, ** p < 0.01, *** p < 0.001; one-way ANOVA and Tuckey’s post hoc tests). Scale bar = 25 µm.
Figure 5
Figure 5
L-T4 treatment modulates cell proliferation and neurogenesis after UVN. (a) Study design used to assess cell proliferation and survival of the newly generated cells after unilateral vestibular neurectomy (UVN) and L-thyroxine (L-T4) treatment. UVN-T4 group received L-T4 injections (10 µg/kg, i.p.) and the UVN-NaCl group received 0.9% NaCl (vehicle, in equivalent volume, i.p.) at the end of the UVN and one injection/day during the first 3 days post-lesion. At day 3, animals received a BrdU injection (200 mg/kg, i.p.) and were perfused either 3 h later to evaluate cell proliferation, or on day 30, to investigate survival and differentiation of the newly generated cells. (b) Confocal immunostaining images of BrdU+ cells in the deafferented medial vestibular nucleus (MVN) before the lesion (pre-op), three days (D3) and thirty days (D30) after UVN for UVN-NaCl and UVN-T4 groups. Scale bar = 25 µm. (c) Quantitative assessment of the effect of UVN and L-T4 treatment on the number of BrdU+ cells in the deafferented MVN of UVN-NaCl (red, n = 4/delay) and UVN-T4 (blue, n = 4/delay) groups. (*** p < 0.001; one-way ANOVA and Tuckey’s post hoc tests). (d) Maximum intensity projection of Z-stack confocal images of cell differentiation evaluated in the deafferented MVN 30 days after UVN. The BrdU nuclei are in red, and the other markers of differentiation are: GFAP (astrocyte), IBA1 (microglia), Olig2 (oligodendrocytes), and NeuN (neuron) are in green. Scale bar = 10 µm. (e,f) Proportions of new neurons (green), astrocytes (blue), microglia (orange), and oligodendrocytes (purple) generated in the deafferented MVN of the UVN-NaCl (e) and UVN-T4 (f) groups 30 days after the lesion.
Figure 6
Figure 6
L-T4 treatment modulates glial reaction in the deafferented medial vestibular nucleus after UVN. (a) Confocal immunostaining images of IBA1+, GFAP+, and Olig2+ cells in the deafferented medial vestibular nucleus (MVN) before the lesion (pre-op), three days (D3), and thirty days (D30) after unilateral vestibular neurectomy (UVN) for UVN-NaCl and UVN-T4 groups. Scale bar = 50 µm. (bd) Quantitative assessment of the effect of UVN and L-T4 treatment on the number of IBA1+ (b), GFAP+ (c), and Olig2+ (d) cells in the deafferented MVN of UVN-NaCl (red, n = 4/delay) and UVN-T4 (blue, n = 4/delay) groups. (e) Confocal immunostaining images in the deafferented lateral vestibular nucleus showing the KCC2 staining (green) in vestibular neurons of UVN-NaCl and UVN-T4 groups, observed prior to lesioning (pre-op, n = 4), D3 (n = 4) and D30 (n = 4) after UVN. (f) Quantification of the density of membrane labeling in vestibular neurons of intact rats and in UVN-NaCl (red) and UVN-T4 (blue) groups at either D3 or D30 after UVN. Scale bar = 20 µm. Error bars represent SEM. A significant difference from the pre-operative value is indicated by * in red for UVN-NaCl group. A significant difference from the pre-operative value is indicated by * in blue for UVN-T4 group. A significant difference between UVN-NaCl and UVN-T4 group is indicated with # in black (* p < 0.05, ** p < 0.01, *** p < 0.001; One-way ANOVA and Tuckey’s post hoc tests).
Figure 7
Figure 7
L-T4 treatment after UVN enhances metabolic activity in the vestibular nuclei. (a) Study design used to assess cellular consequences of acute L-thyroxine (L-T4) treatment after unilateral vestibular neurectomy (UVN). UVN-T4 group received L-T4 injections (10 µg/kg, i.p.) and UVN-NaCl group received 0.9% NaCl (vehicle, in equivalent volume, i.p.) at the end of the UVN and one injection/day during the first 3 days post-lesion. Animals were perfused either at an acute stage of vestibular compensation (3 h after the BrdU injection on day 3) or at a compensated stage (on day 30). (b) Illustrations of cytochrome oxidase (CO) enzymatic labeling in the lateral vestibular nucleus (LVN) of the UVN-NaCl (n = 4/delay) and UVN-T4 (n = 4/delay) groups observed at three days (D3) and thirty days (D30) after unilateral vestibular neurectomy (UVN). Illustrations are shown on both the contralesional and ipsilesional (deafferented) side. (cd) Quantitative assessment of the effect of UVN and L-T4 treatment on the number of CO-labeled neurons in the LVN at D3 (c) or D30 (d). Dashed line represents the pre-operative value of the number of CO-labeled neurons in the LVN. Error bars represent SEM. A significant difference between UVN-NaCl and UVN-T4 group is indicated with * in black (* p < 0.05, *** p < 0.001; one-way ANOVA and Tuckey’s post hoc tests). Black arrows indicate example of CO+ neurons. Scale bar = 25 µm.

References

    1. Curthoys I.S. Vestibular Compensation and Substitution. Curr. Opin. Neurol. 2000;13:27. doi: 10.1097/00019052-200002000-00006. - DOI - PubMed
    1. Dutia M.B. Mechanisms of Vestibular Compensation: Recent Advances. Curr. Opin. Otolaryngol. Head Neck Surg. 2010;18:420–424. doi: 10.1097/MOO.0b013e32833de71f. - DOI - PubMed
    1. Lacour M., Tighilet B. Plastic Events in the Vestibular Nuclei during Vestibular Compensation: The Brain Orchestration of a "Deafferentation" Code. Restor. Neurol. Neurosci. 2010;28:19–35. doi: 10.3233/RNN-2010-0509. - DOI - PubMed
    1. Tighilet B., Leonard J., Mourre C., Chabbert C. Apamin Treatment Accelerates Equilibrium Recovery and Gaze Stabilization in Unilateral Vestibular Neurectomized Cats: Cellular and Behavioral Aspects. Neuropharmacology. 2019;144:133–142. doi: 10.1016/j.neuropharm.2018.10.029. - DOI - PubMed
    1. Dutheil S., Brezun J.M., Leonard J., Lacour M., Tighilet B. Neurogenesis and Astrogenesis Contribution to Recovery of Vestibular Functions in the Adult Cat Following Unilateral Vestibular Neurectomy: Cellular and Behavioral Evidence. Neuroscience. 2009;164:1444–1456. doi: 10.1016/j.neuroscience.2009.09.048. - DOI - PubMed

Publication types

LinkOut - more resources