. 2022 Feb 16;11(4):701.
doi: 10.3390/cells11040701.

Mitofusin-2 Negatively Regulates Melanogenesis by Modulating Mitochondrial ROS Generation

Affiliations

Mitofusin-2 Negatively Regulates Melanogenesis by Modulating Mitochondrial ROS Generation

Jyoti Tanwar et al. Cells. .

Abstract

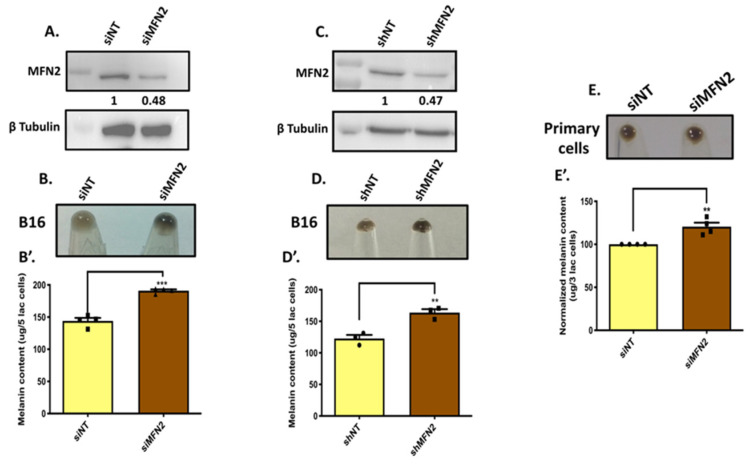
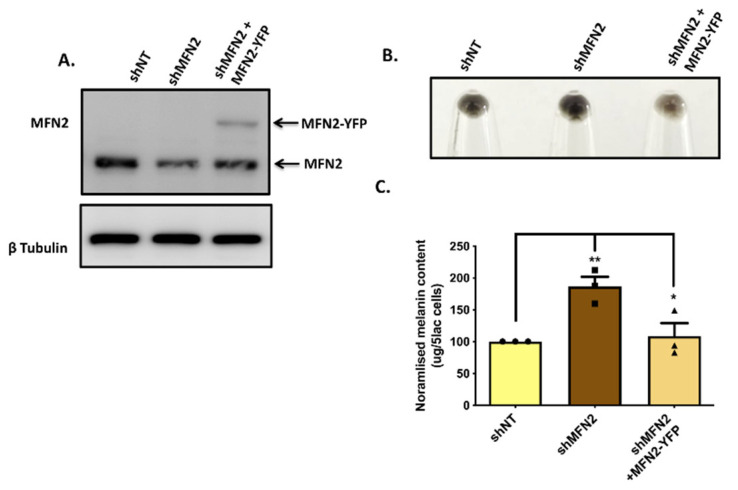
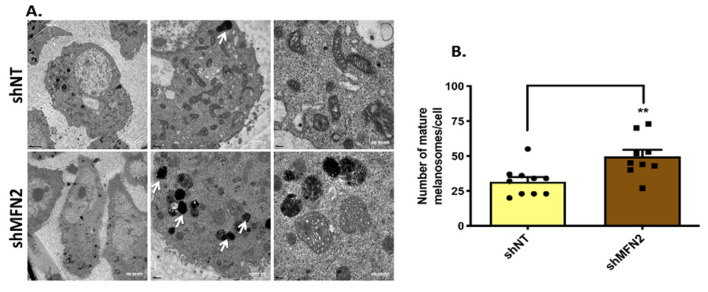
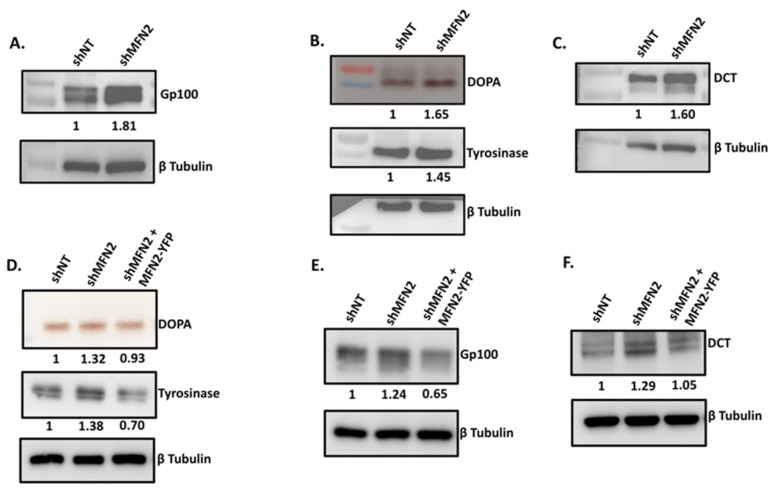
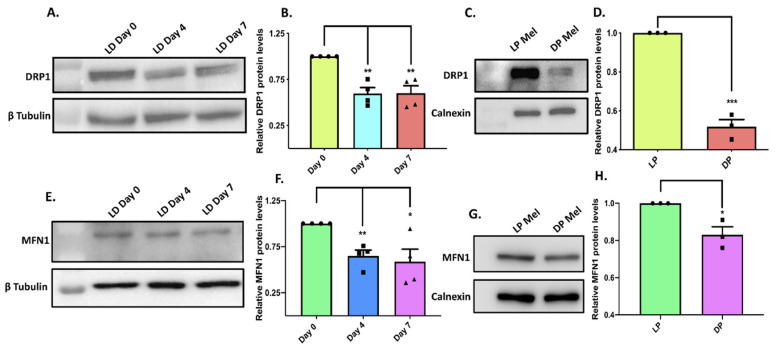
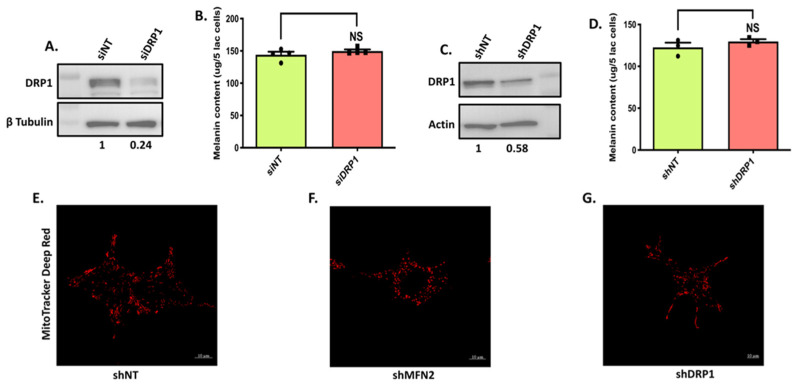
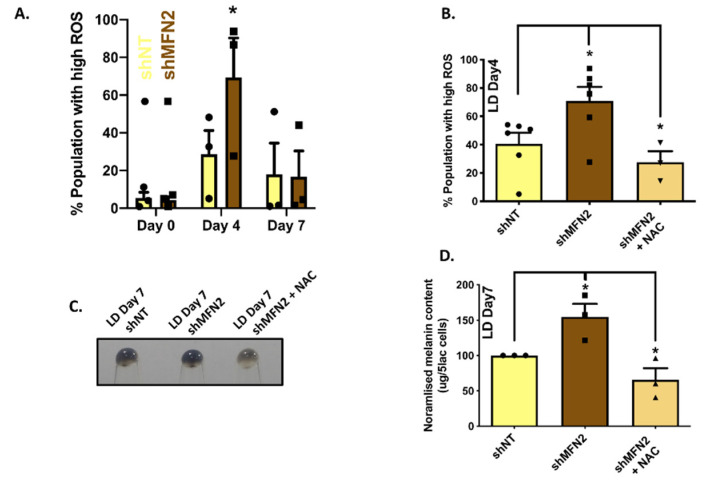
Inter-organellar communication is emerging as one of the most crucial regulators of cellular physiology. One of the key regulators of inter-organellar communication is Mitofusin-2 (MFN2). MFN2 is also involved in mediating mitochondrial fusion-fission dynamics. Further, it facilitates mitochondrial crosstalk with the endoplasmic reticulum, lysosomes and melanosomes, which are lysosome-related organelles specialized in melanin synthesis within melanocytes. However, the role of MFN2 in regulating melanocyte-specific cellular function, i.e., melanogenesis, remains poorly understood. Here, using a B16 mouse melanoma cell line and primary human melanocytes, we report that MFN2 negatively regulates melanogenesis. Both the transient and stable knockdown of MFN2 leads to enhanced melanogenesis, which is associated with an increase in the number of mature (stage III and IV) melanosomes and the augmented expression of key melanogenic enzymes. Further, the ectopic expression of MFN2 in MFN2-silenced cells leads to the complete rescue of the phenotype at the cellular and molecular levels. Mechanistically, MFN2-silencing elevates mitochondrial reactive-oxygen-species (ROS) levels which in turn increases melanogenesis. ROS quenching with the antioxidant N-acetyl cysteine (NAC) reverses the MFN2-knockdown-mediated increase in melanogenesis. Moreover, MFN2 expression is significantly lower in the darkly pigmented primary human melanocytes in comparison to lightly pigmented melanocytes, highlighting a potential contribution of lower MFN2 levels to higher physiological pigmentation. Taken together, our work establishes MFN2 as a novel negative regulator of melanogenesis.

Keywords: MFN2; melanogenesis; melanosome; mitochondria; reactive oxygen species.


Conflict of interest statement

R.S.G. is Co-founder and Director on the Board of Vyome Biosciences Pvt. Ltd., a bio-pharmaceutical company working in the Dermatology area. M.D., U.S., M.J., S.M. and N.N. are employees of Unilever R and D.

Figures

Figure 1
Figure 1
MFN2 expression is inversely associated with pigmentation. (A). Representative pellet pictures of B16 cells on different days of LD pigmentation and MFN2-protein expression in the LD-pigmentation model (N = 4). (B) Densitometry quantitation of MFN2 levels during LD pigmentation (N = 4). (C) Representative pellet pictures of lightly pigmented (LP) and darkly pigmented (DP) primary human melanocytes and MFN2-protein expression in the LP-DP primary human melanocytes (N = 3). (D) Densitometry quantitation of MFN2 levels in LP-DP primary human melanocytes (N = 3). Data presented are mean ± S.E.M. (** p < 0.01; unpaired student’s t-test was performed for determining statistical significance between two experimental samples, whereas one-way ANOVA was performed for comparison of three samples).
Figure 2
Figure 2
MFN2 negatively regulates pigmentation. (A) Representative western blot confirming siRNA-based silencing of MFN2 in B16 cells (N = 4). The extent of silencing is quantitated by performing densitometric analysis using ImageJ and is presented below the blot. (B) Pellet pictures of siNon-Targeting (siNT) control and siMFN2 on LD day seven (N = 4). (B’) Melanin-content estimation of siNT and siMFN2 B16 cells on LD day seven (N = 4). (C) Representative western blot validating lentiviral-mediated, shRNA-based stable knockdown of MFN2 in B16 cells (N = 3). The knockdown is quantitated by performing densitometric analysis and is presented below the blot. (D) Pellet pictures of shNon-Targeting (shNT) control and shMFN2 on LD day seven (N = 3). (D’) Melanin-content estimation of shNT and shMFN2 B16 cells on LD day seven (N = 3). (E) Pellet pictures of lightly pigmented primary human melanocytes transfected with either siNT or siMFN2 (N = 4). (E’) Melanin-content estimation of lightly pigmented primary human melanocytes transfected with either siNT or siMFN2 (N = 4). Data presented are mean ± S.E.M. (*** p < 0.001; ** p < 0.01; unpaired student’s t-test was performed for statistical analysis).
Figure 3
Figure 3
MFN2 rescue reverses pigmentation phenotype. (A) Representative western blot demonstrating ectopic expression of YFP-tagged human MFN2 in stable shMFN2 B16 cells. (B) Pellet pictures of shNT, shMFN2 and shMFN2 plus MFN2–YFP cells on LD day six (N = 3). (C) Melanin-content estimation of shNT, shMFN2 and shMFN2 plus MFN2–YFP B16 cells on LD day six (N = 3). Data presented are mean ± S.E.M. (* p < 0.05; ** p < 0.01; one-way ANOVA was performed was performed for statistical analysis).
Figure 4
Figure 4
MFN2 controls melanosome maturation. (A) TEM images of shNT and stable shMFN2 B16 cells. White arrows correspond to melanin-rich mature (stage three and four) melanosomes in these cells on LD day seven. (B) Quantification of number of mature melanosomes/cells in shNT and stable shMFN2 cells on LD day seven (N = 9 cells). Data presented are mean ± S.E.M. (** p < 0.01; unpaired student’s t-test was performed for statistical analysis).
Figure 5
Figure 5
MFN2 regulates melanogenic enzyme expression. (A) Representative western blot showing expression of Gp100 shNT and stable shMFN2 cells on LD day seven (N = 3). (B) DOPA assay showing activity of tyrosinase enzyme and western blot for tyrosinase expression in shNT and stable shMFN2 cells on LD day seven (N = 3). (C) Representative western blot showing expression of DCT in shNT and stable shMFN2 cells on LD day seven (N = 3). (D) DOPA assay showing activity of tyrosinase enzyme and western blot for tyrosinase expression in shNT, shMFN2 and shMFN2 plus MFN2–YFP cells on LD day six (N = 3). (E) Representative western blot showing expression of Gp100 in shNT, shMFN2 and shMFN2 plus MFN2–YFP cells on LD day six (N = 3). (F) Representative western blot showing expression of DCT in shNT, shMFN2 and shMFN2 plus MFN2–YFP cells on LD day six (N = 3). The activity and expression of the key melanogenic proteins was quantitated by performing densitometric analysis using ImageJ and is presented below the gels/blots.
Figure 6
Figure 6
DRP1 and MFN1 expression decreases with pigmentation. (A) Representative western blot showing DRP1-protein expression in the LD-pigmentation model (N = 4). (B) Densitometric quantitation of DRP1 levels during LD pigmentation (N = 4). (C) Representative blot showing DRP1-protein expression in the LP-DP primary human melanocytes (N = 3). (D) Densitometric quantitation of DRP1 levels in LP-DP primary human melanocytes (N = 3). (E) Representative western blot showing MFN1 protein expression in the LD-pigmentation model (N = 4). (F) Densitometric quantitation of MFN1 levels during LD pigmentation (N = 4). (G) Representative blot showing MFN1 protein expression in the LP-DP primary human melanocytes (N = 3). (H) Densitometric quantitation of DRP1 levels in LP-DP primary human melanocytes (N = 3). Data presented are mean ± S.E.M. (* p < 0.05; ** p < 0.01; *** p < 0.001 unpaired student’s t-test was performed for statistical analysis).
Figure 7
Figure 7
DRP1 does not regulate melanogenesis. (A) Representative western blot confirming siRNA-based silencing of DRP1 in B16 cells (N = 4). The extent of silencing is quantitated by performing densitometric analysis using ImageJ and is presented below the blot. (B) Melanin-content estimation of siNT and siDRP1 B16 cells on LD day seven (N = 4). (C) Representative western blot validating lentiviral-mediated shRNA-based stable knockdown of DRP1 in B16 cells (N = 3). The extent of DRP1 knockdown is quantitated by performing densitometric analysis and is presented below the blot. (D) Melanin-content estimation of shNT and shDRP1 B16 cells on LD day seven (N = 3). (EG) Representative confocal-microscopy images of shNT, shMFN2 and stable shDRP1 cells stained with MitoTracker Deep Red for examining mitochondrial shape (N = 20–25 cells/condition). Data presented are mean ± S.E.M. (NS means Not significant; unpaired student’s t-test was performed for statistical analysis).
Figure 8
Figure 8
MFN2 regulates melanogenesis by modulating ROS levels. (A) Estimation of ROS levels in shNT and shMFN2 cells during LD-pigmentation model (N = 3). (B) ROS estimation in shNT- (N = 6), shMFN2- (N = 6) and shMFN2+NAC-treated cells (N = 3) on LD day four. (C) Pellet pictures of shNT-, shMFN2- and shMFN2+NAC-treated cells on LD day seven (N = 3). (D) Melanin-content estimation of shNT-, shMFN2- and shMFN2+NAC-treated cells on LD day seven (N = 3). Data presented are mean ± S.E.M. (* p < 0.05; one-way ANOVA was performed was performed for statistical analysis).

References

    1. Daniele T., Schiaffino M.V. Organelle biogenesis and interorganellar connections: Better in contact than in isolation. Commun. Integr. Biol. 2014;7:e29587. doi: 10.4161/cib.29587. - DOI - PMC - PubMed
    1. Sharma N., Arora S., Saurav S., Motiani R.K. Pathophysiological Significance of Calcium Signaling at Mitochondria-Associated Endoplasmic Reticulum Membranes (MAMs) Curr. Opin. Physiol. 2020;17:234–242. doi: 10.1016/j.cophys.2020.08.012. - DOI
    1. Filadi R., Pendin D., Pizzo P. Mitofusin 2: From functions to disease. Cell Death Dis. 2018;9:330. doi: 10.1038/s41419-017-0023-6. - DOI - PMC - PubMed
    1. Soto-Heredero G., Baixauli F., Mittelbrunn M. Interorganelle Communication between Mitochondria and the Endolysosomal System. Front. Cell Dev. Biol. 2017;5:95. doi: 10.3389/fcell.2017.00095. - DOI - PMC - PubMed
    1. Gordaliza-Alaguero I., Cantó C., Zorzano A. Metabolic implications of organelle-mitochondria communication. EMBO Rep. 2019;20:e47928. doi: 10.15252/embr.201947928. - DOI - PMC - PubMed

Publication types

LinkOut - more resources