. 2022 Jan 19;10(2):214.
doi: 10.3390/biomedicines10020214.

Expression of the Adenosine A2A-A3 Receptor Heteromer in Different Brain Regions and Marked Upregulation in the Microglia of the Transgenic APPSw,Ind Alzheimer's Disease Model

Affiliations

Expression of the Adenosine A2A-A3 Receptor Heteromer in Different Brain Regions and Marked Upregulation in the Microglia of the Transgenic APPSw,Ind Alzheimer's Disease Model

Alejandro Lillo et al. Biomedicines. .

Abstract

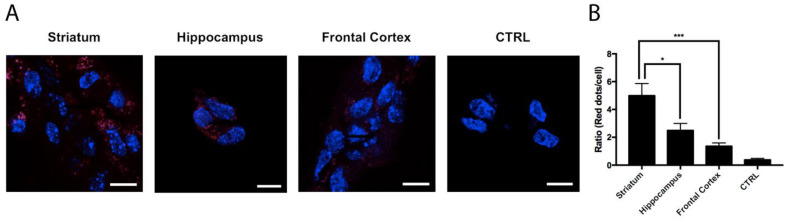
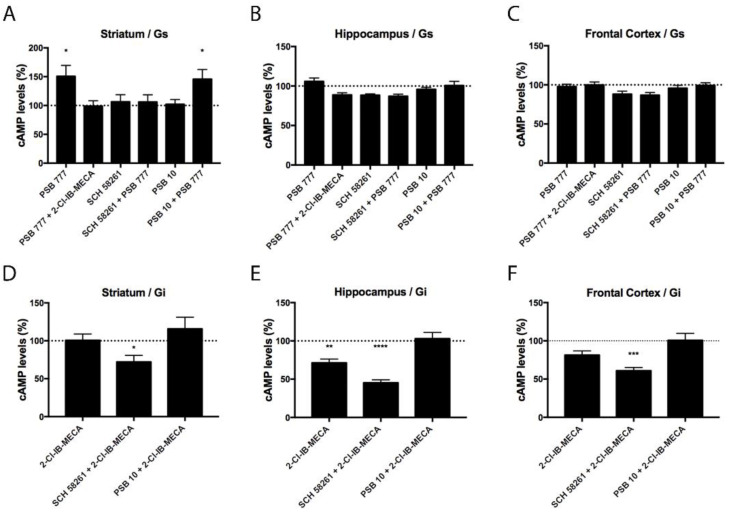
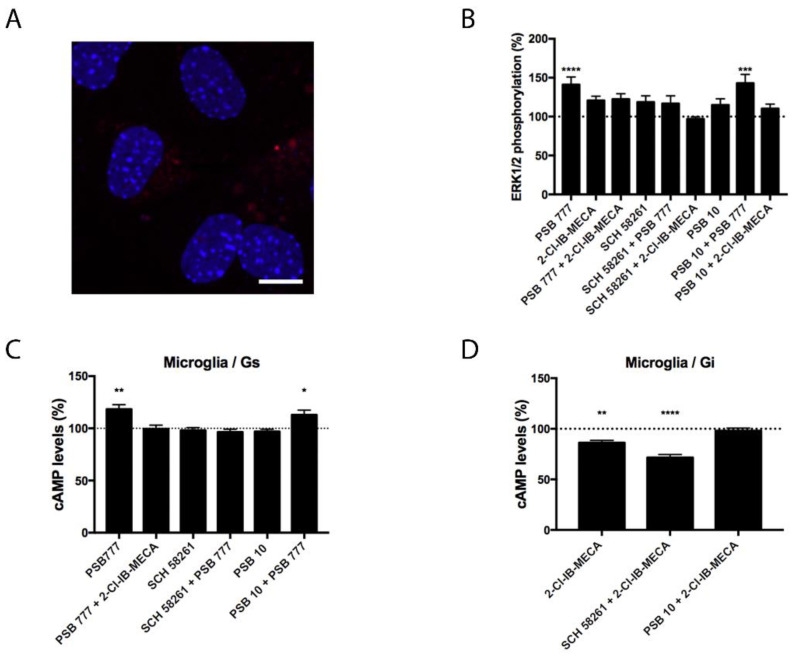
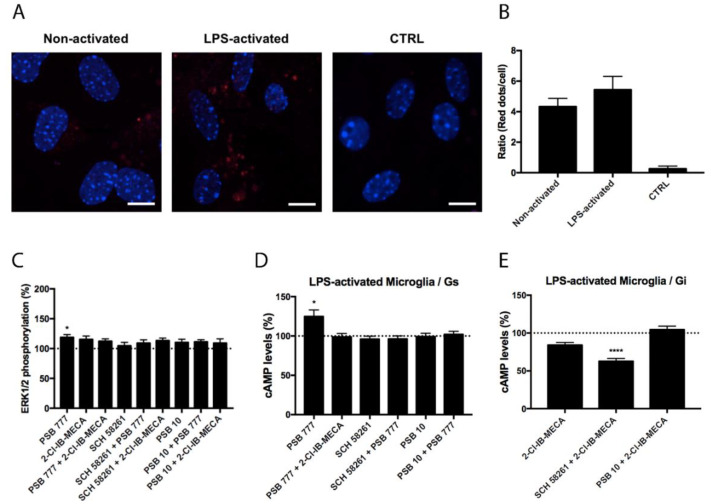
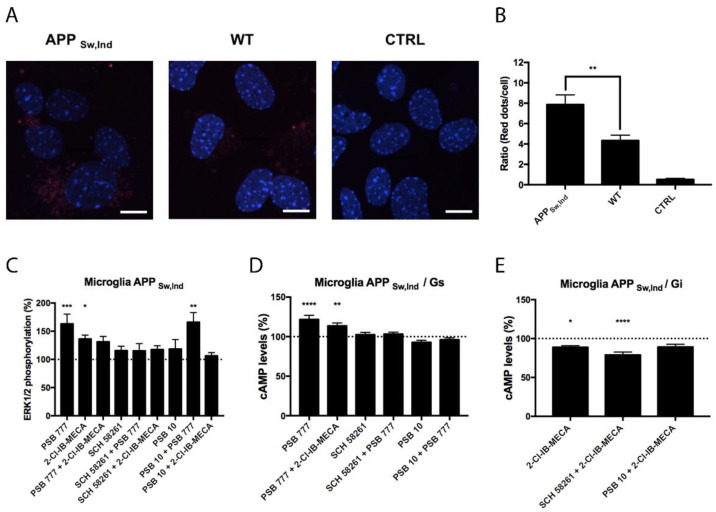
Adenosine (Ado) receptors have been instrumental in the detection of heteromers and other higher-order receptor structures, mainly via interactions with other cell surface G-protein-coupled receptors. Apart from the first report of the A1 Ado receptor interacting with the A2A Ado receptor, there has been more recent data on the possibility that every Ado receptor type, A1, A2A, A2B, and A3, may interact with each other. The aim of this paper was to look for the expression and function of the A2A/A3 receptor heteromer (A2AA3Het) in neurons and microglia. In situ proximity ligation assays (PLA), performed in primary cells, showed that A2AA3Het expression was markedly higher in striatal than in cortical and hippocampal neurons, whereas it was similar in resting and activated microglia. Signaling assays demonstrated that the effect of the A2AR agonist, PSB 777, was reduced in the presence of the A3R agonist, 2-Cl-IB-MECA, whereas the effect of the A3R agonist was potentiated by the A2AR antagonist, SCH 58261. Interestingly, the expression of the heteromer was markedly enhanced in microglia from the APPSw,Ind model of Alzheimer's disease. The functionality of the heteromer in primary microglia from APPSw,Ind mice was more similar to that found in resting microglia from control mice.

Keywords: G protein-coupled receptor; activated microglia; cerebral cortex; dementia; hippocampus; neurodegenerative disease; neuroinflammation; purinergic signaling; striatum.


Conflict of interest statement

The authors declare no conflict of interest. The funders had no role in the design of the study; in the collection, analyses, or interpretation of data; in the writing of the manuscript, or in the decision to publish the results.

Figures

Figure 1
Figure 1
Expression of A2AA3Hets in primary cultures of neurons isolated from the fetuses of pregnant C57BL/6J female mice. (A) A2AA3Hets were detected by the in situ proximity ligation assay (PLA) in primary cultures of striatal, hippocampal, and cortical neurons isolated from mouse fetuses. The negative control was obtained by omitting the primary antibody anti-A3R. Experiments were performed in samples from 6 different animals. (B) The number of red dots/cell was quantified using the Andy’s algorithm Fiji’s plug-in and represented versus the number of Hoechst-stained cell nuclei (blue). The number of red dots/cell was compared to those in neurons from different brain regions. The unpaired t-test was used for statistical analysis. * p < 0.05, *** p < 0.001. Scale bar: 10 μm.
Figure 2
Figure 2
A2AA3Het-mediated Gs/Gi signaling in primary striatal, hippocampal, and cortical neurons from C57BL/6J mice. (AF) Primary neurons were pre-treated with selective antagonists, 1 μM SCH 58261 -A2AR- or 1 μM PSB 10 -A3R-, and subsequently treated with the selective agonists, 100 nM PSB 777 -A2AR- or 100 nM 2-Cl-IB-MECA -A3R-. cAMP levels after 500 nM forskolin (FK) stimulation or vehicle treatment were detected by the Lance Ultra cAMP kit and results were expressed in % respect to basal levels (AC) or in % respect to levels obtained upon FK stimulation (DF). The values are the mean ± S.E.M. of 6 different experiments performed in triplicates. One-way ANOVA followed by Bonferroni’s multiple comparison post-hoc test were used for statistical analysis. * p < 0.05, ** p < 0.01, *** p < 0.001, **** p < 0.0001; versus basal levels (AC) or versus FK treatment (DF).
Figure 3
Figure 3
Expression and function of A2AA3Hets in primary cultures of microglia from C57BL/6J mice. (A) A2AA3Hets were detected in primary cultures of microglia by the in situ proximity ligation assay (PLA) using specific antibodies. Cell nuclei were stained with Hoechst (blue). Samples from 5 different animals were processed and analyzed. Scale bar: 20 μm. (BD) Primary cultures of microglia from C57BL/6J mice were pre-treated with antagonists, 1 μM SCH 58261 -for A2AR- or 1 μM PSB 10 -for A3R-, subsequently stimulated with selective agonists, 100 nM PSB 777 -for A2AR- or 100 nM 2-Cl-IB-MECA -for A3R-, individually or in combination and treated with 500 nM forskolin (FK) or vehicle. (B) ERK1/2 phosphorylation was analyzed using an AlphaScreen® SureFire® kit (PerkinElmer) while cAMP levels were collected by the Lance Ultra cAMP kit and results were expressed in % respect to basal levels (B,C) or in % respect levels obtained upon 0.5 μM FK stimulation (D). Values are the mean ± S.E.M. of 10 different experiments performed in triplicates. One-way ANOVA followed by Bonferroni’s multiple comparison post-hoc tests were used for statistical analysis. * p < 0.05, ** p < 0.01, *** p < 0.001, **** p < 0.0001; versus basal (B,C) or versus FK treatment (D).
Figure 4
Figure 4
Expression and function of A2AA3Hets in primary cultures of LPS-activated microglia from C57BL/6J mice. (A) A2AA3Hets were detected in primary cultures of non-activated and LPS-activated microglia by the in situ proximity ligation assay (PLA) using specific antibodies. The negative control was obtained by omitting the primary anti-A3R antibody. Experiments were performed in samples from 5 different animals. (B) The number of red dots/cell was quantified using the Andy’s algorithm Fiji’s plug-in and represented versus the number of Hoechst-stained cell nuclei (blue). The number of red dots/cell was compared between non-activated and LPS-activated microglia. The unpaired t-test was used for statistical analysis. Scale bar: 20 μm. (CE) Primary cultures of LPS-activated microglia from C57BL/6J mice were pre-treated with antagonists, 1 μM SCH 58261 -for A2AR- or 1 μM PSB 10 -for A3R-, subsequently stimulated with selective agonists, 100 nM PSB 777 -for A2AR- or 100 nM 2-Cl-IB-MECA -for A3R-, individually or in combination and treated with 500 nM forskolin (FK) or vehicle. (C) ERK1/2 phosphorylation was analyzed using an AlphaScreen® SureFire® kit (PerkinElmer) while cAMP levels were collected by the Lance Ultra cAMP kit and results were expressed in % respect to basal levels (C,D) or in % respect to levels obtained upon 0.5 μM FK stimulation (E). Values are the mean ± S.E.M. of 6 different experiments performed in triplicates. One-way ANOVA followed by Bonferroni’s multiple comparison post-hoc tests were used for statistical analysis. * p < 0.05, **** p < 0.0001; versus basal (C,D) or versus FK treatment (E).
Figure 5
Figure 5
Expression and function of A2AA3Hets in primary cultures of microglia from the APPSw,Ind mice model of Alzheimer’s disease. (A) A2AA3Hets were detected in primary cultures of APPSw,Ind microglia by the in situ proximity ligation assay (PLA) using specific antibodies. The negative control was obtained by omitting the primary anti-A3R antibody. Experiments were performed in samples from 12 different animals. (B) The number of red dots/cell was quantified using the Andy’s algorithm Fiji’s plug-in and represented versus the number of Hoechst-stained cell nuclei (blue). The number of red dots/cell was compared to those in microglia from wild type (WT) mice. The unpaired t-test was used for statistical analysis. ** p < 0.01, versus WT. Scale bar: 20 μm. (CE) Primary cultures of microglia from APPSw,Ind mice were pre-treated with antagonists, 1 μM SCH 58261 -for A2AR- or 1 μM PSB 10 -for A3R-, and subsequently stimulated with selective agonists, 100 nM PSB 777 -for A2AR- or 100 nM 2-Cl-IB-MECA -for A3R-, individually or in combination. (C) ERK1/2 phosphorylation was analyzed using an AlphaScreen® SureFire® kit (PerkinElmer) while cAMP levels were collected by the Lance Ultra cAMP kit and results were expressed in % respect to basal levels (C,D) or in % respect levels obtained upon 0.5 μM FK stimulation (E). Values are the mean ± S.E.M. of 6 different experiments performed in triplicates. One-way ANOVA followed by Bonferroni’s multiple comparison post-hoc tests were used for statistical analysis. * p < 0.05, ** p < 0.01, *** p < 0.001, **** p < 0.0001; versus basal (C,D) or versus FK treatment (E).

Similar articles

Cited by

References

    1. Alexander S.P., Christopoulos A., Davenport A.P., Kelly E., Mathie A., Peters J.A., Veale E.L., Armstrong J.F., Faccenda E., Harding S.D., et al. The Concise Guide To Pharmacology 2021/22: G Protein-Coupled Receptors. Br. J. Pharmacol. 2021;178:S27–S156. doi: 10.1111/bph.15538. - DOI - PubMed
    1. Gines S., Hillion J., Torvinen M., Le Crom S., Casado V., Canela E.I., Rondin S., Lew J.Y., Watson S., Zoli M., et al. Dopamine D1 and Adenosine A1 Receptors form Functionally Interacting Heteromeric Complexes. Proc. Natl. Acad. Sci. USA. 2000;97:8606–8611. doi: 10.1073/pnas.150241097. - DOI - PMC - PubMed
    1. Hillion J., Canals M., Torvinen M., Casado V., Scott R., Terasmaa A., Hansson A., Watson S., Olah M.E., Mallol J., et al. Coaggregation, Cointernalization, and Codesensitization of Adenosine A2A Receptors and Dopamine D2 Receptors. [(accessed on 21 March 2015)];J. Biol. Chem. 2002 277:18091–18097. doi: 10.1074/jbc.M107731200. Available online: http://www.ncbi.nlm.nih.gov/pubmed/11872740. - DOI - PubMed
    1. Ciruela F., Casadó V., Rodrigues R., Luján R., Burgueño J., Canals M., Borycz J., Rebola N., Goldberg S., Mallol J., et al. Presynaptic Control of Striatal Glutamatergic Neurotransmission by Adenosine A1-A2A Receptor Heteromers. J. Neurosci. 2006;26:2080–2087. doi: 10.1523/JNEUROSCI.3574-05.2006. - DOI - PMC - PubMed
    1. Navarro G., Cordomí A., Brugarolas M., Moreno E., Aguinaga D., Pérez-Benito L., Ferre S., Cortés A., Casadó V., Mallol J., et al. Cross-Communication between Gi and Gs in a G-Protein-Coupled Receptor Heterotetramer Guided by a Receptor C-Terminal Domain. BMC Biol. 2018;16:1–15. doi: 10.1186/s12915-018-0491-x. - DOI - PMC - PubMed

LinkOut - more resources