

Systemic Inflammatory Biomarkers Define Specific Clusters in Patients with Bronchiectasis: A Large-Cohort Study
- PMID: 35203435
- PMCID: PMC8869143
- DOI: 10.3390/biomedicines10020225
Systemic Inflammatory Biomarkers Define Specific Clusters in Patients with Bronchiectasis: A Large-Cohort Study
Abstract
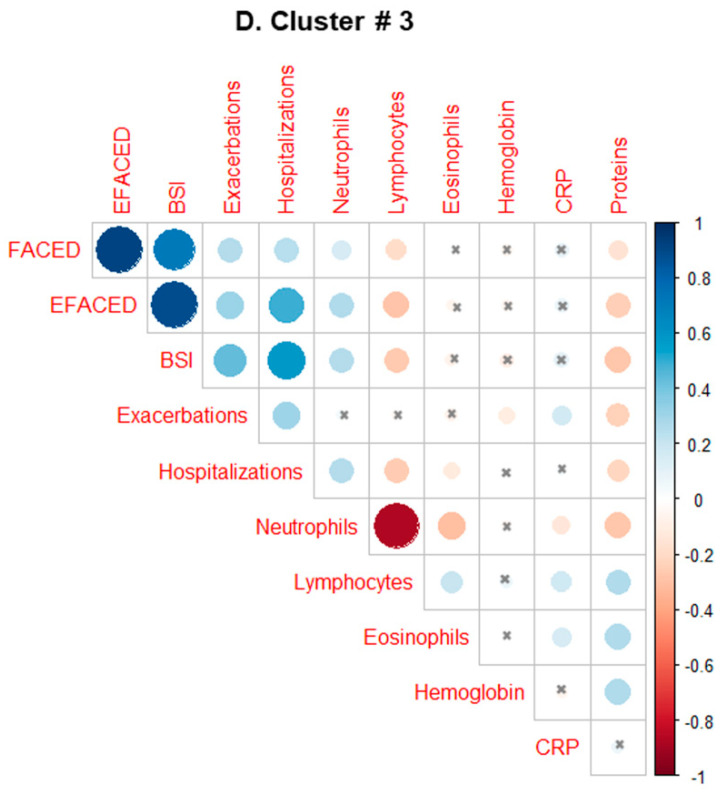
Differential phenotypic characteristics using data mining approaches were defined in a large cohort of patients from the Spanish Online Bronchiectasis Registry (RIBRON). Three differential phenotypic clusters (hierarchical clustering, scikit-learn library for Python, and agglomerative methods) according to systemic biomarkers: neutrophil, eosinophil, and lymphocyte counts, C reactive protein, and hemoglobin were obtained in a patient large-cohort (n = 1092). Clusters #1-3 were named as mild, moderate, and severe on the basis of disease severity scores. Patients in cluster #3 were significantly more severe (FEV1, age, colonization, extension, dyspnea (FACED), exacerbation (EFACED), and bronchiectasis severity index (BSI) scores) than patients in clusters #1 and #2. Exacerbation and hospitalization numbers, Charlson index, and blood inflammatory markers were significantly greater in cluster #3 than in clusters #1 and #2. Chronic colonization by Pseudomonas aeruginosa and COPD prevalence were higher in cluster # 3 than in cluster #1. Airflow limitation and diffusion capacity were reduced in cluster #3 compared to clusters #1 and #2. Multivariate ordinal logistic regression analysis further confirmed these results. Similar results were obtained after excluding COPD patients. Clustering analysis offers a powerful tool to better characterize patients with bronchiectasis. These results have clinical implications in the management of the complexity and heterogeneity of bronchiectasis patients.
Keywords: C reactive protein; blood neutrophil; clinical outcomes; disease severity scores; eosinophil; hemoglobin; hierarchical clustering; lymphocyte counts; multivariate analyses; non-cystic fibrosis bronchiectasis; phenotypic clusters.
Conflict of interest statement
The authors declare no conflict of interest.
Figures


Similar articles
-
Blood Neutrophil Counts Define Specific Clusters of Bronchiectasis Patients: A Hint to Differential Clinical Phenotypes.Biomedicines. 2022 Apr 30;10(5):1044. doi: 10.3390/biomedicines10051044. Biomedicines. 2022. PMID: 35625780 Free PMC article.
-
Phenotypic Clustering in Non-Cystic Fibrosis Bronchiectasis Patients: The Role of Eosinophils in Disease Severity.Int J Environ Res Public Health. 2021 Aug 10;18(16):8431. doi: 10.3390/ijerph18168431. Int J Environ Res Public Health. 2021. PMID: 34444179 Free PMC article.
-
The Bronchiectasis Severity Index and FACED score for assessment of the severity of bronchiectasis.Pulmonology. 2018 May/June;24(3):149-154. doi: 10.1016/j.rppnen.2017.08.009. Epub 2018 Jan 3. Pulmonology. 2018. PMID: 29306672
-
Assessing effects of inhaled antibiotics in adults with non-cystic fibrosis bronchiectasis--experiences from recent clinical trials.Expert Rev Respir Med. 2018 Sep;12(9):769-782. doi: 10.1080/17476348.2018.1503540. Epub 2018 Aug 3. Expert Rev Respir Med. 2018. PMID: 30025482 Review.
-
Prognostic performance of the FACED score and bronchiectasis severity index in bronchiectasis: a systematic review and meta-analysis.Biosci Rep. 2020 Oct 30;40(10):BSR20194514. doi: 10.1042/BSR20194514. Biosci Rep. 2020. PMID: 33057706 Free PMC article.
Cited by
-
Chronic Obstructive Pulmonary Disease: The Present and Future.Biomedicines. 2022 Feb 20;10(2):499. doi: 10.3390/biomedicines10020499. Biomedicines. 2022. PMID: 35203708 Free PMC article.
-
Phenotypes and endotypes in bronchiectasis: a narrative review of progress toward precision medicine.J Thorac Dis. 2025 Apr 30;17(4):2640-2654. doi: 10.21037/jtd-2024-1945. Epub 2025 Apr 28. J Thorac Dis. 2025. PMID: 40400921 Free PMC article. Review.
-
Blood Neutrophil Counts Define Specific Clusters of Bronchiectasis Patients: A Hint to Differential Clinical Phenotypes.Biomedicines. 2022 Apr 30;10(5):1044. doi: 10.3390/biomedicines10051044. Biomedicines. 2022. PMID: 35625780 Free PMC article.
References
-
- Chalmers J.D., Aliberti S., Filonenko A., Shteinberg M., Goeminne P.C., Hill A.T., Fardon T.C., Obradovic D., Gerlinger C., Sotgiu G., et al. Characterization of the “frequent exacerbator phenotype” in bronchiectasis. Am. J. Respir. Crit. Care Med. 2018;197:1410–1420. doi: 10.1164/rccm.201711-2202OC. - DOI - PubMed
-
- Menéndez R., Méndez R., Amara-Elori I., Reyes S., Montull B., Feced L., Alonso R., Amaro R., Alcaraz V., Fernandez-Barat L., et al. Systemic Inflammation during and after Bronchiectasis Exacerbations: Impact of Pseudomonas aeruginosa. J. Clin. Med. 2020;9:2631. doi: 10.3390/jcm9082631. - DOI - PMC - PubMed
Grants and funding
LinkOut - more resources
Full Text Sources
Research Materials
