Disinhibition-Like Behavior Correlates with Frontal Cortex Damage in an Animal Model of Chronic Alcohol Consumption and Thiamine Deficiency
- PMID: 35203470
- PMCID: PMC8869694
- DOI: 10.3390/biomedicines10020260
Disinhibition-Like Behavior Correlates with Frontal Cortex Damage in an Animal Model of Chronic Alcohol Consumption and Thiamine Deficiency
Abstract
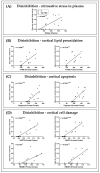
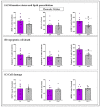
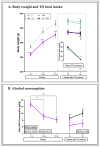
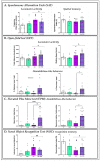
Wernicke-Korsakoff syndrome (WKS) is induced by thiamine deficiency (TD) and mainly related to alcohol consumption. Frontal cortex dysfunction has been associated with impulsivity and disinhibition in WKS patients. The pathophysiology involves oxidative stress, excitotoxicity and inflammatory responses leading to neuronal death, but the relative contributions of each factor (alcohol and TD, either isolated or in interaction) to these phenomena are still poorly understood. A rat model was used by forced consumption of 20% (w/v) alcohol for 9 months (CA), TD hit (TD diet + pyrithiamine 0.25 mg/kg, i.p. daily injections the last 12 days of experimentation (TDD)), and both combined treatments (CA+TDD). Motor and cognitive performance and cortical damage were examined. CA caused hyperlocomotion as a possible sensitization of ethanol-induced excitatory effects and recognition memory deficits. In addition, CA+TDD animals showed a disinhibited-like behavior which appeared to be dependent on TDD. Additionally, combined treatment led to more pronounced alterations in nitrosative stress, lipid peroxidation, apoptosis and cell damage markers. Correlations between injury signals and disinhibition suggest that CA+TDD disrupts behaviors dependent on the frontal cortex. Our study sheds light on the potential disease-specific mechanisms, reinforcing the need for neuroprotective therapeutic approaches along with preventive treatments for the nutritional deficiency in WKS.
Keywords: Wernicke’s encephalopathy; apoptosis; cell damage; chronic alcohol; disinhibition; lipid peroxidation; nitrosative stress; nutritional deficit; recognition memory; thiamine deficiency.
Conflict of interest statement
The authors declare no conflict of interest.
Figures


Similar articles
-
Upregulation of TLR4/MyD88 pathway in alcohol-induced Wernicke's encephalopathy: Findings in preclinical models and in a postmortem human case.Front Pharmacol. 2022 Sep 26;13:866574. doi: 10.3389/fphar.2022.866574. eCollection 2022. Front Pharmacol. 2022. PMID: 36225571 Free PMC article.
-
Cerebellar and cortical TLR4 activation and behavioral impairments in Wernicke-Korsakoff Syndrome: Pharmacological effects of oleoylethanolamide.Prog Neuropsychopharmacol Biol Psychiatry. 2021 Jun 8;108:110190. doi: 10.1016/j.pnpbp.2020.110190. Epub 2020 Dec 1. Prog Neuropsychopharmacol Biol Psychiatry. 2021. PMID: 33271211
-
Interactions between chronic ethanol consumption and thiamine deficiency on neural plasticity, spatial memory, and cognitive flexibility.Alcohol Clin Exp Res. 2015 Nov;39(11):2143-53. doi: 10.1111/acer.12859. Epub 2015 Sep 30. Alcohol Clin Exp Res. 2015. PMID: 26419807 Free PMC article.
-
Wernicke-Korsakoff syndrome despite no alcohol abuse: A summary of systematic reports.J Neurol Sci. 2021 Jul 15;426:117482. doi: 10.1016/j.jns.2021.117482. Epub 2021 May 7. J Neurol Sci. 2021. PMID: 34000679 Review.
-
Wernicke-Korsakoff-syndrome: under-recognized and under-treated.Psychosomatics. 2012 Nov-Dec;53(6):507-16. doi: 10.1016/j.psym.2012.04.008. Psychosomatics. 2012. PMID: 23157990 Review.
Cited by
-
Promising strategies for the prevention of alcohol-related brain damage through optimised management of acute alcohol withdrawal: A focussed literature review.J Psychopharmacol. 2025 Jul;39(7):652-666. doi: 10.1177/02698811241294005. Epub 2024 Nov 11. J Psychopharmacol. 2025. PMID: 39529219 Free PMC article. Review.
-
Aldehyde dehydrogenase 2 polymorphism is associated with chemotherapy-related cognitive impairment in patients with breast cancer who receive chemotherapy.Cancer Med. 2023 Mar;12(5):5209-5221. doi: 10.1002/cam4.5319. Epub 2022 Oct 6. Cancer Med. 2023. PMID: 36200595 Free PMC article.
-
Protocatechuic Acid Prevents Some of the Memory-Related Behavioural and Neurotransmitter Changes in a Pyrithiamine-Induced Thiamine Deficiency Model of Wernicke-Korsakoff Syndrome in Rats.Nutrients. 2023 Jan 26;15(3):625. doi: 10.3390/nu15030625. Nutrients. 2023. PMID: 36771332 Free PMC article.
-
Upregulation of TLR4/MyD88 pathway in alcohol-induced Wernicke's encephalopathy: Findings in preclinical models and in a postmortem human case.Front Pharmacol. 2022 Sep 26;13:866574. doi: 10.3389/fphar.2022.866574. eCollection 2022. Front Pharmacol. 2022. PMID: 36225571 Free PMC article.
References
Grants and funding
LinkOut - more resources
Full Text Sources

