

Relationship between Cognitive Dysfunction and Age-Related Variability in Oxidative Markers in Isolated Mitochondria of Alzheimer's Disease Transgenic Mouse Brains
- PMID: 35203488
- PMCID: PMC8869326
- DOI: 10.3390/biomedicines10020281
Relationship between Cognitive Dysfunction and Age-Related Variability in Oxidative Markers in Isolated Mitochondria of Alzheimer's Disease Transgenic Mouse Brains
Abstract
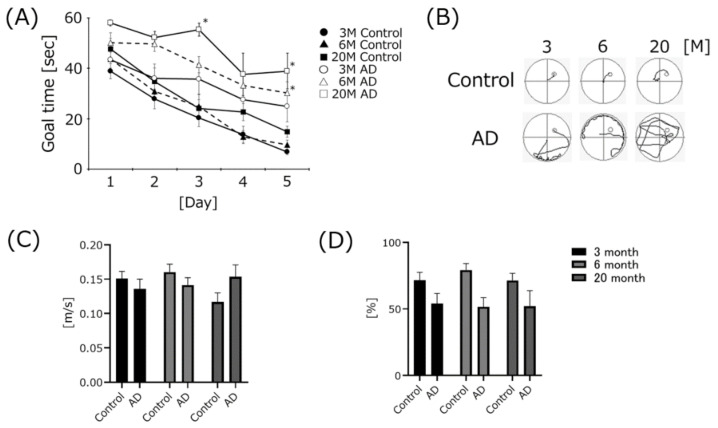
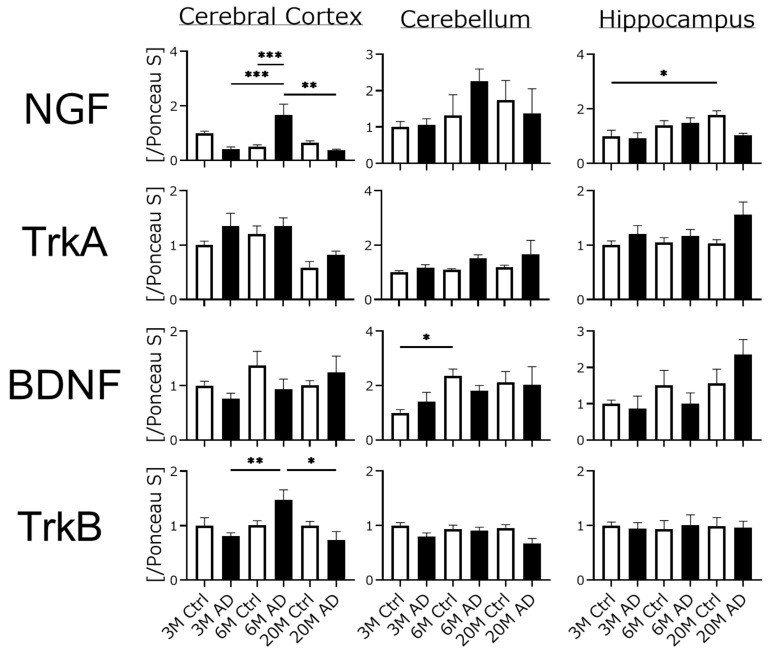
Many neurodegenerative disorders, including Alzheimer's disease (AD), are strongly associated with the accumulation of oxidative damage. Transgenic animal models are commonly used to elucidate the pathogenic mechanism of AD. Beta amyloid (Aβ) and tau hyperphosphorylation are very famous hallmarks of AD and well-studied, but the relationship between mitochondrial dysfunction and the onset and progression of AD requires further elucidation. In this study we used transgenic mice (the strain name is 5xFAD) at three different ages (3, 6, and 20 months old) as an AD model. Cognitive impairment in AD mice occurred in an age-dependent manner. Aβ1-40 expression significantly increased in an age-dependent manner in all brain regions with or without AD, and Aβ1-42 expression in the hippocampus increased at a young age. In a Western blot analysis using isolated mitochondria from three brain regions (cerebral cortex, cerebellum, and hippocampus), NMNAT-3 expression in the hippocampi of aged AD mice was significantly lower than that of young AD mice. SOD-2 expression in the hippocampi of AD mice was lower than for the age-matched controls. However, 3-NT expression in the hippocampi of AD mice was higher than for the age-matched controls. NQO-1 expression in the cerebral cortex of AD mice was higher than for the age-matched controls at every age that we examined. However, hippocampal NQO-1 expression in 6-month-old AD mice was significantly lower than in 3-month-old AD mice. These results indicate that oxidative stress in the hippocampi of AD mice is high compared to other brain regions and may induce mitochondrial dysfunction via oxidative damage. Protection of mitochondria from oxidative damage may be important to maintain cognitive function.
Keywords: Alzheimer’s disease; cognitive impairment; mitochondria; oxidative stress; reactive oxygen species.
Conflict of interest statement
The authors declare no conflict of interest.
Figures


Similar articles
-
Mitochondrial amyloid-beta levels are associated with the extent of mitochondrial dysfunction in different brain regions and the degree of cognitive impairment in Alzheimer's transgenic mice.J Alzheimers Dis. 2010;20 Suppl 2:S535-50. doi: 10.3233/JAD-2010-100342. J Alzheimers Dis. 2010. PMID: 20463404
-
Effects of the superoxide dismutase/catalase mimetic EUK-207 in a mouse model of Alzheimer's disease: protection against and interruption of progression of amyloid and tau pathology and cognitive decline.J Alzheimers Dis. 2012;30(1):183-208. doi: 10.3233/JAD-2012-111298. J Alzheimers Dis. 2012. PMID: 22406441
-
Tau Cleavage Contributes to Cognitive Dysfunction in Strepto-Zotocin-Induced Sporadic Alzheimer's Disease (sAD) Mouse Model.Int J Mol Sci. 2021 Nov 10;22(22):12158. doi: 10.3390/ijms222212158. Int J Mol Sci. 2021. PMID: 34830036 Free PMC article.
-
Role of mitochondrial dysfunction, oxidative stress and autophagy in progression of Alzheimer's disease.J Neurol Sci. 2021 Feb 15;421:117253. doi: 10.1016/j.jns.2020.117253. Epub 2020 Dec 5. J Neurol Sci. 2021. PMID: 33476985 Review.
-
Beneficial Effects of Walnuts on Cognition and Brain Health.Nutrients. 2020 Feb 20;12(2):550. doi: 10.3390/nu12020550. Nutrients. 2020. PMID: 32093220 Free PMC article. Review.
Cited by
-
Effect and mechanism of acupuncture on Alzheimer's disease: A review.Front Aging Neurosci. 2023 Mar 3;15:1035376. doi: 10.3389/fnagi.2023.1035376. eCollection 2023. Front Aging Neurosci. 2023. PMID: 36936498 Free PMC article. Review.
-
Natural antioxidants that act against Alzheimer's disease through modulation of the NRF2 pathway: a focus on their molecular mechanisms of action.Front Endocrinol (Lausanne). 2023 Jul 3;14:1217730. doi: 10.3389/fendo.2023.1217730. eCollection 2023. Front Endocrinol (Lausanne). 2023. PMID: 37465125 Free PMC article. Review.
-
A Blended Vitamin Supplement Improves Spatial Cognitive and Short-Term Memory in Aged Mice.Int J Mol Sci. 2024 Feb 28;25(5):2804. doi: 10.3390/ijms25052804. Int J Mol Sci. 2024. PMID: 38474050 Free PMC article.
-
Tocotrienols Prevent the Decline of Learning Ability in High-Fat, High-Sucrose Diet-Fed C57BL/6 Mice.Int J Mol Sci. 2024 Mar 21;25(6):3561. doi: 10.3390/ijms25063561. Int J Mol Sci. 2024. PMID: 38542534 Free PMC article.
-
Twendee X, a mixed antioxidant supplement, improves cognitive function, coordination, and neurotrophic factor expression in long-term vitamin E-deficient mice.J Clin Biochem Nutr. 2023 Mar;72(2):93-100. doi: 10.3164/jcbn.22-55. Epub 2022 Dec 9. J Clin Biochem Nutr. 2023. PMID: 36936879 Free PMC article.
References
-
- Vaz Miguel Silvestre S. Alzheimer’s disease: Recent treatment strategies. Eur. J. Pharmacol. 2020;887:173554. - PubMed
LinkOut - more resources
Full Text Sources
Molecular Biology Databases
Research Materials
Miscellaneous
