. 2022 Jan 28;10(2):304.
doi: 10.3390/biomedicines10020304.

Growth Factors Do Not Improve Muscle Function in Young or Adult mdx Mice

Affiliations

Growth Factors Do Not Improve Muscle Function in Young or Adult mdx Mice

Tue L Nielsen et al. Biomedicines. .

Abstract

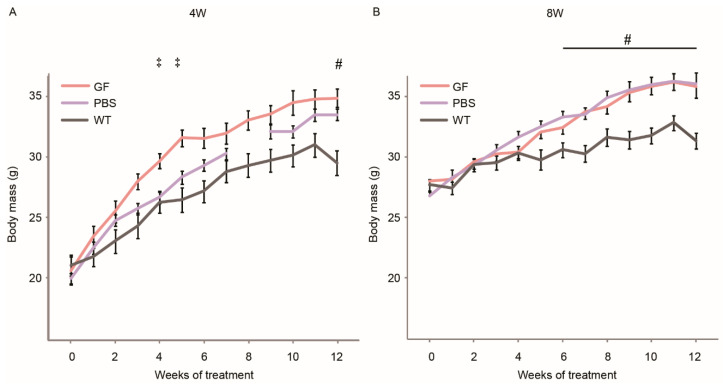
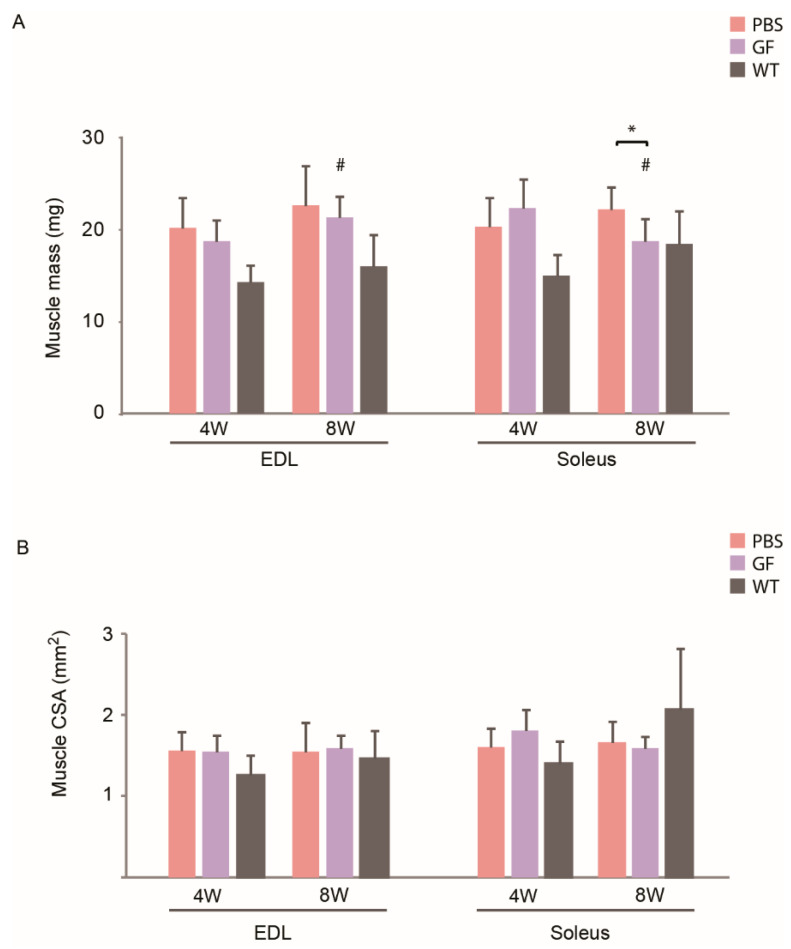
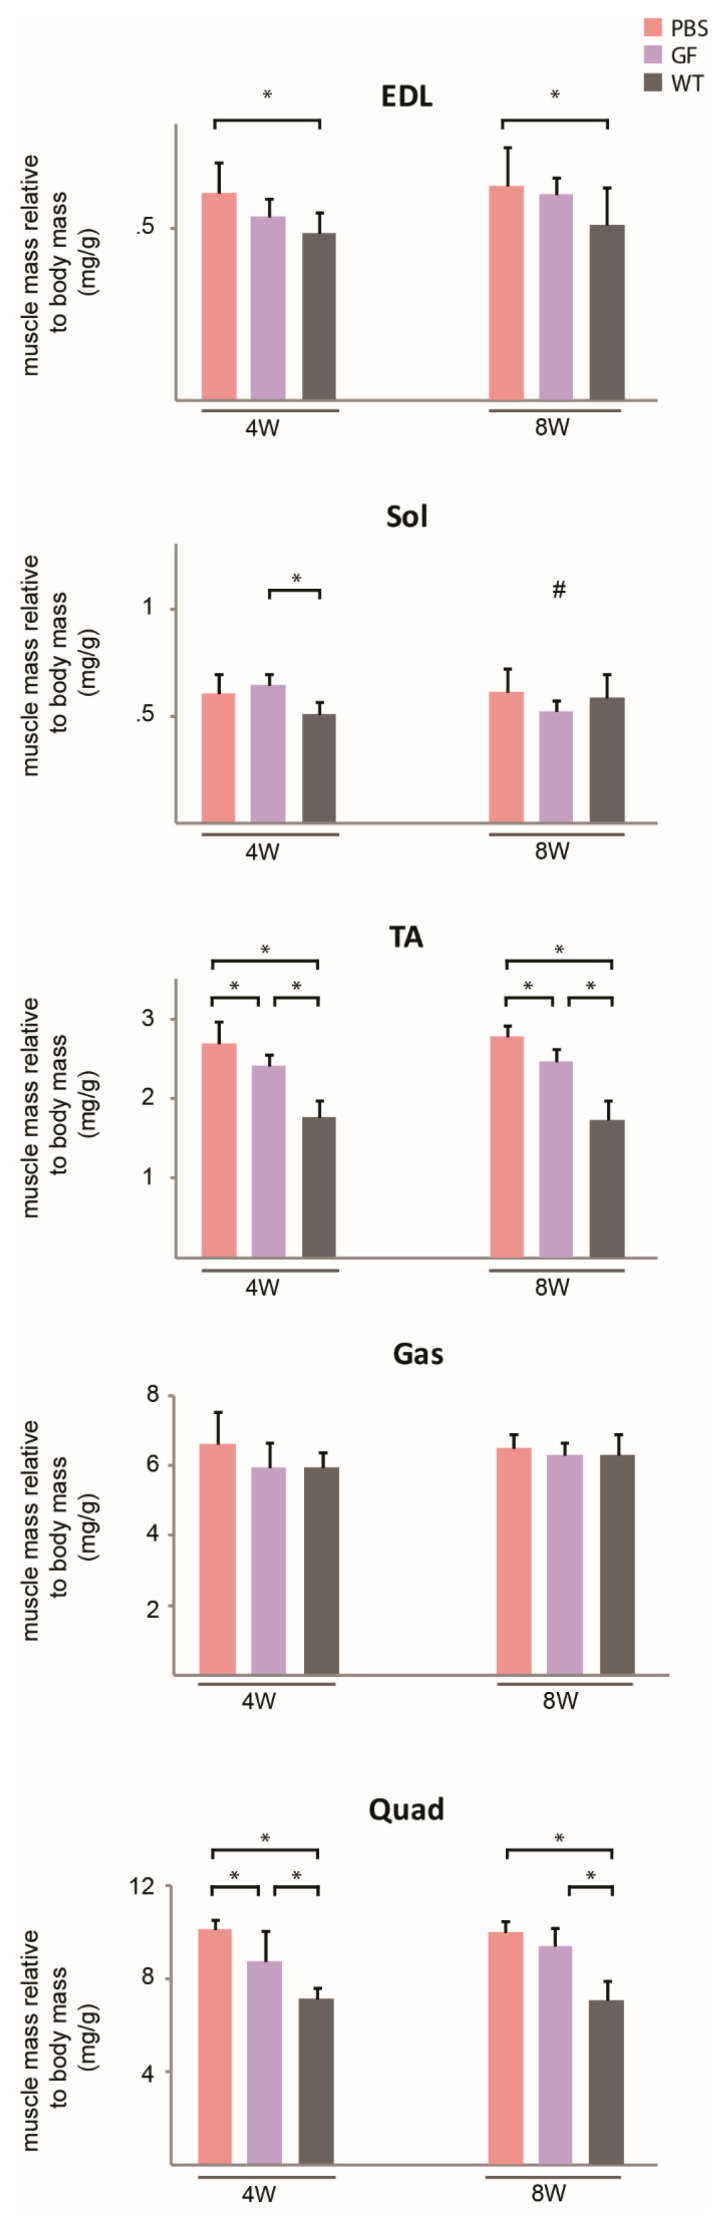
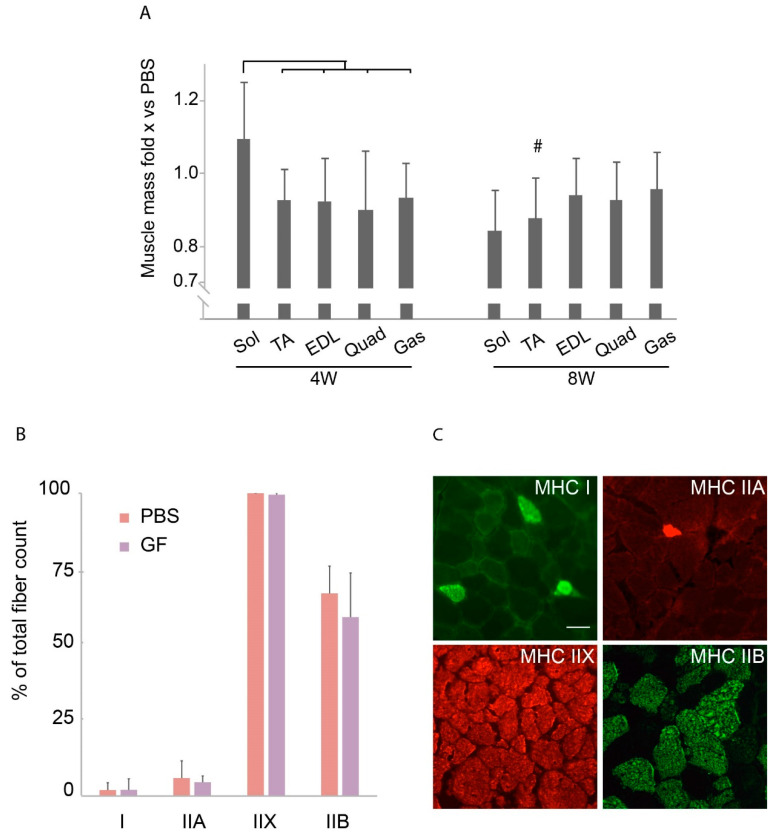
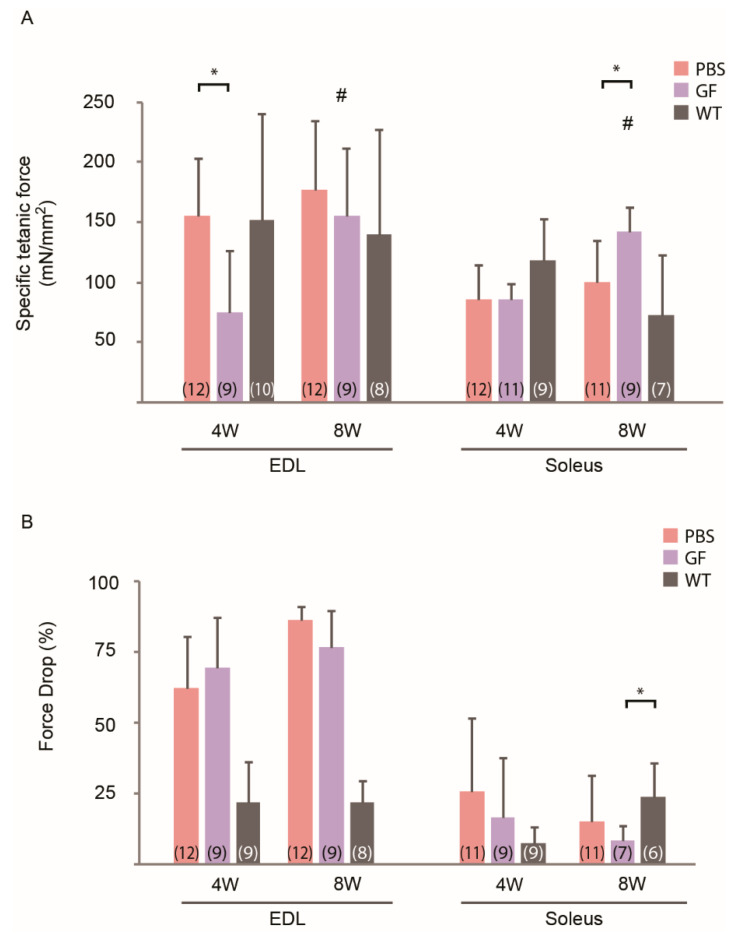
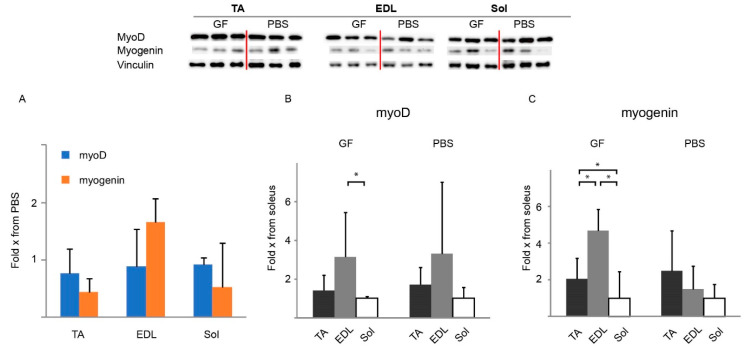
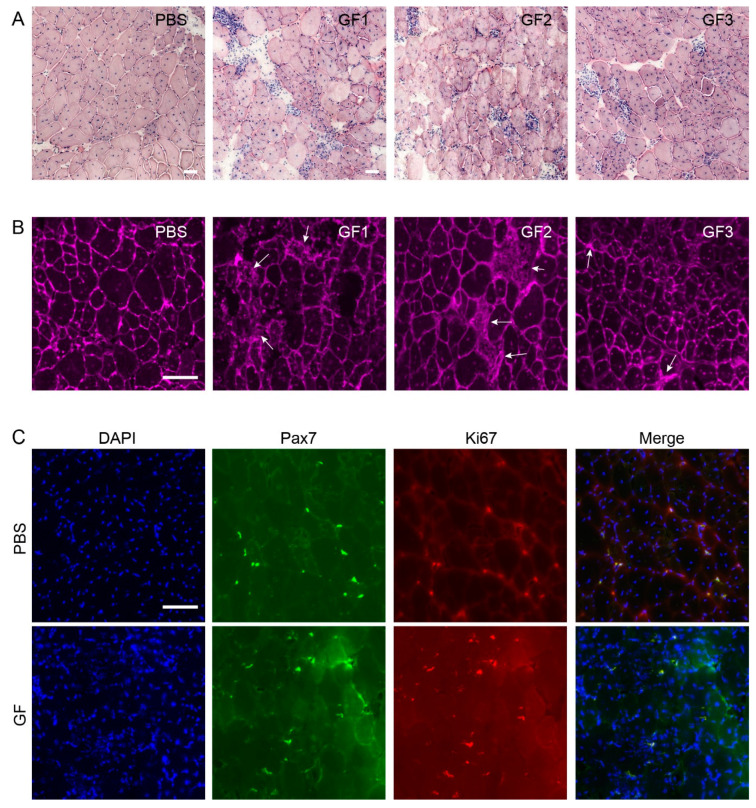
Muscular dystrophies constitute a broad group of genetic disorders leading to muscle wasting. We have previously demonstrated that treating a muscular atrophy mouse model with growth factors resulted in increased muscle mass. In the present study, we treated the Duchenne mouse model mdx for 12 weeks with myogenic growth factors peri- and post-onset of muscular degeneration to explore the effects in the oxidative muscle soleus and the glycolytic muscle extensor digitorum longus (EDL). We found no overall beneficial effect in the peri-onset group at the conclusion of the study. In the post-onset group, the functional improvement by means of electrophysiological examinations ex vivo was mostly confined to the soleus. EDL benefitted from the treatment on a molecular level but did not improve functionally. Histopathology revealed signs of inflammation at the end of treatment. In conclusion, the growth factor cocktail failed to improve the mdx on a functional level.

Keywords: DMD; hepatocyte growth factor; leukemia inhibitory factor; mdx; muscular regeneration.


Conflict of interest statement

T.O.K. is a consultant for Lion Therapeutics. J.V. has receive d research and travel support, and/or speaker honoraria from Sanofi/Genzyme and Alexion Pharmaceuticals, and served on advisory boards or as a consultant for Roche, Asklepios Biopharmaceuticals, PTC Therapeutics, Sanofi/Genzyme, Santhera Pharmaceuticals, Sarepta Therapeutics, Novartis Pharma AG, Audentes Therapeutics, and Stealth Biotherapeutics. The remaining authors declare no interests of conflict.

Figures

Figure 1
Figure 1
Growth curves of the different treatment cohorts. The growth pattern of the six groups in the 4W cohort (A) and the 8W cohort (B). Lack of data point in 4W PBS is due to accidental loss of measurements. GF, growth factor; PBS, phosphate-buffered saline; WT, wild-type strain. Vertical bars are SEM. Two-way ANOVAs were performed with subsequent Tukey HSD post-hoc tests to assess significance. Symbols indicate p < 0.05: ‡; GF vs. PBS, #; PBS vs. WT. The number N of each group was 12.
Figure 2
Figure 2
Muscle mass (A) and CSA (B) of hind-limb muscles of young (4W) and adolescent (8W) mdx mice treated for 12 weeks with growth factors. N for 4W animals: PBS, 12; GF, 11; WT, 11. N for 8W animals: PBS, 12; GF, 9; WT, 12. CSA, cross-sectional area; EDL, m. extensor digitorum longus; GF, growth factor; PBS, phosphate-buffered saline; WT, wild-type strain. Data presented as mean and vertical bars representing SD. Two-way ANOVAs were performed with subsequent Tukey HSD post-hoc tests to assess significance. Horizontal bars indicate significance: * p < 0.05, # p < 0.05 vs. 4W animals.
Figure 3
Figure 3
Muscle mass related to body weight. Muscle mass of EDL, soleus, TA, gastrocnemius, and quadriceps related to body mass at the conclusion of 12-week treatment period. 4W + 8W PBS; 8W WT: N = 12; 4W GF, 4W WT: N = 11; 8W GF: N = 9. EDL, m. extensor digitorum longus; Gas, m. gastrocnemius; GF, growth factor; PBS, phosphate-buffered saline; Quad, m. quadriceps; Sol, m. soleus; TA, m. tibialis anterior. Data presented as mean and vertical bars representing SD. Two-way ANOVAs were performed with subsequent Tukey HSD post-hoc tests to assess significance. Horizontal bars indicate significance: *: p < 0.05, #: p < 0.05 vs. 4W.
Figure 4
Figure 4
Muscle mass of treatment groups in relation to PBS and fiber-type composition. (A) Muscle mass of various muscles treated with growth factors compared to PBS in the two age-groups. N = 11 for 4W group, N = 9 for 8W group. (B) Percentage of each fiber-type present in TA in treated (N = 7) versus untreated (N = 6) 8W mice. The total distribution exceeded 100% since mixed fibers were counted twice. (C) Representative stains of fiber-types MHC I, IIA, IIX, and IIB. Bar represent 50 µm. EDL, m. extensor digitorum longus; Gas, m. gastrocnemius; PBS, phosphate-buffered saline; Quad, m. quadriceps; Sol, m. soleus; TA, m. tibialis anterior. Data presented as mean and vertical bars representing SD. Two-way ANOVAs were performed with subsequent Tukey HSD post-hoc tests to assess significance. Bars: p < 0.05, #: p < 0.05 vs. PBS.
Figure 5
Figure 5
Ex vivo specific tetanic force and force drop in EDL and soleus of mdx treated for 12 weeks with growth factors. (A) Specific force of tetanic contraction in EDL and soleus of 4W and 8W mdx. (B) Force drop in muscles subjected to a stretch protocol. N is showed in the table in parentheses and may vary due to non-responsiveness to stimuli or loss of connection to the force transducer during the protocol. EDL, m. extensor digitorum longus; GF, growth factor; PBS, phosphate-buffered saline; WT, wild-type strain. Data presented as mean and vertical bars representing SD. Two-way ANOVAs were performed with subsequent Tukey HSD post-hoc tests to assess significance. Horizontal bars indicate significance: *: p < 0.05, #: p < 0.05 vs. 4W animals.
Figure 6
Figure 6
Western blotting of myogenic transcription factors in relation to PBS or soleus in adolescent (8W) mdx treated for 12 weeks at the conclusion of treatment. Representative bands are shown (all bands can be seen in Supplementary Materials Figure S3). (A) Levels of myoD and myogenin in EDL, TA, and soleus in response to GF treatment relative to PBS. (B,C) Levels of myoD (B) and myogenin (C) in various muscles relative to soleus. A: N = 6 for all groups. B and C: N = 6 for all groups except EDL of PBS group (n = 5). EDL, m. extensor digitorum longus; GF, growth factor; PBS, phosphate-buffered saline; Sol, m. soleus; TA, m. tibialis anterior. Data presented as bars with the respective mean and SD as vertical bar. Two-way ANOVAs were performed with subsequent Tukey HSD post-hoc tests to assess significance. Horizontal bars indicate significance: *: p < 0.05.
Figure 7
Figure 7
Effect of treatment on histopathology. H&E, WGA, and IHC stains of treated (GF) versus controls (PBS) mdx animals. (A) H&E stains demonstrate fiber size variation, focal inflammation, and necrotic fibers in treated animals compared to controls. (B) WGA showed increased fibrosis (arrows) in treated animals. (C) DAPI (blue), Pax7 (green), and Ki67 (red) showed activation of satellite cells. Bars represent 50 mm.

References

    1. Gatheridge M.A., Kwon J.M., Mendell J.M., Scheuerbrandt G., Moat S.J., Eyskens F., Rockman-Greenberg C., Drousiotou A., Griggs R.C. Identifying Non-Duchenne Muscular Dystrophy-Positive and False Negative Results in Prior Duchenne Muscular Dystrophy Newborn Screening Programs: A Review. JAMA Neurol. 2016;73:111–116. doi: 10.1001/jamaneurol.2015.3537. - DOI - PubMed
    1. Krag T.O.B., Gyrd-Hansen M., Khurana T.S. Harnessing the Potential of Dystrophin-Related Proteins for Ameliorating Duchenne’s Muscular Dystrophy. Acta Physiol. Scand. 2001;171:349–358. doi: 10.1046/j.1365-201x.2001.00838.x. - DOI - PubMed
    1. Emery A.E. The Muscular Dystrophies. Lancet. 2002;359:687–695. doi: 10.1016/S0140-6736(02)07815-7. - DOI - PubMed
    1. Stedman H.H., Sweeney H.L., Shrager J.B., Maguire H.C., Panettieri R.A., Petrof B., Narusawa M., Leferovich J.M., Sladky J.T., Kelly A.M. The Mdx Mouse Diaphragm Reproduces the Degenerative Changes of Duchenne Muscular Dystrophy. Nature. 1991;352:536–539. doi: 10.1038/352536a0. - DOI - PubMed
    1. Hauerslev S., Vissing J., Krag T.O. Muscle Atrophy Reversed by Growth Factor Activation of Satellite Cells in a Mouse Muscle Atrophy Model. PLoS ONE. 2014;9:e100594. doi: 10.1371/journal.pone.0100594. - DOI - PMC - PubMed

LinkOut - more resources