. 2022 Feb 8;10(2):402.
doi: 10.3390/biomedicines10020402.

Cellular Phenotypic Transformation in Heart Failure Caused by Coronary Heart Disease and Dilated Cardiomyopathy: Delineating at Single-Cell Level

Affiliations

Cellular Phenotypic Transformation in Heart Failure Caused by Coronary Heart Disease and Dilated Cardiomyopathy: Delineating at Single-Cell Level

Luojiang Zhu et al. Biomedicines. .

Abstract

Heart failure (HF) is known as the final manifestation of cardiovascular diseases. Although cellular heterogeneity of the heart is well understood, the phenotypic transformation of cardiac cells in progress of HF remains obscure. This study aimed to analyze phenotypic transformation of cardiac cells in HF through human single-cell RNA transcriptome profile. Here, phenotypic transformation of cardiomyocytes (CMs), endothelial cells (ECs), and fibroblasts was identified by data analysis and animal experiments. Abnormal myosin subunits including the decrease in Myosin Heavy Chain 6, Myosin Light Chain 7 and the increase in Myosin Heavy Chain 7 were found in CMs. Two disease phenotypes of ECs named inflammatory ECs and muscularized ECs were identified. In addition, myofibroblast was increased in HF and highly associated with abnormal extracellular matrix. Our study proposed an integrated map of phenotypic transformation of cardiac cells and highlighted the intercellular communication in HF. This detailed definition of cellular transformation will facilitate cell-based mapping of novel interventional targets for the treatment of HF.

Keywords: cardiac fibrosis; coronary heart disease; heart failure; myosin; phenotypic transformation; single-cell RNA sequencing.


Conflict of interest statement

The authors declare no conflict of interest.

Figures

Figure 1
Figure 1
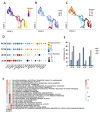
Five cell types were identified from single-cell transcriptome of heart disease. (A,B) Uniform Manifold Approximation and Projection (UMAP) plots. Clusters are color-coded by cell types (A) and patient (B). (C) Canonical markers for 5 different cell clusters on the UMAP plot. (D) Violin plots of canonical marker of 5 cell types. (E) Heatmap depicting the top 5 differentially expressed genes (DEGs) in each cell cluster. Rows indicate cell types and columns indicate genes. (F) Cell proportion of 3 sample sources in each cell type.
Figure 2
Figure 2
Cardiomyocytes (CMs) cluster into 4 distinct phenotypes. (AC) Cell trajectory of CM calculated by Monocle3, cells were colored by pseudotime (A), sample (B), and phenotypes (C). (D) Dot plot of CM subpopulations demonstrates the top five markers of each type. Dot size corresponds to proportion of cells expressing each transcript within the group, and dot color stands for scaled expression level. (E) The distribution of three kinds of samples (nHF, cHF, dHF) in four CM phenotypes (NCM, ECM, cCM, dCM). (F) Differences of pathway enrichment among 4 CM phenotypes.
Figure 3
Figure 3
Abnormal expression of myosin subunits in cCM. (AC) Volcano plot of DEGs (log2FC > 1) between each 2 CM phenotypes. (D) Violin plots show the scaled expression of different subtypes of MLC and MHC in 4 CM phenotypes. * Padj < 0.05, Wilcox test. (E) Heat map of phenotype-specific TFs activity in 4 CM phenotypes. (F) TBX5 and ATF6 regulates downstream genes predicted by SCENIC.
Figure 4
Figure 4
Abnormal expression of myosin subunits was supported in the rat heart failure models. (A) Masson staining of the HF and sham group (Left). Histogram of the area of positive fibrosis (Right). n = 5 per group. * p < 0.05 vs. sham. (B) Left ventricular systolic function parameters images at the study endpoint between the HF and sham group. n = 5 per group. * p < 0.05 vs. sham. LVIDd: Left ventricular diastolic inner diameter; LVEF: Left ventricular ejection fraction; LVIDs: Left ventricular systolic inner diameter; FS: Fraction shortener; EF: Ejection Fraction; LVPWd: left ventricular diastolic posterior wall thickness; LVPWs: Left ventricular systolic posterior wall thickness. (C) mRNA expression of MHC and MLC subunits. n = 8 per group. * p < 0.05 vs. sham; ns: no significance. (D,E) Representative immunohistochemistry images of the hearts of the sham and HF group indicate the myosin subunits change, including Myl7, Myh6. (F) AOD of Myh6 or Myl7 immunohistochemistry images. n = 5 per group. * p < 0.05 vs. sham. (G) mRNA expression of transcription factors TBX5 and ATF6, n = 8 per group. * p < 0.05 vs. sham.
Figure 5
Figure 5
Endothelial cells in HF have two special disease-related phenotypes. (A, B) UMAP plot of ECs, subgroups were colored by phenotypes (A) and sample s (B). (C) The distribution of cells from nHF, cHF, and dHF in three phenotypes (EC1, EC2, EC3). (D) The heatmap shows the differential gene expression pattern of three phenotypes of ECs. (E) Difference of pathway enrichment between EC1 and EC3. (F) Immunofluorescence showed the presence of myosin subunits (Myh6, Myl7) in ECs of heart vessels in the HF (right).
Figure 6
Figure 6
Fibroblasts transformed into Myofibroblasts. (A) UMAP plot of FBs, clusters were colored by phenotypes, Nor-FBs and Myo-FBs. (B) Violin plots show the different markers of Nor-FBs and Myo-FBs. * Padj < 0.05 Wilcox test. (C) Cell distribution of three sample sources in two phenotypes. (D) Proportion of Myo-FBs in cHF and dHF were more than nHF. (E) Immunofluorescence showed the colocalization of Vimentin and ACTN2 in the HF group. (F) Differential pathway enrichment between Nor-FBs and Myo-FBs.
Figure 7
Figure 7
Intracardiac regulatory network-mediated microenvironmental changes in HF. (A) Receptor–ligand pairs between cell populations. Each point represented one cell group; the size of the point indicated the number of receptor-ligand pairs associated with it. Lines represented the pairs between two groups, the thicker the line is, the more pairs exist. (B) Heatmap shows the number of interactions between two cell clusters (C) Network of potential mechanisms from myocardial infarction to heart failure.

References

    1. Litviňuková M., Talavera-López C., Maatz H., Reichart D., Worth C.L., Lindberg E.L., Kanda M., Polanski K., Heinig M., Lee M., et al. Cells of the adult human heart. Nature. 2020;588:466–472. doi: 10.1038/s41586-020-2797-4. - DOI - PMC - PubMed
    1. Wang L., Yu P., Zhou B., Song J., Li Z., Zhang M., Guo G., Wang Y., Chen X., Han L., et al. Single-cell reconstruction of the adult human heart during heart failure and recovery reveals the cellular landscape underlying cardiac function. Nat. Cell Biol. 2020;22:108–119. doi: 10.1038/s41556-019-0446-7. - DOI - PubMed
    1. Tyser R.C.V., Ibarra-Soria X., McDole K., Jayaram S.A., Godwin J., Brand T.A.H. van D.; Miranda, A.M.A.; Scialdone, A.; Keller, P.J.; Marioni, J.C.; et al. Characterization of a common progenitor pool of the epicardium and myocardium. Science. 2021;371:371. doi: 10.1126/science.abb2986. - DOI - PMC - PubMed
    1. Xia N., Lu Y., Gu M., Li N., Liu M., Jiao J., Zhu Z., Li J., Li D., Tang T., et al. A Unique Population of Regulatory T Cells in Heart Potentiates Cardiac Protection From Myocardial Infarction. Circulation. 2020;142:1956–1973. doi: 10.1161/CIRCULATIONAHA.120.046789. - DOI - PubMed
    1. Wei Z., Chong H., Jiang Q., Tang Y., Xu J., Wang H., Shi Y., Cui L., Li J., Zhang Y., et al. Smooth Muscle Overexpression of PGC1α Attenuates Atherosclerosis in Rabbits. Circ. Res. 2021;129:e72–e86. doi: 10.1161/CIRCRESAHA.120.317705. - DOI - PubMed