. 2022 Jan 24;11(2):222.
doi: 10.3390/antiox11020222.

Calycosin Alleviates Paraquat-Induced Neurodegeneration by Improving Mitochondrial Functions and Regulating Autophagy in a Drosophila Model of Parkinson's Disease

Affiliations

Calycosin Alleviates Paraquat-Induced Neurodegeneration by Improving Mitochondrial Functions and Regulating Autophagy in a Drosophila Model of Parkinson's Disease

Hitesh Singh Chaouhan et al. Antioxidants (Basel). .

Abstract

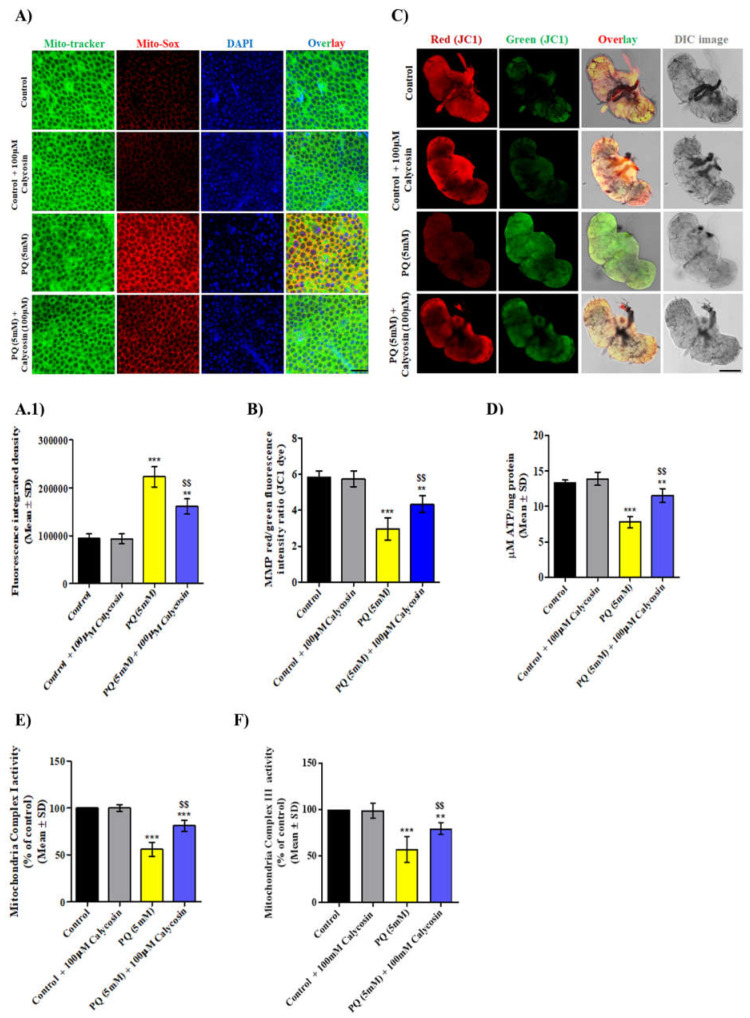
Parkinson's disease (PD) is the second most common age-related neurodegenerative disorder with limited clinical treatments. The occurrence of PD includes both genetic and environmental toxins, such as the pesticides paraquat (PQ), as major contributors to PD pathology in both invertebrate and mammalian models. Calycosin, an isoflavone phytoestrogen, has multiple pharmacological properties, including neuroprotective activity. However, the paucity of information regarding the neuroprotective potential of calycosin on PQ-induced neurodegeneration led us to explore whether calycosin can mitigate PD-like phenotypes and the underlying molecular mechanisms. We used a PQ-induced PD model in Drosophila as a cost-effective in vivo screening platform to investigate the neuroprotective efficacy of natural compounds on PD. We reported that calycosin shows a protective role in preventing dopaminergic (DA) neuronal cell death in PQ-exposed Canton S flies. Calycosin-fed PQ-exposed flies exhibit significant resistance against PQ-induced mortality and locomotor deficits in terms of reduced oxidative stress, loss of DA neurons, the depletion of dopamine content, and phosphorylated JNK-caspase-3 levels. Additionally, mechanistic studies show that calycosin administration improves PQ-induced mitochondrial dysfunction and stimulates mitophagy and general autophagy with reduced pS6K and p4EBP1 levels, suggestive of a maintained energy balance between anabolic and catabolic processes, resulting in the inhibition of neuronal cell death. Collectively, this study substantiates the protective effect of calycosin against PQ-induced neurodegeneration by improving DA neurons' survival and reducing apoptosis, likely via autophagy induction, and it is implicated as a novel therapeutic application against toxin-induced PD pathogenesis.

Keywords: Drosophila; Parkinson’s disease; autophagy; calycosin; neurodegeneration; paraquat.


Conflict of interest statement

All authors have declared no conflict of interest.

Figures

Figure 1
Figure 1
The protective effects of the phytoestrogen, calycosin against PQ-induced toxicity and locomotor defects. (A) The chemical structure of calycosin. (B) Survival assays were carried out by using 3–5-day-old adult male flies as outlined above, and the counting of surviving flies was performed every 24 h post exposure until all of the flies died, and we plotted the survival percentage graphs on days 1, 3, and 5 of PQ co-exposures with different feeding concentrations of calycosin. Data represent five independent biological replicates with 20 flies per feeding regimen. Data are presented as mean ± SD (n = 3); significance ascribed as * = p < 0.05 and *** = p < 0.001 vs. PQ (5 mM) exposure. (C) The protective effect of calycosin supplements on the flies’ locomotor performance when exposed to PQ was examined through the climbing assay. The number of flies climbing over a 10 cm distance within 10 s was recorded, and the graph was plotted at 24, 48, and 72 h. Data are presented in at least five independent experiments with 20 flies per group. Data presented are mean ± SD (n = 3). Significance ascribed as * = p < 0.05, ** = p < 0.01 and *** = p < 0.001 vs. PQ (5 mM) exposure. PQ, paraquat; SD, standard deviation.
Figure 2
Figure 2
Calycosin suppresses dopaminergic neuron loss in PQ-exposed Canton S flies. (A.1) Representative confocal imaging was used to detect specific DA neuron clusters in the control flies and the flies exposed to 5 mM PQ or with PQ (5 mM) + 100 µM calycosin for 48 h. Anti-Drosophila tyrosine hydroxylase antibody was used to detect the specific DA neuronal clusters in the Drosophila brain. White and red arrows indicate the PPL and PPM DA neuron clusters, respectively. Scale bars—100 µm. (A.2) Graph showing the average number of DA neuron clusters in the control flies and the flies exposed to 5 mM PQ or with PQ (5 mM) + 100 µM calycosin for 48 h. (A.3) Schematic diagram of different DA neuron clusters. (B,C) Graph showing the Dopamine (DA) and L-DOPA production in control and 5 mM PQ or with PQ (5 mM) + 100 µM calycosin exposed flies for 48 h. Data presented are mean ± SD (n = 3). Significance ascribed as * = p < 0.05, ** = p < 0.01 and *** = p < 0.001 vs. control and $ = p < 0.05 and $$ = p < 0.01 vs. PQ (5 mM) exposure. DA, dopaminergic; PQ, paraquat; SD, standard deviation.
Figure 3
Figure 3
Calycosin supplements resist PQ-induced higher ROS levels. Graphical representation of ROS levels using quantitative measurement of DHE (A), DCF-DA (B) and DHR’s (C) fluorescence intensity in the control (D), 5 mM PQ and with PQ (5 mM) + 100 µM calycosin-exposed flies for 48 h. (B.1) Representative confocal imaging showing DHE oxidation level in live brain tissues from the control, 5 mM PQ, and with PQ (5 mM) + 100 µM calycosin-exposed flies and (B.2) graphs showing DHE fluorescence integrated density in control and exposed fly groups. Data presented are mean ± SD (n = 3). Significance ascribed as * = p < 0.05, ** = p < 0.01 and *** = p < 0.001 vs. control and $$ = p < 0.01 vs. PQ (5 mM) exposure. DHE, dihydroethidium; DCF-DA, 2’,7’-dichlorodihydrofluorescein diacetate; DHR, dihydrorhodamine; PQ, paraquat; SD, standard deviation. Scale bars—100 µm.
Figure 4
Figure 4
Calycosin administration optimizes the redox equilibrium in PQ-exposed flies. Graphical representation of oxidative stress (OS) end parameters such as SOD activity (A), CAT activity (B), glutathione content (C), MDA in terms of the lipid peroxidation (D) and PC content (E) in control, 5 mM PQ and with PQ (5 mM) + 100 µM calycosin-exposed flies for 48 h. Western blot picture (F.1) and its densitometric graph plot (normalized with loading control β-tubulin) showing DNP level (an indicator of oxidatively modified proteins) (F.2) in the protein samples from the brains of control, 5 mM PQ and with PQ (5 mM) + 100 µM calycosin-exposed flies after 48 h. The “+”- and “-” lanes represent protein samples derivatized with or without DNPH. Data presented are mean ± SD (n = 3). Significance ascribed as * = p < 0.05, ** = p < 0.01 and *** = p < 0.001 vs. control and $ = p < 0.05 and $$ = p < 0.01 vs. PQ (5 mM) exposure. MDA, malondialdehyde; DNPH, 2,4-dinitrophenylhydrazine; PQ, paraquat; SD, Standard deviation.
Figure 4
Figure 4
Calycosin administration optimizes the redox equilibrium in PQ-exposed flies. Graphical representation of oxidative stress (OS) end parameters such as SOD activity (A), CAT activity (B), glutathione content (C), MDA in terms of the lipid peroxidation (D) and PC content (E) in control, 5 mM PQ and with PQ (5 mM) + 100 µM calycosin-exposed flies for 48 h. Western blot picture (F.1) and its densitometric graph plot (normalized with loading control β-tubulin) showing DNP level (an indicator of oxidatively modified proteins) (F.2) in the protein samples from the brains of control, 5 mM PQ and with PQ (5 mM) + 100 µM calycosin-exposed flies after 48 h. The “+”- and “-” lanes represent protein samples derivatized with or without DNPH. Data presented are mean ± SD (n = 3). Significance ascribed as * = p < 0.05, ** = p < 0.01 and *** = p < 0.001 vs. control and $ = p < 0.05 and $$ = p < 0.01 vs. PQ (5 mM) exposure. MDA, malondialdehyde; DNPH, 2,4-dinitrophenylhydrazine; PQ, paraquat; SD, Standard deviation.
Figure 5
Figure 5
Flies with calycosin supplements were more resistant to neuronal cell death after PQ exposure. Representative immunoblot images (A.1) and the densitometry analysis graph (A.2) of TH, pJNK, JNK and cleaved capase-3 in the protein samples from the brains of control, 5 mM PQ and with PQ (5 mM) + 100 µM calycosin-exposed flies after 48 h. Values are represent mean ± SD (n = 3). Significance ascribed as * = p < 0.05, ** = p < 0.01 and *** = p < 0.001 vs. control and $$ = p < 0.05 vs. PQ (5 mM) exposure. (B.1) Representative confocal images showing localization of cleaved caspase-3 in the neuronal cells using F-actin staining in brain samples of control, 5 mM PQ and with PQ (5 mM) + 100 µM calycosin-exposed flies after 48 h and (B.2) graphs showing fluorescence integrated density in control and exposed fly groups. Graphs showing (C) Cleaved caspase-3 and (D) cleaved caspase-9 activity in control, 5 mM PQ and with PQ (5 mM) + 100 µM calycosin-exposed flies after 48 h. Values represent mean ± SD (n = 3). Significance ascribed as ** = p < 0.01 and *** = p < 0.001 vs. control and $$ = p < 0.05 and $$$ = p < 0.001 vs. PQ (5 mM) exposure. PQ, paraquat; SD, standard deviation. Scale bars—20 µm.
Figure 6
Figure 6
Calycosin administration improves PQ-induced mitochondrial functions in exposed flies. (A) Representative confocal microscopic images showing Mito-SOX O2. staining in the live brain tissues from the control, 5 mM PQ and with PQ (5 mM) + 100 µM calycosin-exposed flies and (A.1) graphs showing Mito-SOX O2. fluorescence integrated density in the control and exposed flies. Scale bars—20 µm. Representative graph (B) and confocal images (C) showing mitochondrial membrane potential (in terms of red to green fluorescence intensity measurement) using the JC-10 dye assays in the brain samples of control, 5 mM PQ and with PQ (5 mM) + 100 µM calycosin-exposed flies after 48 h. Scale bars—100 µm. Graphs showing ATP level (D), mitochondria complex-I (E) and -II (F) activity in the brain samples of the control, 5 mM PQ and with PQ (5 mM) + 100 µM calycosin-exposed flies after 48 h. Values represent mean ± SD (n = 3). Significance ascribed as ** = p < 0.01 and *** = p < 0.001 vs. control and $$ = p < 0.05 vs. PQ (5 mM) exposure. PQ, paraquat; SD, standard deviation.
Figure 7
Figure 7
Calycosin confers protection against PQ-induced neurotoxicity through the modulation of the autophagy response in exposed flies. Western blot images (A.1) and their densitometry analysis graph (A.2) showing p-S6K1, p-4EBP1, beclin-1, Atg5-Atg12, Atg8b, and p62 in protein samples from the brains of control, 5 mM PQ and with PQ (5 mM) + 100 µM calycosin-exposed flies after 48 h. Values represent mean ± SD (n = 3). Significance ascribed as * = p < 0.05, ** = p < 0.01 and *** = p < 0.001 vs. control and $ = p < 0.05 and $$ = p < 0.01 vs. PQ (5 mM) exposure. (B.1) Representative confocal images showing mitophagy using mito-QC staining in the brain samples of control, 5 mM PQ and with PQ (5 mM) + 100 µM calycosin-exposed TH-Gal4/UAS-mito-QC flies after 48 h and (B.2) quantification showing mitolysosomes in control and exposed flies. Confocal images (C.1) showing Atg8a (green) and Lysotracker staining (red) of the brain tissues in the control, 5 mM PQ and with PQ (5 mM) + 100 µM calycosin-exposed flies after 48 h and quantification showing Atg8a (C.2) -and Lysotracker -puncta (C.3) in control and exposed flies. Values represent mean ± SD (n = 3). Significance ascribed as ** = p < 0.01 and *** = p < 0.001 vs. control and $$ = p < 0.05 and $$$ = p < 0.001 vs. PQ (5 mM) exposure. PQ, paraquat; SD, standard deviation. Scale bars—20 µm.
Figure 8
Figure 8
Schematic representation of the protective efficacy of calycosin administration against neuronal cell death, and locomotor impairment and reduced survival of Drosophila after exposure to PQ. Schematic model showing a neuroprotective potential of calycosin on PQ-induced PD-like phenotypes by improving the DA neuronal health, better locomotor performance, and increasing fly survival, primarily governed by lower reactive species (O2•−/ONOO) formation, pJNK-caspase-3-mediated dopaminergic neuronal cell death and improving mitochondrial functions and restoring autophagy in exposed organisms.

Similar articles

Cited by

References

    1. Heemels M.T. Neurodegenerative diseases. Nature. 2016;539:179. doi: 10.1038/539179a. - DOI - PubMed
    1. Gooch C.L., Pracht E., Borenstein A.R. The burden of neurological disease in the United States: A summary report and call to action. Ann. Neurol. 2017;81:479–484. doi: 10.1002/ana.24897. - DOI - PubMed
    1. Pringsheim T., Jette N., Frolkis A., Steeves T.D. The prevalence of Parkinson’s disease: A systematic review and meta-analysis. Mov. Disord. 2014;29:1583–1590. doi: 10.1002/mds.25945. - DOI - PubMed
    1. Zeng X.S., Geng W.S., Jia J.J. Neurotoxin-Induced Animal Models of Parkinson Disease: Pathogenic Mechanism and Assessment. ASN Neuro. 2018;10:1759091418777438. doi: 10.1177/1759091418777438. - DOI - PMC - PubMed
    1. Mythri R.B., Bharath M.M. Curcumin: A potential neuroprotective agent in Parkinson’s disease. Curr. Pharm. Des. 2012;18:91–99. doi: 10.2174/138161212798918995. - DOI - PubMed

LinkOut - more resources