Review
. 2022 Feb 10;12(2):451.
doi: 10.3390/diagnostics12020451.

Influences on PET Quantification and Interpretation

Affiliations
Review

Influences on PET Quantification and Interpretation

Julian M M Rogasch et al. Diagnostics (Basel). .

Abstract

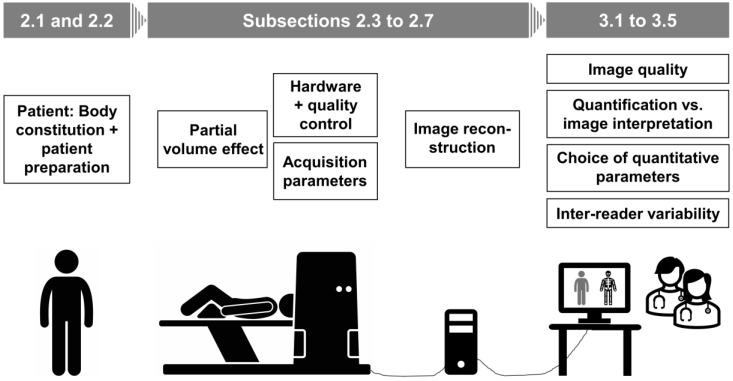
Various factors have been identified that influence quantitative accuracy and image interpretation in positron emission tomography (PET). Through the continuous introduction of new PET technology-both imaging hardware and reconstruction software-into clinical care, we now find ourselves in a transition period in which traditional and new technologies coexist. The effects on the clinical value of PET imaging and its interpretation in routine clinical practice require careful reevaluation. In this review, we provide a comprehensive summary of important factors influencing quantification and interpretation with a focus on recent developments in PET technology. Finally, we discuss the relationship between quantitative accuracy and subjective image interpretation.

Keywords: contrast recovery; image interpretation; image quality; positron emission tomography; quantitative accuracy; signal-to-noise ratio.


Conflict of interest statement

The authors declare no conflict of interest.

Figures

Figure 1
Figure 1
Article structure: From patient preparation to image interpretation. Every step of preparing the patient, acquiring and processing PET images, and choosing criteria to quantify and interpret the data potentially affects quantitative and diagnostic accuracy. Each of these steps is addressed by successive subsections of this article.
Figure 2
Figure 2
The thin line of quantitative accuracy in PET. Quantitative accuracy of PET in lesions (i.e., recovery of the true activity concentration) can be imagined as a pair of balances between factors that promote either under- or overestimation of the true activity. Additionally, the point at which the combination of these contrasting factors achieves quantitative accuracy is influenced by lesion-specific and methodological factors (e.g., the choice of standardized uptake value (SUV) parameter). * Reported lesion SUVs in PET/MRI are lower than those in PET/CT; however, this may not be true for every lesion in every tissue. PSF, point spread function; PL, penalized likelihood.
Figure 3
Figure 3
Reconstructed spatial resolution. The effect of limited reconstructed spatial resolution on lesion contrast recovery (CR) at different lesion diameters is demonstrated here, while the additional effect of image spacing is disregarded. In this example, spatial resolution is always 4 mm full width at half maximum (FWHM). The true lesion activity is shown in light grey, and the displayed activity is shown by the black line. In a 10-mm lesion (left), CR is 0.97, which is close to the optimum of 1.0 but decreases considerably with decreasing lesion diameter despite equal true activity. Please note that these values are calculated for lesions with absent background activity. If background activity is present, relative CR increases systematically.
Figure 4
Figure 4
Image spacing. The effect of image spacing is illustrated in two dimensions (but would have to be extrapolated to three dimensions for PET data). (A) An idealized homogenous, spherical lesion is displayed on the left side with the superimposed voxel grid. The depiction of this lesion is shown on the right. At the lesion border (surface), image spacing results in a dilution of lesion activity by background activity (spill-in). In the usual case of a hot lesion, this spill-in leads to underestimation of the average lesion activity. Conversely, some of the marginal lesion activity may be visualized outside of the true lesion border (spill-out), and the lesion may appear larger than it truly is (dotted line). (B) In a lesion with heterogeneous activity (illustrated by different grey values), image spacing leads to an underestimation of intralesional heterogeneity because each voxel only represents an average activity, and both maximum and minimum intensities are attenuated. The minimum spatial resolution is determined by the voxel size. In (B), the effects of spill-in and spill-out at the lesion border are disregarded for simplification.
Figure 5
Figure 5
Factors affecting PET interpretation.
Figure 6
Figure 6
Fused transaxial as well as coronal PET/CT slices through residual mediastinal lymphoma tissue of a 23-year-old female patient reconstructed with the OSEM algorithm (A,B) and with OSEM combined with TOF and PSF (C,D). While the lesional [18F]FDG uptake was defined as Deauville score 3 based on OSEM reconstruction, it would exceed the liver uptake when assessed based on images reconstructed with TOF and PSF (=Deauville score 4). This could alter the assessment from “adequate” to “inadequate” metabolic response.
Figure 7
Figure 7
Images of two [18F]FDG-PET/CT examinations in a 63-year-old man with hepatic and pulmonary aspergillosis. The earlier examination was performed with a scanner equipped with conventional photomultiplier tubes (PMT) and reconstructed with OSEM and TOF (AD). The second examination after 5 months used a SiPM-equipped PET scanner and PL reconstruction with a penalization factor beta of 450 (EH). Two pulmonary lesions that showed only moderate [18F]FDG uptake during the earlier examination (A,B) appeared substantially more intense on the second scan (E,F). However, uptake in hepatic lesions declined (not shown), and both pulmonary lesions were unaltered in the CT scan (C,G), which suggested that the higher conspicuity of the pulmonary lesions was a result of improved reconstructed spatial resolution and lesion contrast recovery (CR) with the SiPM scanner and PL reconstruction. Based on phantom measurements, reconstructed spatial resolution was estimated at 7.8 mm full width at half maximum (FWHM) with the PMT scanner and 4.7 mm with the SiPM scanner. The improvement in image sharpness can also be seen in the myocardium (D,H).

References

    1. Eskian M., Alavi A., Khorasanizadeh M., Viglianti B.L., Jacobsson H., Barwick T.D., Meysamie A., Yi S.K., Iwano S., Bybel B., et al. Effect of blood glucose level on standardized uptake value (SUV) in 18F- FDG PET-scan: A systematic review and meta-analysis of 20,807 individual SUV measurements. Eur. J. Nucl. Med. Mol. Imaging. 2019;46:224–237. doi: 10.1007/s00259-018-4194-x. - DOI - PubMed
    1. Keramida G., Peters A.M. FDG PET/CT of the non-malignant liver in an increasingly obese world population. Clin. Physiol. Funct. Imaging. 2020;40:304–319. doi: 10.1111/cpf.12651. - DOI - PubMed
    1. Sprinz C., Zanon M., Altmayer S., Watte G., Irion K., Marchiori E., Hochhegger B. Effects of blood glucose level on 18F fluorodeoxyglucose (18F-FDG) uptake for PET/CT in normal organs: An analysis on 5623 patients. Sci. Rep. 2018;8:2126. doi: 10.1038/s41598-018-20529-4. - DOI - PMC - PubMed
    1. Christen T., Sheikine Y., Rocha V.Z., Hurwitz S., Goldfine A.B., Di Carli M., Libby P. Increased glucose uptake in visceral versus subcutaneous adipose tissue revealed by PET imaging. JACC Cardiovasc. Imaging. 2010;3:843–851. doi: 10.1016/j.jcmg.2010.06.004. - DOI - PMC - PubMed
    1. Zhao J., Xue Q., Chen X., You Z., Wang Z., Yuan J., Liu H., Hu L. Evaluation of SUVlean consistency in FDG and PSMA PET/MR with Dixon-, James-, and Janma-based lean body mass correction. EJNMMI Phys. 2021;8:17. doi: 10.1186/s40658-021-00363-w. - DOI - PMC - PubMed

LinkOut - more resources