Identifying Mitotic Kinesins as Potential Prognostic Biomarkers in Ovarian Cancer Using Bioinformatic Analyses
- PMID: 35204562
- PMCID: PMC8871464
- DOI: 10.3390/diagnostics12020470
Identifying Mitotic Kinesins as Potential Prognostic Biomarkers in Ovarian Cancer Using Bioinformatic Analyses
Abstract
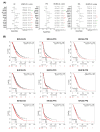
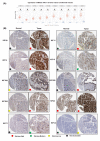
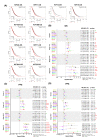
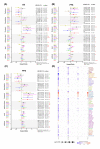
Ovarian cancer (OC) is characterized by late-stage presentation, chemoresistance, and poor survival. Evaluating the prognosis of OC patients via effective biomarkers is essential to manage OC progression and to improve survival; however, it has been barely established. Here, we intend to identify differentially expressed genes (DEGs) as potential prognostic biomarkers of OC via bioinformatic analyses. Initially, a total of thirteen DEGs were extracted from different public databases as candidates. The expression of KIF20A, one of the DEGs, was correlated with a worse outcome of OC patients. The functional correlation of the DEGs with mitosis and the prognostic value of KIF20A imply a high correlation between mitotic kinesins (KIFs) and OC development. Finally, we found that KIF20A, together with the other nine mitotic KIFs (4A, 11, 14, 15, 18A, 18B, 23, C1, and2C) were upregulated and activated in OC tissues. Among the ten, seven overexpressed mitotic KIFs (11, 14, 18B, 20A, 23, and C1) were correlated with unfavorable clinical prognosis. Moreover, KIF20A and KIF23 overexpression was associated with worse prognosis in OC patients treated with platinum/taxol chemotherapy, while OCs overexpressing mitotic KIFs (11, 15, 18B, and C1) were resistant to MAPK pathway inhibitors. In conclusion, worse outcomes of OC patients were correlated with overexpression of several mitotic KIFs, which may serve both as prognostic biomarkers and therapeutic targets for OC.
Keywords: bioinformatic analyses; mitotic kinesins; ovarian cancer; prognostic biomarkers; therapeutic targets.
Conflict of interest statement
TCGA belongs to the public database. Databases confirm that patients have consented to research use of data and samples. Users can download relevant data for free for research and publish relevant articles. Our study is based on open-source data, so there are no ethical issues and other conflict of interest.
Figures


Similar articles
-
Kinesin family members KIF2C/4A/10/11/14/18B/20A/23 predict poor prognosis and promote cell proliferation in hepatocellular carcinoma.Am J Transl Res. 2020 May 15;12(5):1614-1639. eCollection 2020. Am J Transl Res. 2020. PMID: 32509165 Free PMC article.
-
Identification of Novel Molecular Therapeutic Targets and Their Potential Prognostic Biomarkers Among Kinesin Superfamily of Proteins in Pancreatic Ductal Adenocarcinoma.Front Oncol. 2021 Sep 7;11:708900. doi: 10.3389/fonc.2021.708900. eCollection 2021. Front Oncol. 2021. PMID: 34557409 Free PMC article.
-
Overexpression of kinesin superfamily members as prognostic biomarkers of breast cancer.Cancer Cell Int. 2020 Apr 15;20:123. doi: 10.1186/s12935-020-01191-1. eCollection 2020. Cancer Cell Int. 2020. PMID: 32322170 Free PMC article.
-
Prognostic significance of KIF2A and KIF20A expression in human cancer: A systematic review and meta-analysis.Medicine (Baltimore). 2019 Nov;98(46):e18040. doi: 10.1097/MD.0000000000018040. Medicine (Baltimore). 2019. PMID: 31725680 Free PMC article.
-
Identifying the function of kinesin superfamily proteins in gastric cancer: Implications for signal transduction, clinical significance, and potential therapeutic approaches.Clin Res Hepatol Gastroenterol. 2025 May;49(5):102571. doi: 10.1016/j.clinre.2025.102571. Epub 2025 Mar 9. Clin Res Hepatol Gastroenterol. 2025. PMID: 40064398 Review.
Cited by
-
Identification of a Novel Gene Signature Based on Kinesin Family Members to Predict Prognosis in Glioma.Medicina (Kaunas). 2023 Feb 20;59(2):414. doi: 10.3390/medicina59020414. Medicina (Kaunas). 2023. PMID: 36837615 Free PMC article.
-
EFTUD2 is a promising diagnostic and prognostic indicator involved in the tumor immune microenvironment and glycolysis of lung adenocarcinoma.Front Oncol. 2025 Apr 1;15:1499217. doi: 10.3389/fonc.2025.1499217. eCollection 2025. Front Oncol. 2025. PMID: 40236649 Free PMC article.
-
KIF20A is a Prognostic Marker for Female Patients with Estrogen Receptor-Positive Breast Cancer and Receiving Tamoxifen as Adjuvant Endocrine Therapy.Int J Gen Med. 2023 Aug 21;16:3623-3635. doi: 10.2147/IJGM.S425918. eCollection 2023. Int J Gen Med. 2023. PMID: 37637711 Free PMC article.
-
Through the Looking Glass: Updated Insights on Ovarian Cancer Diagnostics.Diagnostics (Basel). 2023 Feb 14;13(4):713. doi: 10.3390/diagnostics13040713. Diagnostics (Basel). 2023. PMID: 36832201 Free PMC article. Review.
References
LinkOut - more resources
Full Text Sources

