. 2022 Feb 12;12(2):297.
doi: 10.3390/biom12020297.

Quantifying the Patterns of Metabolic Plasticity and Heterogeneity along the Epithelial-Hybrid-Mesenchymal Spectrum in Cancer

Affiliations

Quantifying the Patterns of Metabolic Plasticity and Heterogeneity along the Epithelial-Hybrid-Mesenchymal Spectrum in Cancer

Srinath Muralidharan et al. Biomolecules. .

Abstract

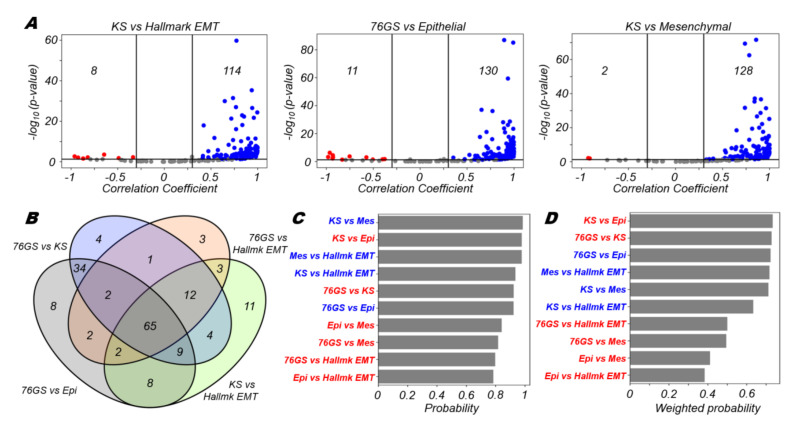
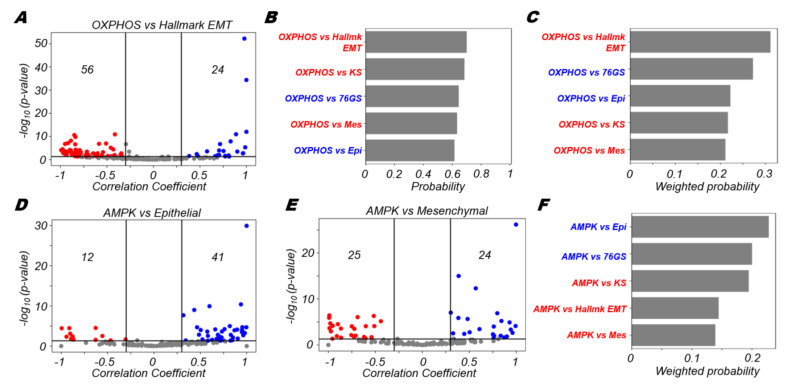
Cancer metastasis is the leading cause of cancer-related mortality and the process of the epithelial-to-mesenchymal transition (EMT) is crucial for cancer metastasis. Both partial and complete EMT have been reported to influence the metabolic plasticity of cancer cells in terms of switching among the oxidative phosphorylation, fatty acid oxidation and glycolysis pathways. However, a comprehensive analysis of these major metabolic pathways and their associations with EMT across different cancers is lacking. Here, we analyse more than 180 cancer cell datasets and show the diverse associations of these metabolic pathways with the EMT status of cancer cells. Our bulk data analysis shows that EMT generally positively correlates with glycolysis but negatively with oxidative phosphorylation and fatty acid metabolism. These correlations are also consistent at the level of their molecular master regulators, namely AMPK and HIF1α. Yet, these associations are shown to not be universal. The analysis of single-cell data for EMT induction shows dynamic changes along the different axes of metabolic pathways, consistent with general trends seen in bulk samples. Further, assessing the association of EMT and metabolic activity with patient survival shows that a higher extent of EMT and glycolysis predicts a worse prognosis in many cancers. Together, our results reveal the underlying patterns of metabolic plasticity and heterogeneity as cancer cells traverse through the epithelial-hybrid-mesenchymal spectrum of states.

Keywords: AMPK; HIF1α; cancer metabolism; epithelial–mesenchymal transition; fatty acid metabolism; glycolysis; oxidative phosphorylation.


Conflict of interest statement

The authors declare no conflict of interest.

Figures

Figure 1
Figure 1
Consistency between different EMT scoring metrics. (A) Volcano plots depicting the Pearson correlation coefficient and the −log10(p-value) for 3 pairs of EMT scoring metrics: KS vs Hallmark EMT, 76GS vs epithelial and KS vs mesenchymal. Vertical boundaries are set at correlation coefficients −0.3 and 0.3. The cut-off for p-value is set at 0.05. (B) Four-way Venn diagram for comparison of 4 representative pairs of EMT scoring metrics. (C) Probability of a dataset having a positive (blue) or a negative (red) correlation (correlation coefficient > 0.3) given that it is significant (p-value < 0.05) for different pairs of EMT scoring metrics. (D) Probability of a dataset having a positive (blue) or a negative (red) correlation (correlation coefficient > 0.3) given that it is significant (p-value < 0.05) weighted by the fraction of significant cases for different pairs of EMT scoring metrics.
Figure 2
Figure 2
OXPHOS is more likely to correlate negatively with EMT. (A) Volcano plots depicting the Pearson correlation coefficient and the −log10(p-value) for hallmark OXPHOS and hallmark EMT signatures. (B) Probability of a dataset having a positive (blue) or a negative (red) correlation (correlation coefficient > 0.3) given that it is significant (p-value < 0.05) for OXPHOS and different EMT scoring metrics. (C) Probability of a dataset having a positive (blue) or a negative (red) correlation (correlation coefficient > 0.3) given that it is significant (p-value < 0.05) weighted by the fraction of significant cases for OXPHOS and different EMT scoring metrics. Volcano plots depicting the Pearson correlation coefficient and the −log10(p-value) for (D) AMPK signature and epithelial signature, (E) AMPK signature and mesenchymal signature. (F) Probability of a dataset having a positive (blue) or a negative (red) correlation (correlation coefficient > 0.3) given that it is significant (p-value < 0.05) weighted by the fraction of significant cases for AMPK signature and different EMT scoring metrics. Vertical boundaries for volcano plots are set at correlation coefficients −0.3 and 0.3. The cut-off for p-value is set at 0.05.
Figure 3
Figure 3
Glycolysis is more likely to correlate positively with EMT. (A) Volcano plots depicting the Pearson correlation coefficient and the −log10(p-value) for hallmark glycolysis and hallmark EMT signatures. (B) Probability of a dataset having a positive (blue) or a negative (red) correlation (correlation coefficient > 0.3) given that it is significant (p-value < 0.05) for glycolysis and different EMT scoring metrics. (C) Probability of a dataset having a positive (blue) or a negative (red) correlation (correlation coefficient > 0.3) given that it is significant (p-value < 0.05) weighted by the fraction of significant cases for glycolysis and different EMT scoring metrics. Volcano plots depicting the Pearson correlation coefficient and the −log10(p-value) for (D) HIF1α signature and epithelial signature, (E) HIF1α signature and mesenchymal signature. (F) Probability of a dataset having a positive (blue) or a negative (red) correlation (correlation coefficient > 0.3) given that it is significant (p-value < 0.05) weighted by the fraction of significant cases for HIF1α signature and different EMT scoring metrics. Vertical boundaries for volcano plots are set at correlation coefficients −0.3 and 0.3. The cut-off for p-value is set at 0.05.
Figure 4
Figure 4
Fatty acid oxidation is more likely to correlate negatively with EMT. (A) Volcano plots depicting the Pearson correlation coefficient and the −log10(p-value) for fatty acid oxidation (FAO) and hallmark EMT signatures. (B) Same as (A) but for FAO and epithelial signature. (C) Same as (A) but for FAO and mesenchymal signature. (D) (top) Probability of a dataset having a positive (blue) or a negative (red) correlation (correlation coefficient > 0.3) given that it is significant (p-value < 0.05) for FAO and different EMT scoring metrics. (bottom) Probability of a dataset having a positive (blue) or a negative (red) correlation (correlation coefficient > 0.3) given that it is significant (p-value < 0.05) weighted by the fraction of significant cases for FAO and different EMT scoring metrics. Vertical boundaries for volcano plots are set at correlation coefficients −0.3 and 0.3. The cut-off for p-value is set at 0.05.
Figure 5
Figure 5
Varied associations between different metabolic axes with the EMT. (A) Proportion of datasets that have a given number of metabolic axes significantly correlated with the hallmark EMT signature (p-value < 0.05). Scatter plot of correlation coefficients of (B) OXPHOS with the EMT and glycolysis with the EMT, (C) OXPHOS with the EMT and FAO with the EMT and (D) glycolysis with the EMT and FAO with the EMT.
Figure 6
Figure 6
Metabolic signatures in single cell RNA-seq data upon EMT induction. Box plots for ssGSEA scores of hallmark EMT and metabolic signatures—glycolysis, OXPHOS and fatty acid oxidation—at day 0 (untreated) and day 7 (upon TGFβ treatment) and day 3 withdrawal of TGFβ (after 7 day treatment) for different cell lines: (A) DU145 (B) OVCA420. ‘ns’ indicates non-significant (p > 0.05); *: p < 0.05 using a Students’ t-test.
Figure 7
Figure 7
Survival metrics for metabolic signatures in TCGA samples. (A) Plot of log2 hazard ratio (HR; mean ± 95% confidence interval) comparing overall survival (OS) with EMT, glycolysis and OXPHOS ssGSEA scores for different TCGA cancers and cohorts. p-values are based on log-rank test, and those with significant differences (p < 0.05) are marked with an asterisk (*). (B) Heatmap of log2 hazard ratio in different combinations of EMT, glycolysis, and OXPHOS when the reference is E-G-O- (EMT low/glycolysis low/OXPHOS low). Blue depicts HR < 1 and red depicts HR > 1; higher values are represented by more intense colours.

References

    1. Kalluri R., Weinberg R.A. The basics of epithelial-mesenchymal transition. J. Clin. Investig. 2009;119:1420–1428. doi: 10.1172/JCI39104. - DOI - PMC - PubMed
    1. Thiery J.P., Acloque H., Huang R.Y.J., Nieto M.A. Epithelial-mesenchymal transitions in development and disease. Cell. 2009;139:871–890. doi: 10.1016/j.cell.2009.11.007. - DOI - PubMed
    1. Celià-Terrassa T., Jolly M.K. Cancer Stem Cells and Epithelial-to-Mesenchymal Transition in Cancer Metastasis. Cold Spring Harb. Perspect. Med. 2020;10:a036905. doi: 10.1101/cshperspect.a036905. - DOI - PMC - PubMed
    1. Jolly M.K., Ware K.E., Gilja S., Somarelli J.A., Levine H. EMT and MET: Necessary or permissive for metastasis? Mol. Oncol. 2017;11:755–769. doi: 10.1002/1878-0261.12083. - DOI - PMC - PubMed
    1. Sahoo S., Nayak S.P., Hari K., Purkait P., Mandal S., Kishore A., Levine H., Jolly M.K. Immunosuppressive traits of the hybrid epithelial/mesenchymal phenotype. Front. Immunol. 2021;12:797261. doi: 10.3389/fimmu.2021.797261. - DOI - PMC - PubMed

Publication types