. 2022 Feb 14;12(2):307.
doi: 10.3390/biom12020307.

Drosophila melanogaster as a Model Organism for Obesity and Type-2 Diabetes Mellitus by Applying High-Sugar and High-Fat Diets

Affiliations

Drosophila melanogaster as a Model Organism for Obesity and Type-2 Diabetes Mellitus by Applying High-Sugar and High-Fat Diets

Nieves Baenas et al. Biomolecules. .

Abstract

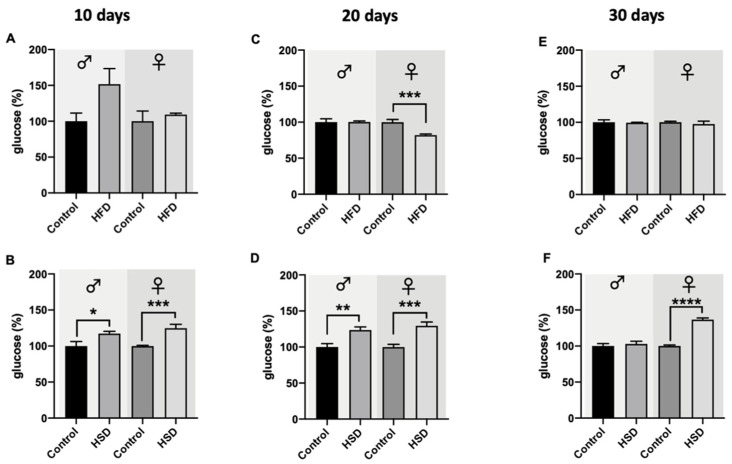
Several studies have been published introducing Drosophila melanogaster as a research model to investigate the effects of high-calorie diets on metabolic dysfunctions. However, differences between the use of high-sugar diets (HSD) and high-fat diets (HFD) to affect fly physiology, as well as the influence on sex and age, have been seldom described. Thus, the aim of the present work was to investigate and compare the effects of HSD (30% sucrose) and HFD (15% coconut oil) on symptoms of metabolic dysfunction related to obesity and type-2 diabetes mellitus, including weight gain, survival, climbing ability, glucose and triglycerides accumulation and expression levels of Drosophila insulin-like peptides (dIlps). Female and male flies were subjected to HSD and HFD for 10, 20 and 30 days. The obtained results showed clear differences in the effects of both diets on survival, glucose and triglyceride accumulation and dIlps expression, being gender and age determinant. The present study also suggested that weight gain does not seem to be an appropriate parameter to define fly obesity, since other characteristics appear to be more meaningful in the development of obesity phenotypes. Taken together, the results demonstrate a key role for both diets, HSD and HFD, to induce an obese fly phenotype with associated diseases. However, further studies are needed to elucidate the underlying molecular mechanisms how both diets differently affect fly metabolism.

Keywords: fruit fly; metabolic dysfunction; obesity diets; obesity-related diseases.


Conflict of interest statement

The authors declare no conflict of interest.

Figures

Figure 1
Figure 1
Survival rates of w1118 Drosophila melanogaster on different diets. Male flies being reared on a high-fat diet (HFD) for 30 days did not show differences in survival rates compared to male flies on a control diet (A). Female flies reared on a HFD for 30 days exhibited a significant decrease in their survival rates compared to the corresponding controls (B). The survival rates of male (C) and female (D) flies significantly decreased by feeding a high-sugar diet (HSD) in comparison to flies fed a control diet. Data represent the mean from three biological replicates (n = 75). **** indicates significant differences (p < 0.0001) calculated by the log-rank test.
Figure 2
Figure 2
The weights of w1118 Drosophila melanogaster exposed to different diets and time periods. Bars show the mean weights of male (A) and female (B) flies reared on a high-fat diet (HFD) and male (C) and female (D) flies on a high-sugar diet (HSD) on days 10, 20 and 30, respectively. Data are presented as mean ± SEM from three biological replicates (n = 75).
Figure 3
Figure 3
The climbing ability of w1118 Drosophila melanogaster being reared on different diets and time periods. The exposure of male flies to a high-fat diet (HFD) for 10 and 30 days significantly decreased the flies’ climbing ability compared to the flies on a control diet, while after 20 days on HFD no significant changes were detected (A). In female flies, 10-, 20- and 30-day treatment with HSD resulted in a significant decrease in the climbing index compared to the corresponding control flies (B). Male flies on a high-sugar diet (HSD) exhibited a significant decrease in their climbing ability compared to flies on a control diet after 10 and 20 days while this difference was not present after HSD exposure for 30 days (C). Feeding female flies HSD for 10, 20 and 30 days resulted in a significant decrease in their climbing index compared to flies on a control diet (D). Bars present the mean ± SEM from three biological replicates (n = 30). * (p < 0.05) and **** (p < 0.0001) indicates significant differences compared to the corresponding control flies calculated by an unpaired t-test or Mann–Whitney test (non-parametric).
Figure 4
Figure 4
Glucose levels of whole-fly extracts from w1118 Drosophila melanogaster. In both male and female flies reared on a high-fat diet (HFD) for 10 days (A), the glucose levels did not differ compared to the flies on a control diet. Male and female flies fed a high-sugar diet (HSD) for 10 days (B) exhibited a significant upregulation of the glucose levels compared to the corresponding control flies. After 20 days on HFD, the glucose levels in male flies remained at a similar level as the control flies, while female flies on HFD exhibited significantly lower glucose levels in comparison to control flies (C). Male and female Drosophila melanogaster reared on HSD for 20 days significantly increased their glucose levels compared to the corresponding control flies (D). After 30 days on HFD, no changes in comparison to control flies regarding glucose levels in male and female flies were detected (E). In male flies, treatment with HSD for 30 days did not affect the flies’ glucose levels, while in female flies, a significant increase in glucose levels compared to control animals was observed (F). Bars represent the mean ± SEM from three biological replicates (n = 3 × 5 flies). * (p < 0.05), ** (p < 0.01), *** (p < 0.001) and **** (p < 0.0001) indicates significant differences compared to the corresponding control flies calculated by an unpaired t-test.
Figure 5
Figure 5
Triglyceride (TAG) levels of whole-fly extracts from w1118 Drosophila melanogaster. In both male and female flies reared on a high-fat diet (HFD) for 10 days (A), TAG levels were significantly increased compared to the corresponding control flies. Male and female flies fed a high-sugar diet (HSD) for 10 days did not show any changes compared to flies on a control diet (B). After 20 days on HFD (C) and HSD (D), TAG levels in male and female flies significantly increased compared to control animals. TAG levels significantly increased compared to flies on a control diet in both male and female Drosophila melanogaster on HFD for 30 days (E). In male flies, treatment with HSD for 30 days did not affect the flies’ TAG levels, while in female flies, a significant increase in TAG levels compared to control animals was present (F). Bars represent the mean ± SEM from three biological replicates (n = 3 × 5 flies). * (p < 0.05), *** (p < 0.001) and **** (p < 0.0001) indicate significant differences compared to the corresponding control flies calculated by an unpaired t-test and a Mann–Whitney test (non-parametric), respectively.
Figure 6
Figure 6
Relative mRNA expression levels of Drosophila insulin-like peptides (DILPs) in w1118 flies reared on either a control diet, high-fat diet (HFD) or high-sugar diet (HSD) for 30 days. HFD significantly increased the relative mRNA levels of dIlp2 in male and female flies, while HSD feeding did not affect dIlp2 levels compared to the corresponding controls (A). In male flies, HFD but not HSD significantly increased dIlp3 levels in comparison to flies on a control diet, while in female flies, neither HSD nor HFD caused significant changes in comparison to the controls (B). The relative expression levels of dIlp5 were not affected by either HSD or HFD in both male and female flies (C). With regard to the relative mRNA levels of dIlp6, HSD significantly decreased dIlp6 in male flies, while in female flies, HFD significantly increased the dIlp6 levels in comparison to control animals (D). Bars represent the mean ± SEM from three biological replicates (n = 3 × 7 flies). * (p < 0.05) indicates significant differences compared to the corresponding control flies calculated by ANOVA or Kruskal-Wallis test, followed either by Dunnett’s or Bonferroni’s post-hoc test, or Dunn’s test, respectively.

References

    1. WHO World Health Organization Obesity and Overweight. [(accessed on 5 January 2022)]. Available online: https://www.who.int/en/news-room/fact-sheets/detail/obesity-and-overweight.
    1. Zhang Y., Liu J., Yao J., Ji G., Qian L., Wang J., Zhang G., Tian J., Nie Y., Zhang Y.E., et al. Obesity: Pathophysiology and intervention. Nutrients. 2014;6:5153–5183. doi: 10.3390/nu6115153. - DOI - PMC - PubMed
    1. Reiter L.T., Potocki L., Chien S., Gribskov M., Bier E. A systematic analysis of human disease-associated gene sequences in Drosophila melanogaster. Genome Res. 2001;11:1114–1125. doi: 10.1101/gr.169101. - DOI - PMC - PubMed
    1. Trinh I., Boulianne G.L. Modeling Obesity and Its Associated Disorders in Drosophila. Physiology. 2013;28:117. doi: 10.1152/physiol.00025.2012. - DOI - PMC - PubMed
    1. Koyama T., Texada M.J., Halberg K.A., Rewitz K. Metabolism and growth adaptation to environmental conditions in Drosophila. Cell Mol. Life Sci. 2020;77:4523–4551. doi: 10.1007/s00018-020-03547-2. - DOI - PMC - PubMed

Publication types

LinkOut - more resources