. 2022 Feb 8;11(2):260.
doi: 10.3390/biology11020260.

DRPPM-EASY: A Web-Based Framework for Integrative Analysis of Multi-Omics Cancer Datasets

Affiliations

DRPPM-EASY: A Web-Based Framework for Integrative Analysis of Multi-Omics Cancer Datasets

Alyssa Obermayer et al. Biology (Basel). .

Abstract

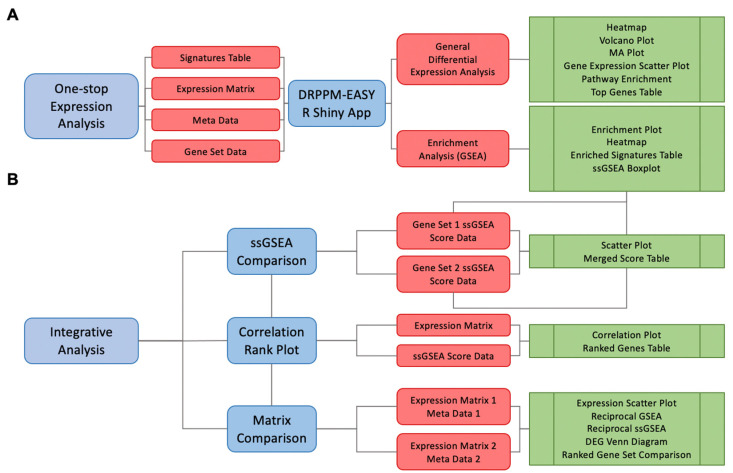
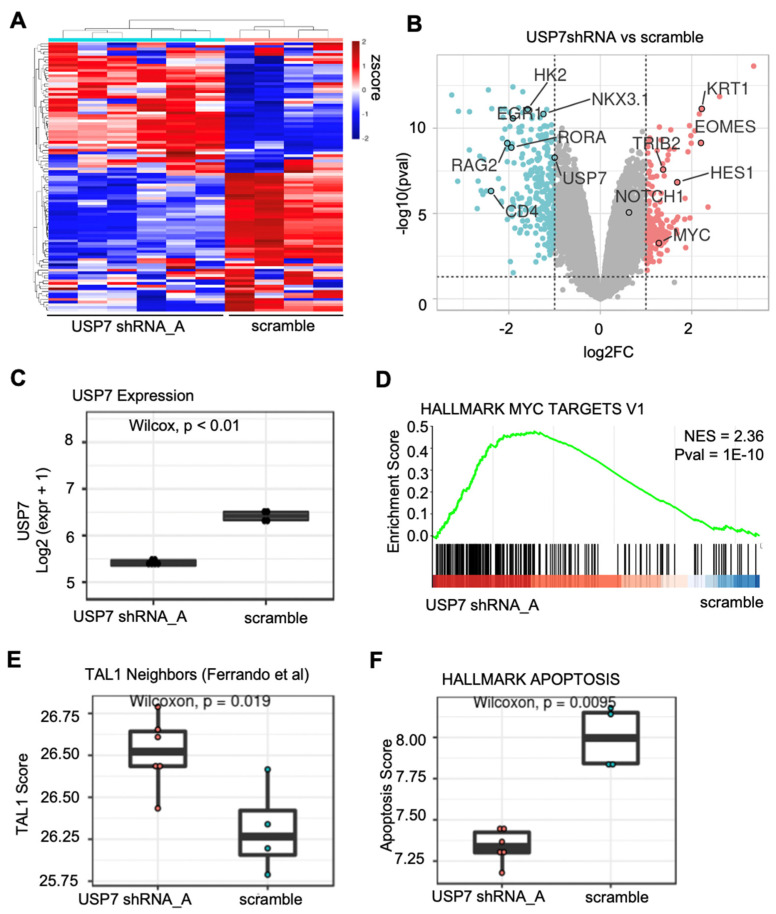
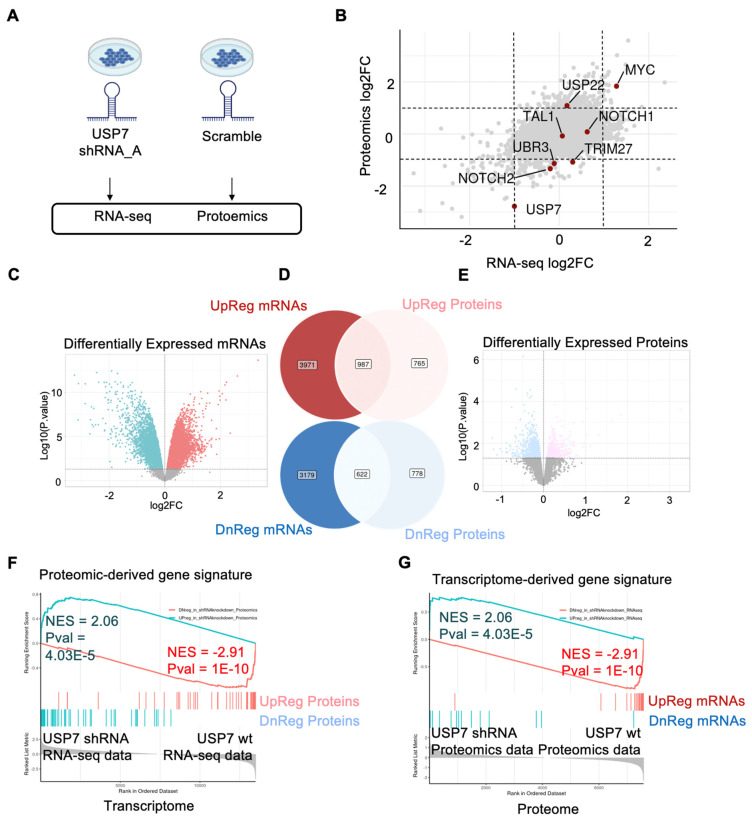
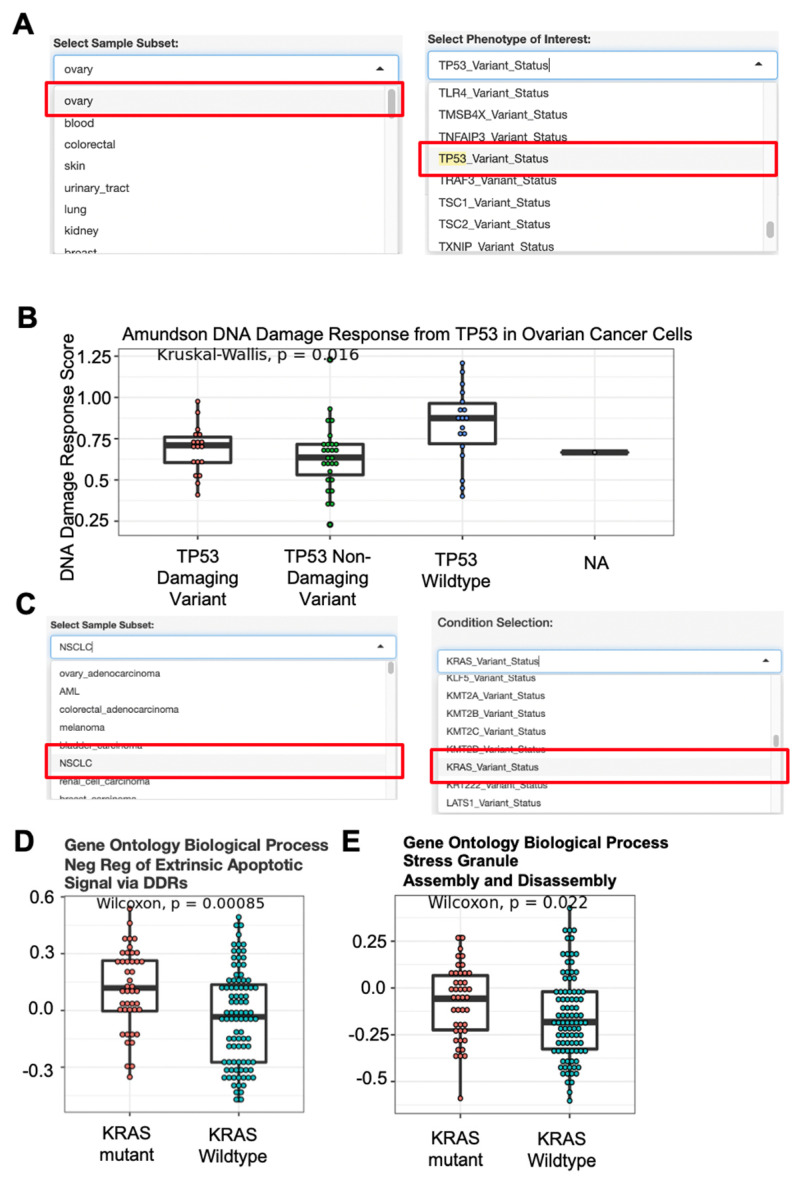
High-throughput transcriptomic and proteomic analyses are now routinely applied to study cancer biology. However, complex omics integration remains challenging and often time-consuming. Here, we developed DRPPM-EASY, an R Shiny framework for integrative multi-omics analysis. We applied our application to analyze RNA-seq data generated from a USP7 knockdown in T-cell acute lymphoblastic leukemia (T-ALL) cell line, which identified upregulated expression of a TAL1-associated proliferative signature in T-cell acute lymphoblastic leukemia cell lines. Next, we performed proteomic profiling of the USP7 knockdown samples. Through DRPPM-EASY-Integration, we performed a concurrent analysis of the transcriptome and proteome and identified consistent disruption of the protein degradation machinery and spliceosome in samples with USP7 silencing. To further illustrate the utility of the R Shiny framework, we developed DRPPM-EASY-CCLE, a Shiny extension preloaded with the Cancer Cell Line Encyclopedia (CCLE) data. The DRPPM-EASY-CCLE app facilitates the sample querying and phenotype assignment by incorporating meta information, such as genetic mutation, metastasis status, sex, and collection site. As proof of concept, we verified the expression of TP53 associated DNA damage signature in TP53 mutated ovary cancer cells. Altogether, our open-source application provides an easy-to-use framework for omics exploration and discovery.

Keywords: CCLE; R Shiny application; RNA-seq; T-cell acute lymphoblastic leukemia; multi-omics analysis; proteomics.


Conflict of interest statement

The funders had no role in the design of the study; in the collection, analyses, or interpretation of data; in the writing of the manuscript, or in the decision to publish the results.

Figures

Figure 1
Figure 1
DRPPM-EASY expression analysis pipeline. (A) Schematic workflow of DRPPM-EASY. The pipeline takes in input files of an expression matrix, a sample meta-file specifying sample grouping, and a gene set database for GSEA. A GSEA enriched signature table is generated as a preprocessing step, which is used as input to the R Shiny app. The app generates two modes of exploring the data: (1) general differential gene expression analysis and (2) gene set enrichment analysis. The result from the analysis can be downloaded as output tables. (B) Schematic of the integrative analysis with three major features for pathway signature comparison. The app has three modes of integrative analysis: (1) scatter plot mode, (2) correlation plot mode, and (3) paired multi-omics analysis.
Figure 2
Figure 2
Expression analysis example of RNA-seq data USP7 silenced Jurkat cells. (A) Unsupervised clustering of the RNA sequencing data using the top 100 genes ranked based on mean absolute deviation (MAD). (B) Differential gene expression analysis comparing USP7 knockdown and scramble. Genes upregulated after USP7 knockdown are shown in red and genes downregulated after USP7 knockdown are shown in blue (USP7-associated targets). (C) Boxplot showing the USP7 expression in log2 FPKM. (D) Gene set enrichment analysis of MYC targets. (E) Boxplot showing the single sample GSVA analysis of the TAL1 gene set. (F) Boxplot showing the single sample GSVA analysis of the Hallmark Apoptosis gene set.
Figure 3
Figure 3
Integrated analysis example of proteomics and transcriptomics USP7 silenced Jurkat cells. (A) Jurkat samples treated with USP7 shRNA and scramble were profiled by RNA sequencing and TMT mass spectrometry. (B) The log2 fold change from the differential expression analyses is plotted. Positive log2FC indicates upregulated expression after USP7 silencing. Negative log2FC indicates downregulated expression after USP7 knockdown. Dotted line indicates the −1 and 1 log2FC cutoff. (C) Upregulated and downregulated gene signatures derived from differentially expressed mRNAs. (D) Venn diagram of genes differentially upregulated (top panel) and downregulated (bottom panel) in the transcriptome (left) and proteome (right). (E) Up-regulated and downregulated gene signatures derived from differentially expressed proteins. (F,G) Reciprocal GSEA of differentially expressed genes derived from the transcriptome and examined in the proteomics data (F). Similarly, differentially expressed proteins were first derived then examined in the transcriptome data by GSEA (G).
Figure 4
Figure 4
Use case analysis example of CCLE Expression data. (A) Drop-down menu selection of sample cohort and sample phenotype characteristic. CCLE ovary samples and TP53 mutation status were selected from the drop-down menu option. (B) Single-sample GSEA analysis of genes defining the DNA damage response by Amundson et al. Analyzed samples were selected from the drop-down menu from (A). (C) Drop-down menu selection of sample cohort and sample phenotype characteristic. CCLE non-small cell lung cancer samples and phenotype associated with the KRAS mutation status were selected from the drop-down menu option. (D) Single sample GSEA analysis of genes negatively regulating the DNA damage response. (E) Single sample GSEA of genes defining the stress granule assembly and disassembly. Gene sets were compiled from Biological Pathways from the Gene Ontology database (GOBP). Analyzed samples were selected from the drop-down menu from (C).

References

    1. De Anda-Jauregui G., Hernandez-Lemus E. Computational Oncology in the Multi-Omics Era: State of the Art. Front. Oncol. 2020;10:423. doi: 10.3389/fonc.2020.00423. - DOI - PMC - PubMed
    1. Menyhart O., Gyorffy B. Multi-omics approaches in cancer research with applications in tumor subtyping, prognosis, and diagnosis. Comput. Struct. Biotechnol. J. 2021;19:949–960. doi: 10.1016/j.csbj.2021.01.009. - DOI - PMC - PubMed
    1. Chai A.W.Y., Tan A.C., Cheong S.C. Uncovering drug repurposing candidates for head and neck cancers: Insights from systematic pharmacogenomics data analysis. Sci. Rep. 2021;11:23933. doi: 10.1038/s41598-021-03418-1. - DOI - PMC - PubMed
    1. Edgar R., Domrachev M., Lash A.E. Gene Expression Omnibus: NCBI gene expression and hybridization array data repository. Nucleic Acids Res. 2002;30:207–210. doi: 10.1093/nar/30.1.207. - DOI - PMC - PubMed
    1. Barrett T., Wilhite S.E., Ledoux P., Evangelista C., Kim I.F., Tomashevsky M., Marshall K.A., Phillippy K.H., Sherman P.M., Holko M., et al. NCBI GEO: Archive for functional genomics data sets—Update. Nucleic Acids Res. 2013;41:D991–D995. doi: 10.1093/nar/gks1193. - DOI - PMC - PubMed