. 2022 Feb 12;11(2):301.
doi: 10.3390/biology11020301.

Blue Laser Irradiation Decreases the ATP Level in Mouse Skin and Increases the Production of Superoxide Anion and Hypochlorous Acid in Mouse Fibroblasts

Affiliations

Blue Laser Irradiation Decreases the ATP Level in Mouse Skin and Increases the Production of Superoxide Anion and Hypochlorous Acid in Mouse Fibroblasts

Eiko Nakayama et al. Biology (Basel). .

Abstract

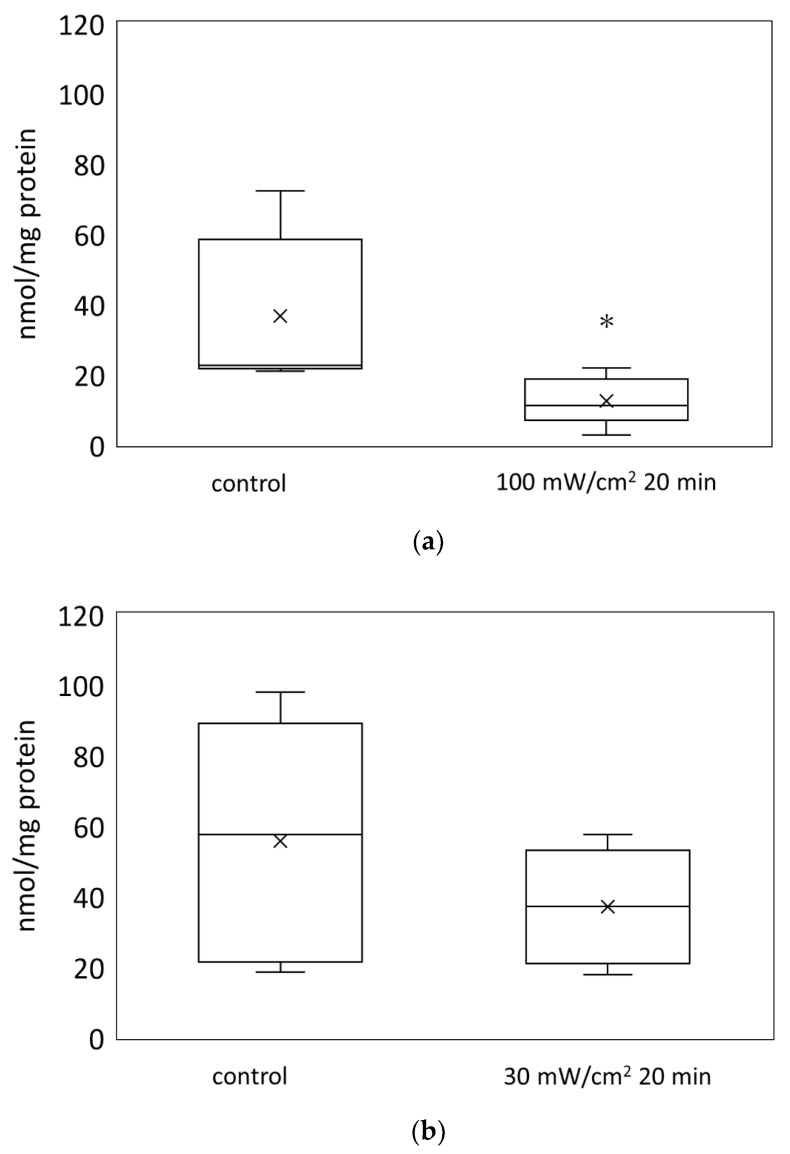
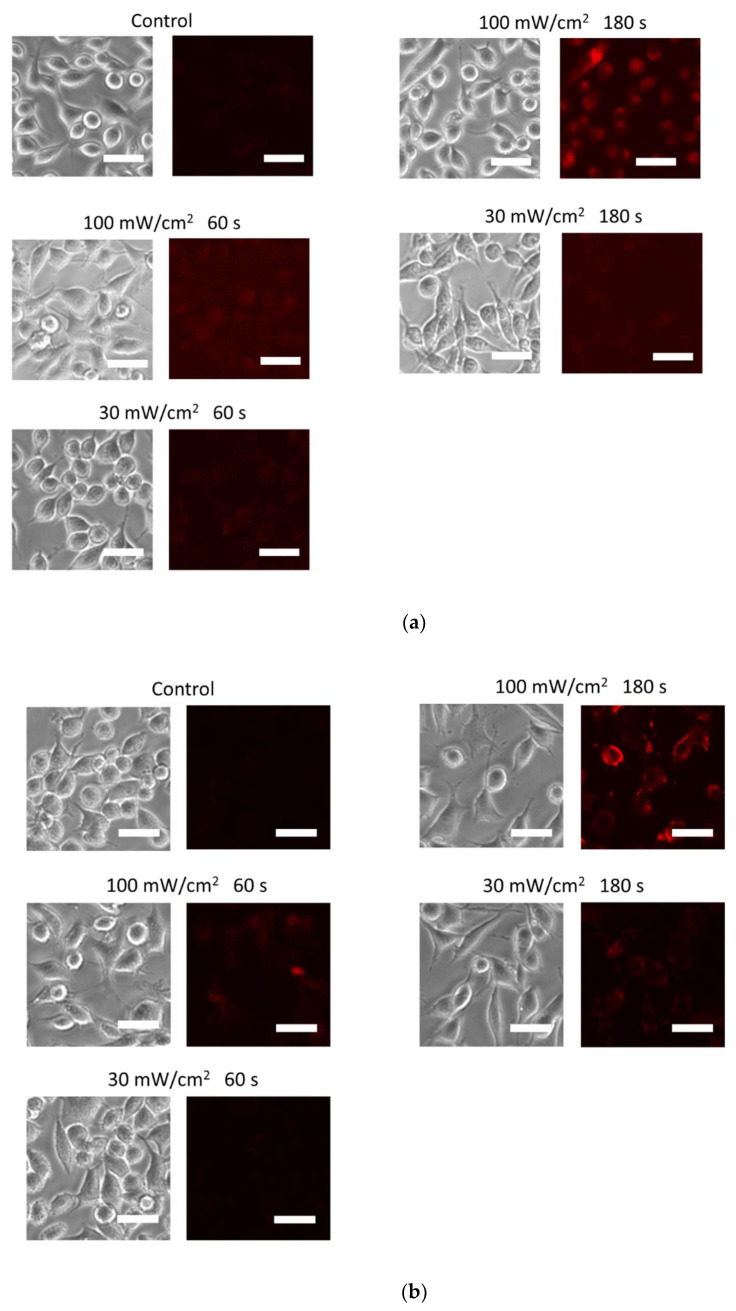
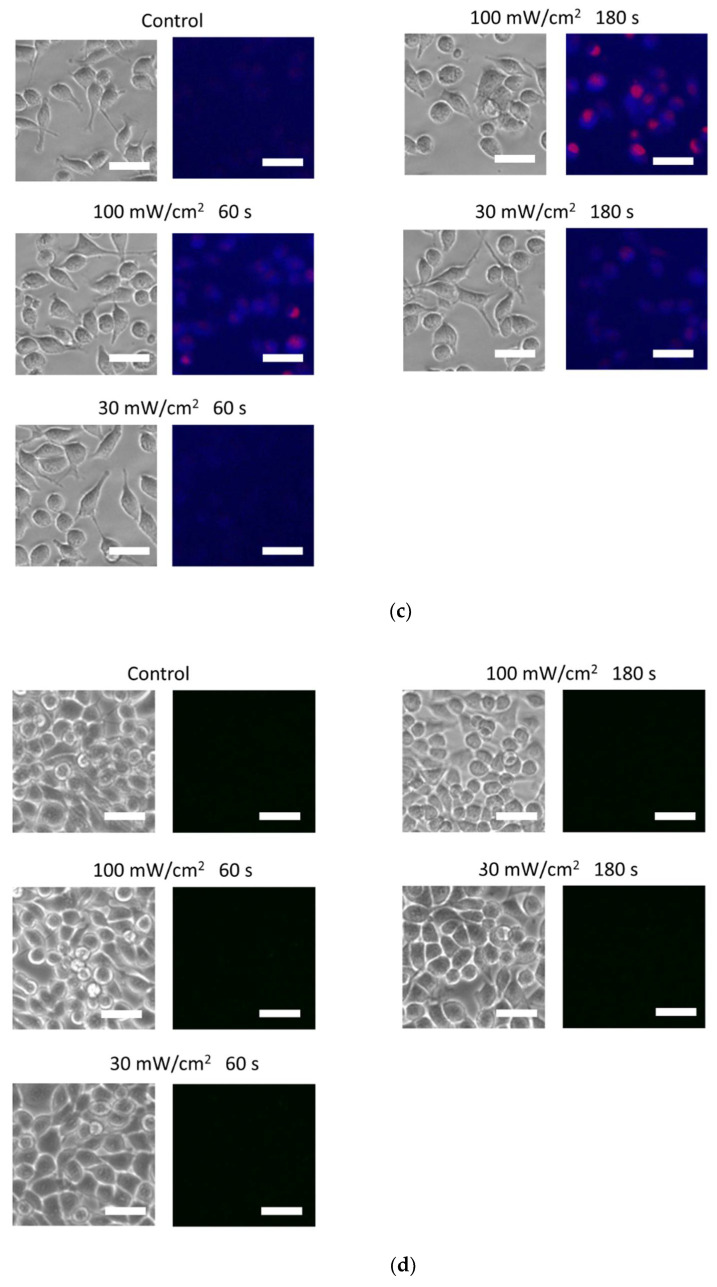
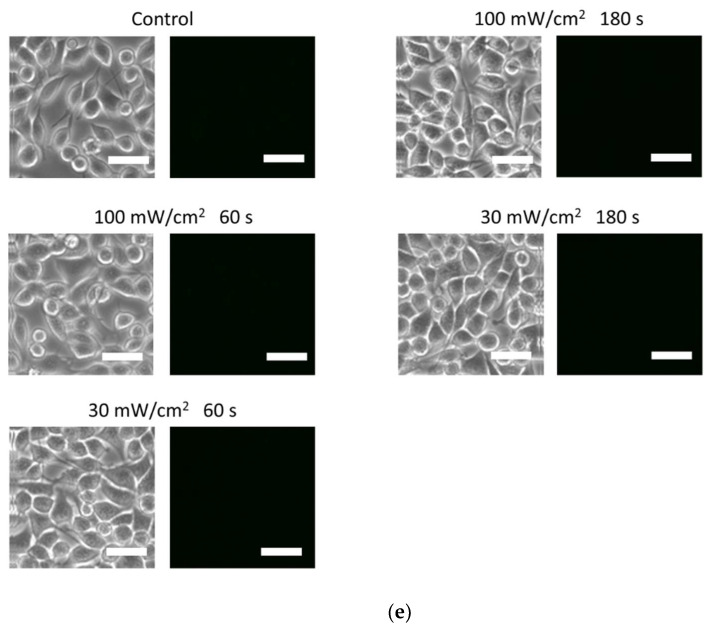
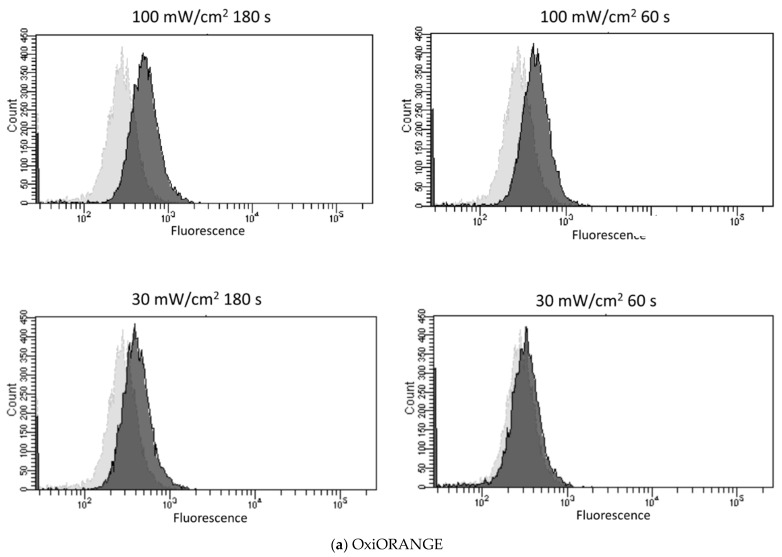
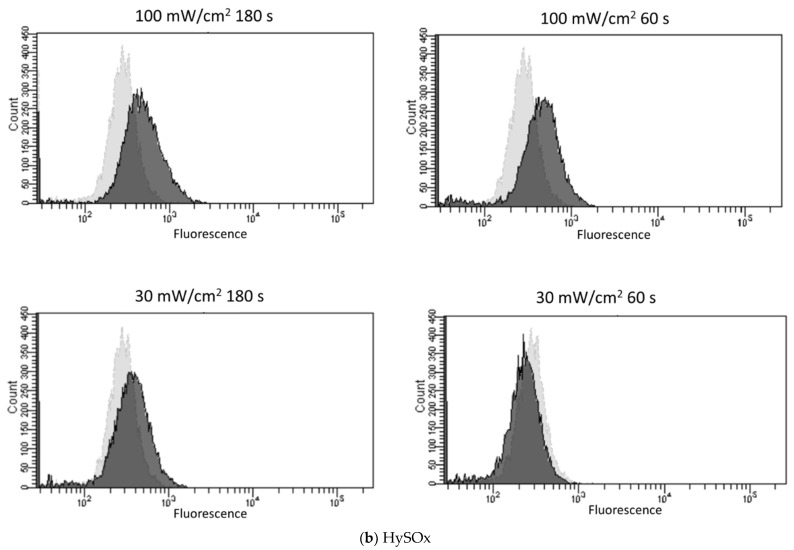
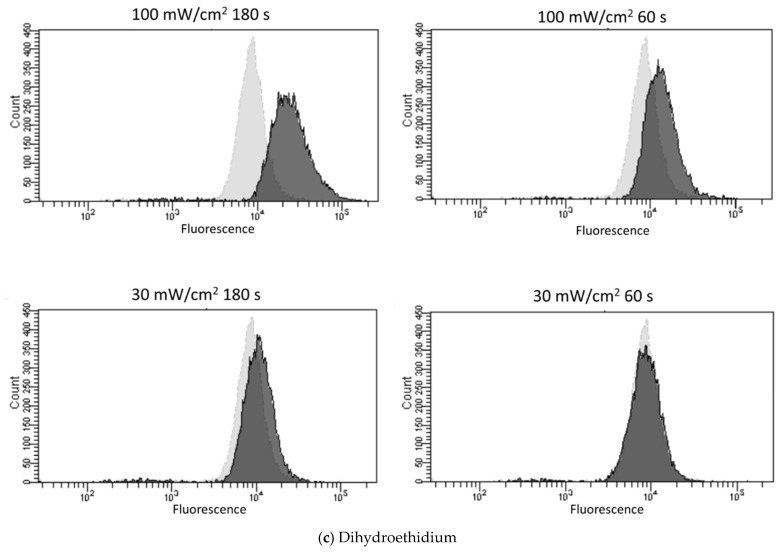
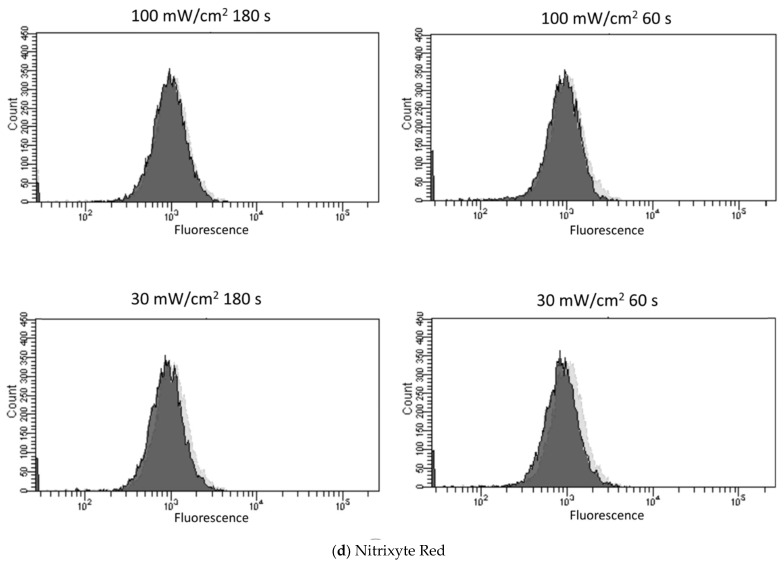
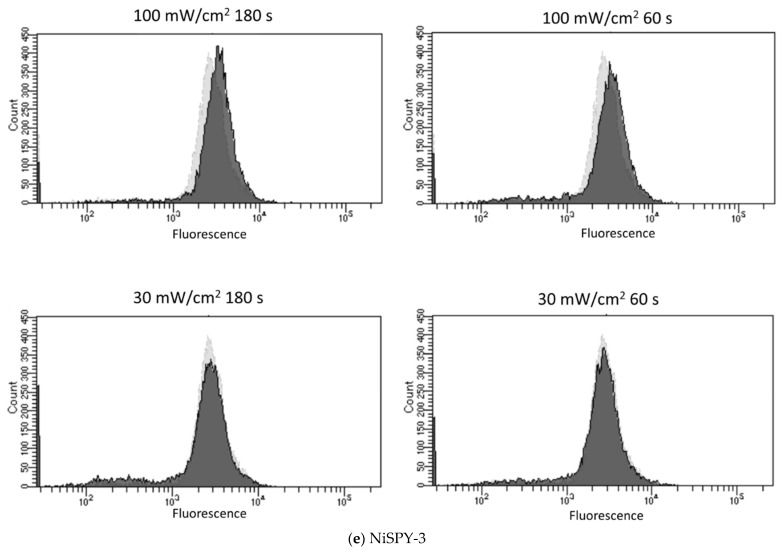
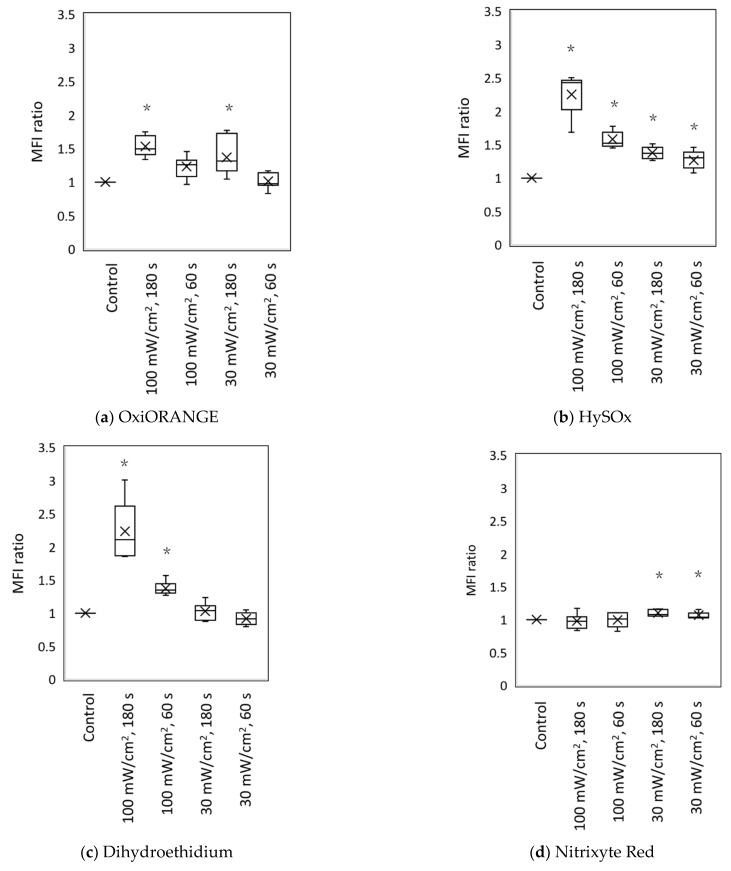
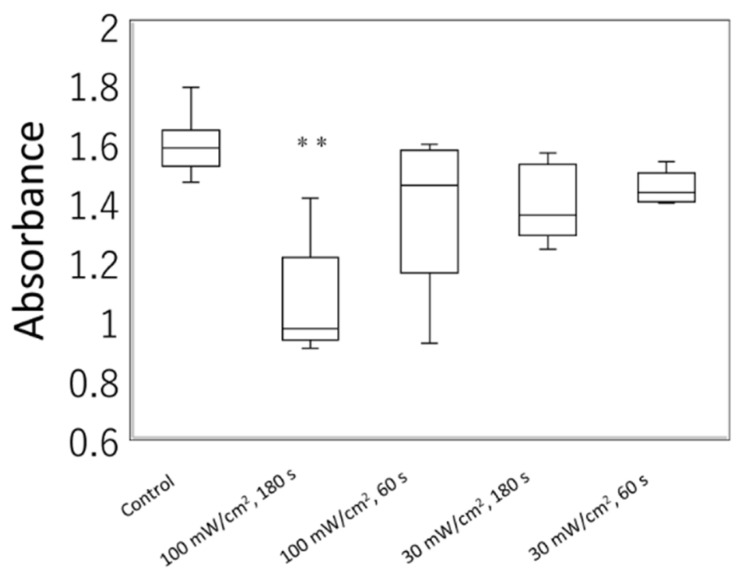
Photobiomodulation studies have reported that blue light irradiation induces the production of reactive oxygen species. We investigated the effect of blue laser (405 nm) irradiation on the ATP levels in mouse skin and determined the types of reactive oxygen species and reactive nitrogen species using cultured mouse fibroblasts. Blue laser irradiation caused a decrease in the ATP level in the mouse skin and triggered the generation of superoxide anion and hypochlorous acid, whereas nitric oxide and peroxynitrite were not detected. Moreover, blue laser irradiation resulted in reduced cell viability. It is believed that the decrease in the skin ATP level due to blue light irradiation results from the increased levels of oxidative stress due to the generation of reactive oxygen species. This method of systematically measuring the levels of reactive oxygen species and reactive nitrogen species may be useful for understanding the effects of irradiation conditions.

Keywords: ATP; laser; photobiomodulation; reactive nitrogen species; reactive oxygen species.


Conflict of interest statement

The authors declare no conflict of interest.

Figures

Figure 1
Figure 1
The ATP levels in the mouse skin after blue laser irradiation. The ATP levels in the mouse skin were measured using firefly luciferase luminescence assay. The irradiation conditions were (a) 100 mW/cm2, 20 min, 120 J and (b) 30 mW/cm2, 20 min, 36 J. * p < 0.05 against the control group.
Figure 2
Figure 2
ROS and RNS generation after blue laser irradiation. Five fluorescent probes were incorporated into the L929 mouse fibroblasts. The cells were irradiated with a blue laser (405 nm), and the generation of ROS and RNS was evaluated using fluorescence microscopy. Phase-contrast microscopic images of the same sites are presented beside the fluorescent microscopic images. The fluorescent probes used were (a) OxiORANGE (detects •OH and HClO), (b) HySOx (detects HClO), (c) dihydroethidium (detects O2•), (d) Nitrixyte Red (detects NO•), and (e) NiSPY-3 (detects ONOO). The irradiation conditions were as follows: (1) control, no laser irradiation; (2) 100 mW/cm2, 180 s, 18 J; (3) 100 mW/cm2, 60 s, 6 J; (4) 30 mW/cm2, 180 s, 5.4 J; (5) 30 mW/cm2, 60 s, 1.8 J. Scale bar = 30 μm. •OH, hydroxyl radical; HClO, hypochlorous acid; O2•, superoxide anion; NO•, nitric oxide; ONOO−, peroxynitrite.
Figure 2
Figure 2
ROS and RNS generation after blue laser irradiation. Five fluorescent probes were incorporated into the L929 mouse fibroblasts. The cells were irradiated with a blue laser (405 nm), and the generation of ROS and RNS was evaluated using fluorescence microscopy. Phase-contrast microscopic images of the same sites are presented beside the fluorescent microscopic images. The fluorescent probes used were (a) OxiORANGE (detects •OH and HClO), (b) HySOx (detects HClO), (c) dihydroethidium (detects O2•), (d) Nitrixyte Red (detects NO•), and (e) NiSPY-3 (detects ONOO). The irradiation conditions were as follows: (1) control, no laser irradiation; (2) 100 mW/cm2, 180 s, 18 J; (3) 100 mW/cm2, 60 s, 6 J; (4) 30 mW/cm2, 180 s, 5.4 J; (5) 30 mW/cm2, 60 s, 1.8 J. Scale bar = 30 μm. •OH, hydroxyl radical; HClO, hypochlorous acid; O2•, superoxide anion; NO•, nitric oxide; ONOO−, peroxynitrite.
Figure 3
Figure 3
Representative histogram following blue laser irradiation obtained by flow cytometry. Five fluorescent probes were incorporated into the L929 mouse fibroblasts, and the cells were irradiated with a blue laser (405 nm). Each graph separately indicates the histogram for each fluorescent probe: (a) OxiORANGE (detects •OH and HClO), (b) HySOx (detects HClO), (c) dihydroethidium (detects O2•), (d) Nitrixyte Red (detects NO•), and (e) NiSPY-3 (detects ONOO). The irradiation conditions were as follows: (1) control, 100 mW/cm2, 180 s, 18 J; (2) 100 mW/cm2, 60 s, 6 J; (3) 30 mW/cm2, 180 s, 5.4 J; (4) 30 mW/cm2, 60 s, 1.8 J. Light and dark gray histograms correspond to the control and irradiation groups, respectively. •OH, hydroxyl radical; HClO, hypochlorous acid; O2•, superoxide anion; NO•, nitric oxide; ONOO−, peroxynitrite.
Figure 3
Figure 3
Representative histogram following blue laser irradiation obtained by flow cytometry. Five fluorescent probes were incorporated into the L929 mouse fibroblasts, and the cells were irradiated with a blue laser (405 nm). Each graph separately indicates the histogram for each fluorescent probe: (a) OxiORANGE (detects •OH and HClO), (b) HySOx (detects HClO), (c) dihydroethidium (detects O2•), (d) Nitrixyte Red (detects NO•), and (e) NiSPY-3 (detects ONOO). The irradiation conditions were as follows: (1) control, 100 mW/cm2, 180 s, 18 J; (2) 100 mW/cm2, 60 s, 6 J; (3) 30 mW/cm2, 180 s, 5.4 J; (4) 30 mW/cm2, 60 s, 1.8 J. Light and dark gray histograms correspond to the control and irradiation groups, respectively. •OH, hydroxyl radical; HClO, hypochlorous acid; O2•, superoxide anion; NO•, nitric oxide; ONOO−, peroxynitrite.
Figure 4
Figure 4
The MFI following blue laser irradiation. Five fluorescent probes were incorporated into the L929 mouse fibroblasts, and the cells were irradiated with a blue laser (405 nm). Each graph separately indicates the MFI ratio for each fluorescent probe: (a) OxiORANGE (detects •OH and HClO), (b) HySOx (detects HClO), (c) dihydroethidium (detects O2•), (d) Nitrixyte Red (detects NO•), and (e) NiSPY-3 (detects ONOO). The irradiation conditions were as follows: (1) control, 100 mW/cm2, 180 s, 18 J; (2) 100 mW/cm2, 60 s, 6 J; 30 mW/cm2, 180 s, (3) 5.4 J; 30 mW/cm2, 60 s, 1.8 J. The MFIs of the positive control for each fluorescent probe (Table 1; n ≥ 3) were as follows: (a) OxiORANGE, 2.73; (b) HySOx, 44.46; (c) dihydroethidium, 3.21; (d) Nitrixyte Red, 2.95; (e) NiSPY-3, 1.99. The MFIs of the negative control (unstained cells) (Table 1; n ≥ 3) were as follows: (a) OxiORANGE, 0.66; (b) HySOx, 0.99; (c) dihydroethidium, 0.09; (d) Nitrixyte Red, 0.90; (e) NiSPY-3, 1.02. The MFI was measured using flow cytometry; the MFI ratio was calculated by dividing the MFI of irradiated cells with that of non-irradiated cells. * p < 0.05. •OH, hydroxyl radical; HClO, hypochlorous acid; O2•, superoxide anion; NO•, nitric oxide; ONOO−, peroxynitrite; MFI, mean fluorescence intensity.
Figure 4
Figure 4
The MFI following blue laser irradiation. Five fluorescent probes were incorporated into the L929 mouse fibroblasts, and the cells were irradiated with a blue laser (405 nm). Each graph separately indicates the MFI ratio for each fluorescent probe: (a) OxiORANGE (detects •OH and HClO), (b) HySOx (detects HClO), (c) dihydroethidium (detects O2•), (d) Nitrixyte Red (detects NO•), and (e) NiSPY-3 (detects ONOO). The irradiation conditions were as follows: (1) control, 100 mW/cm2, 180 s, 18 J; (2) 100 mW/cm2, 60 s, 6 J; 30 mW/cm2, 180 s, (3) 5.4 J; 30 mW/cm2, 60 s, 1.8 J. The MFIs of the positive control for each fluorescent probe (Table 1; n ≥ 3) were as follows: (a) OxiORANGE, 2.73; (b) HySOx, 44.46; (c) dihydroethidium, 3.21; (d) Nitrixyte Red, 2.95; (e) NiSPY-3, 1.99. The MFIs of the negative control (unstained cells) (Table 1; n ≥ 3) were as follows: (a) OxiORANGE, 0.66; (b) HySOx, 0.99; (c) dihydroethidium, 0.09; (d) Nitrixyte Red, 0.90; (e) NiSPY-3, 1.02. The MFI was measured using flow cytometry; the MFI ratio was calculated by dividing the MFI of irradiated cells with that of non-irradiated cells. * p < 0.05. •OH, hydroxyl radical; HClO, hypochlorous acid; O2•, superoxide anion; NO•, nitric oxide; ONOO−, peroxynitrite; MFI, mean fluorescence intensity.
Figure 5
Figure 5
The cell viability assessment of irradiated cells. The 3-(4,5-dimethylthiazol-2-yl)-2,5-diphenyltetrazolium bromide (MTT) assay reagent was added at 24 h after the irradiation of L929 mouse fibroblasts with a blue laser of 405 nm, under various conditions (100 mW/cm2, 180 s, 18 J; 100 mW/cm2, 60 s, 6 J; 30 mW/cm2, 180 s, 5.4 J; 30 mW/cm2, 60 s, 1.8 J). Absorbance was measured at 4 h following MTT treatment. At least five independent experiments are presented. The results of the Kruskal–Wallis test followed by Dunnett’s multiple comparison tests showed a significant difference (p < 0.01) among the five groups. ** p < 0.01 against the control group.

References

    1. Avci P., Gupta A., Sadasivam M., Vecchio D., Pam Z., Pam N., Hamblin M.R. Low-level laser (light) therapy (LLLT) in skin: Stimulating, healing, restoring. Semin. Cutan. Med. Surg. 2013;32:41–52. - PMC - PubMed
    1. Scott A.M., Stehlik P., Clark J., Zhang D., Yang Z., Hoffmann T., Mar C.D., Glasziou P. Blue-Light Therapy for Acne Vulgaris: A Systematic Review and Meta-Analysis. Ann. Fam. Med. 2019;17:545–553. doi: 10.1370/afm.2445. - DOI - PMC - PubMed
    1. Pfaff S., Liebmann J., Born M., Merk H.F., von Felbert V. Prospective Randomized Long-Term Study on the Efficacy and Safety of UV-Free Blue Light for Treating Mild Psoriasis Vulgaris. Dermatology. 2015;231:24–34. doi: 10.1159/000430495. - DOI - PubMed
    1. Yoshino F., Yoshida A. Effects of blue-light irradiation during dental treatment. Jpn. Dent. Sci. Rev. 2018;54:160–168. doi: 10.1016/j.jdsr.2018.06.002. - DOI - PMC - PubMed
    1. Lee S.Y., You C.E., Park M.Y. Blue and red light combination LED phototherapy for acne vulgaris in patients with skin phototype IV. Lasers Surg. Med. 2007;39:180–188. doi: 10.1002/lsm.20412. - DOI - PubMed

LinkOut - more resources