. 2022 Jan 19;13(2):177.
doi: 10.3390/genes13020177.

The Organization of the Pig T-Cell Receptor γ (TRG) Locus Provides Insights into the Evolutionary Patterns of the TRG Genes across Cetartiodactyla

Affiliations

The Organization of the Pig T-Cell Receptor γ (TRG) Locus Provides Insights into the Evolutionary Patterns of the TRG Genes across Cetartiodactyla

Giovanna Linguiti et al. Genes (Basel). .

Abstract

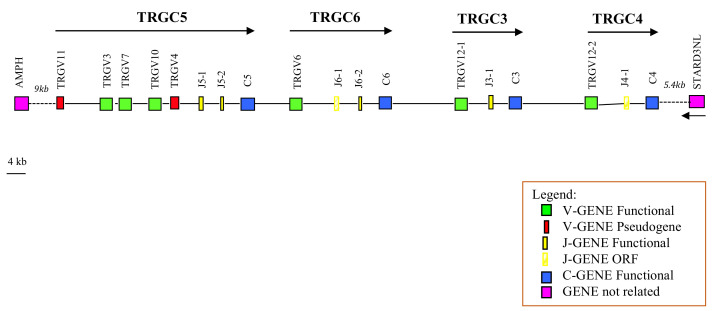
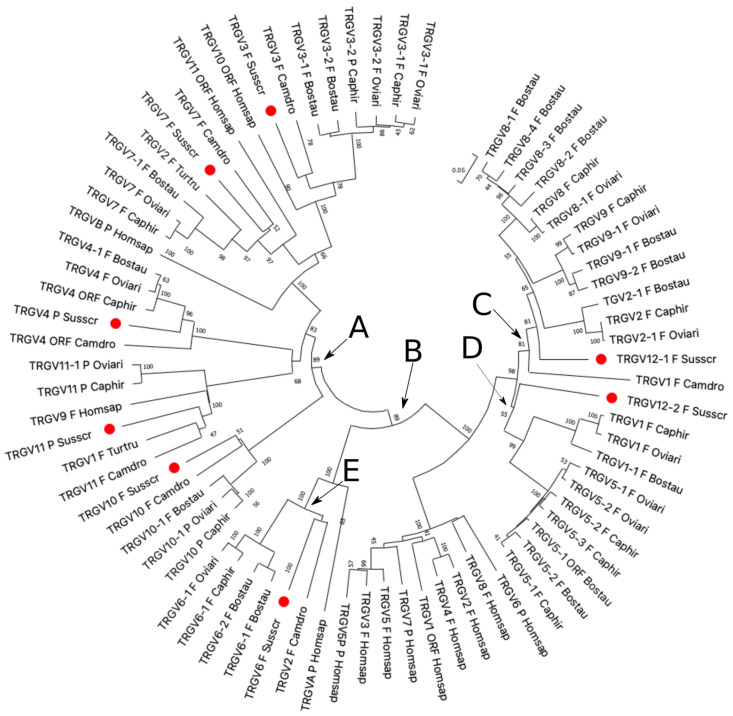
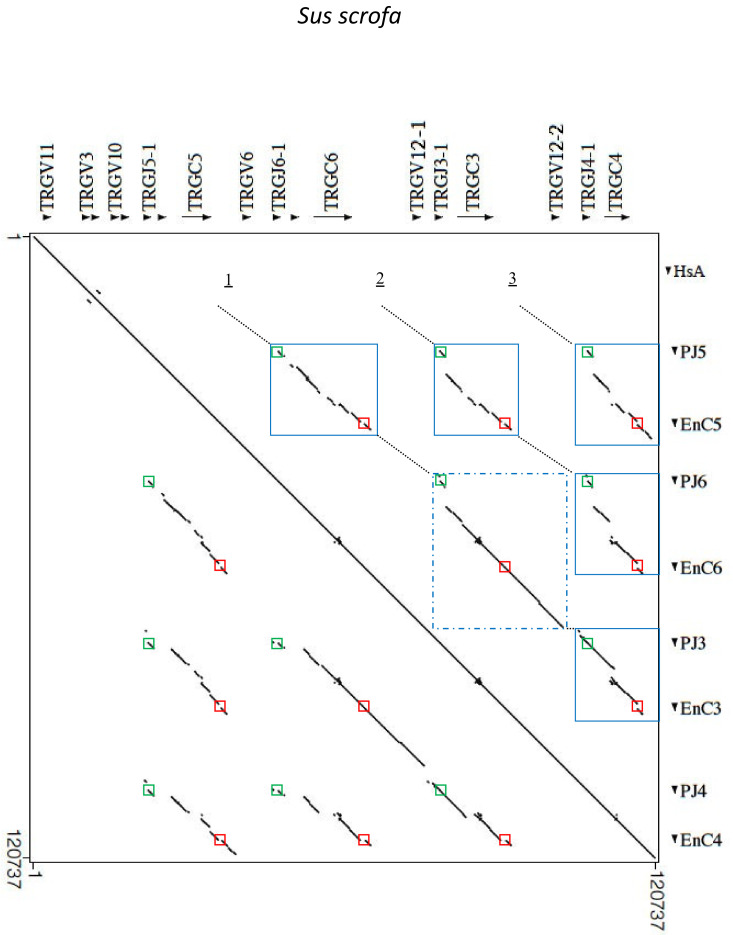
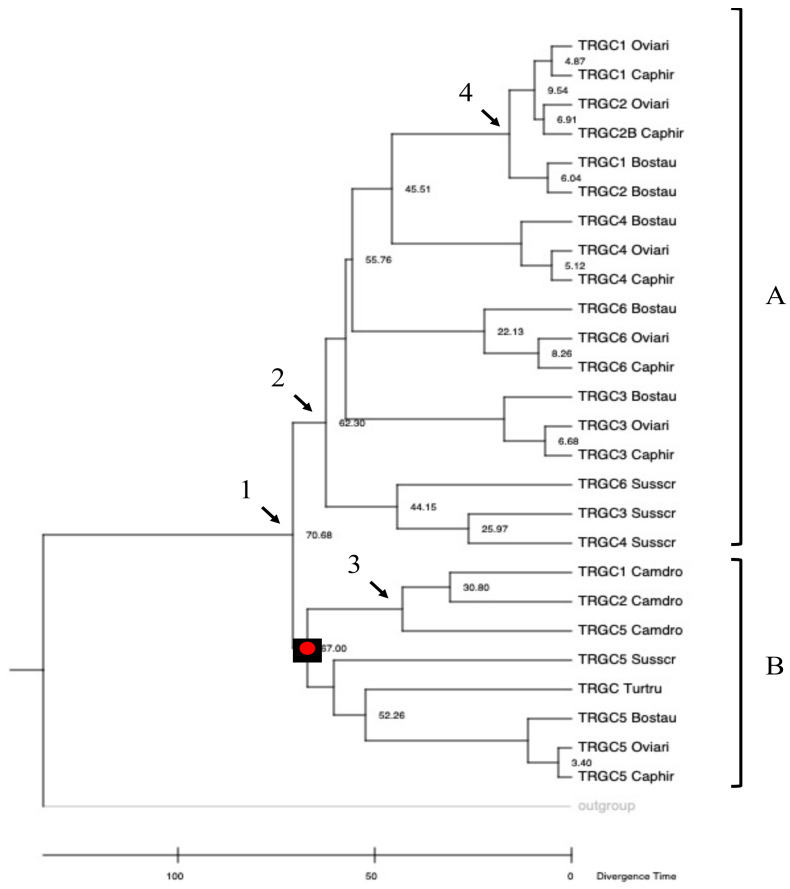
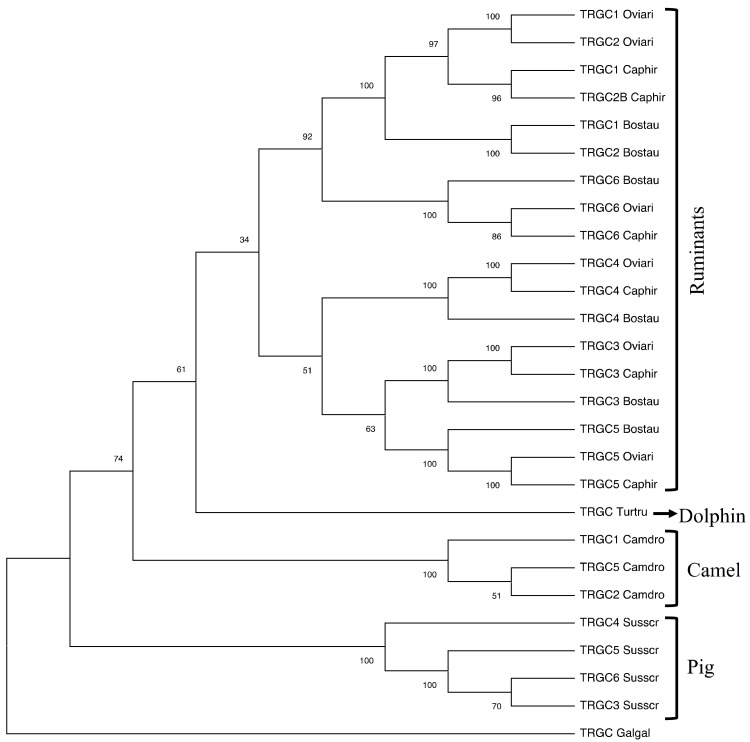
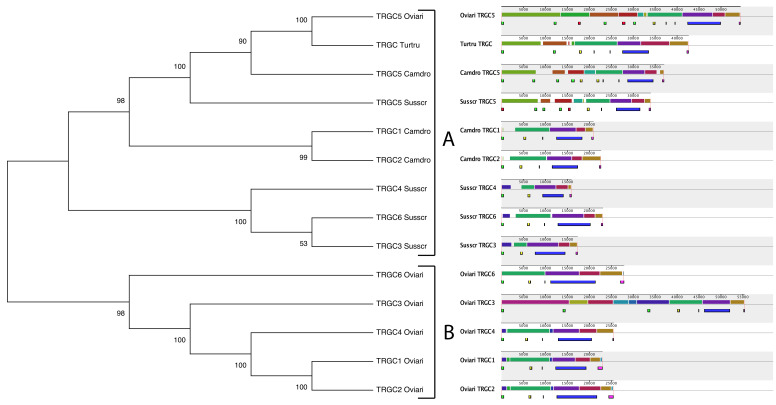
The domestic pig (Sus scrofa) is a species representative of the Suina, one of the four suborders within Cetartiodactyla. In this paper, we reported our analysis of the pig TRG locus in comparison with the loci of species representative of the Ruminantia, Tylopoda, and Cetacea suborders. The pig TRG genomic structure reiterates the peculiarity of the organization of Cetartiodactyla loci in TRGC "cassettes", each containing the basic V-J-J-C unit. Eighteen genes arranged in four TRGC cassettes, form the pig TRG locus. All the functional TRG genes were expressed, and the TRGV genes preferentially rearrange with the TRGJ genes within their own cassette, which correlates the diversity of the γ-chain repertoire with the number of cassettes. Among them, the TRGC5, located at the 5' end of the locus, is the only cassette that retains a marked homology with the corresponding TRGC cassettes of all the analyzed species. The preservation of the TRGC5 cassette for such a long evolutionary time presumes a highly specialized function of its genes, which could be essential for the survival of species. Therefore, the maintenance of this cassette in pigs confirms that it is the most evolutionarily ancient within Cetartiodactyla, and it has undergone a process of duplication to give rise to the other TRGC cassettes in the different artiodactyl species in a lineage-specific manner.

Keywords: Cetartiodactyla; TRG genes; TRG locus; evolution; immunogenomics; pig genome; γ/δ T-cell; γ/δ high species.


Conflict of interest statement

The authors declare no conflict of interest.

Figures

Figure 1
Figure 1
Schematic representation of the genomic organization of the pig TRG locus deduced from the genome assembly Sscrofa11.1. The name of each TRGC cassette is indicated by an arrow. The TRGV6 and TRGV12-2 genes, whose coding sequences are not in frame within the assembly, are indicated in the map as functional since they were found in productive cDNA clones (see text). The diagram shows the position of all related and unrelated TRG genes according to nomenclature. The boxes representing the genes are not to scale. The exons are not shown. The arrow indicates the transcriptional orientation of the STARD3NL gene.
Figure 2
Figure 2
The neighbor-joining (NJ) tree inferred from the pig, sheep, goat, bovine, dromedary, dolphin, and human TRGV gene sequences. The evolutionary analyses were conducted in MEGA X [25,26]. The optimal tree with the sum of branch length = 5.56210337 is shown. The percentage of replicate trees in which the associated taxa clustered together in the bootstrap test (100 replicates) is shown next to the branches [37]. The tree is drawn to scale, with branch lengths in the same units as those of the evolutionary distances used to infer the phylogenetic tree. The evolutionary distances were computed using the p-distance method [28] and are in the units of the number of base differences per site. This analysis involved 45 nucleotide sequences. Codon positions included were 1st + 2nd + 3rd + Noncoding. All ambiguous positions were removed for each sequence pair (pairwise deletion option). There was a total of 349 positions in the final dataset. Each pig TRGV gene is marked with a red circle. The branches highlighted by the letters group mammalian genes described in the text. The gene functionality according to IMGT rules (F: functional, ORF: open reading frame, P: pseudogene) is indicated. The IMGT 6-letter for species (Susscr, Bostau, Oviari, Caphir, Camdro, Turtru, and Homsap) standardized abbreviation for a taxon was used.
Figure 3
Figure 3
Dot-plot of the pig TRG locus sequence against itself. The transcription orientation of each sequence is indicated by arrows and arrowheads. Three parallel lines (1–3) to the perfect main diagonal line indicate the internal homology units between the TRGC cassettes. The interruptions of the parallel lines are indicated by dotted lines. The blue boxes show the internal homology of the J-C gene blocks. The blue dashed square indicates the longest duplicated region containing the TRGJ6-1/TRGC6/TRGV12-1/TRGJ3-1/TRGC3/TRGV12-2 gene block.
Figure 4
Figure 4
Time-calibrated phylogenetic tree of TRGC genes in Cetartiodactyla derived from MEGAX [25] applying the RelTime method. This analysis involved 27 nucleotide sequences. Codon positions included were 1st + 2nd + 3rd + Noncoding. All ambiguous positions were removed for each sequence pair (pairwise deletion option). There were a total of 818 positions in the final dataset. The calibration point (red circle) was arranged on a node to indicate the occurrence of divergence between Tylopoda (Camdro), and Suina (Susscr) estimated on fossil records and molecular data [11]. The chicken TRGC sequence was used as the outgroup. A (ruminant and pig TRGC genes) and B (dromedary and dolphin TRGC genes) represent the two major paraphyletic groups. Nodes 1–4 are described in the text. The IMGT 6-letter for species (Susscr, Bostau, Oviari, Caphir, Camdro, Turtru, and Homsap) standardized abbreviation for a taxon is used.
Figure 5
Figure 5
The NJ tree inferred from the pig, sheep, goat, bovine, dromedary, and dolphin 3′UTR nucleotide sequences of the TRGC genes. The evolutionary analyses were conducted in MEGA X [25,26]. The optimal tree with the sum of branch length = 1.76269382 is shown. The percentage of replicate trees in which the associated taxa clustered together in the bootstrap test (100 replicates) are shown next to the branches [37]. The tree is drawn to scale, with branch lengths in the same units as those of the evolutionary distances used to infer the phylogenetic tree. The evolutionary distances were computed using the p-distance method [28] and are in the units of the number of base differences per site. This analysis involved 27 nucleotide sequences. Codon positions included were 1st + 2nd + 3rd + Noncoding. All ambiguous positions were removed for each sequence pair (pairwise deletion option). There were a total of 727 positions in the final dataset. The brackets highlight lineage-specific monophyletic branches. The IMGT 6-letter for species (Susscr, Bostau, Oviari, Caphir, Camdro, Turtru, and Homsap) standardized abbreviation for a taxon is used.
Figure 6
Figure 6
Comparison of Cetartiodactyla TRGC cassettes. Left, the NJ tree inferred from the TRGC cassette sequences retrieved from pig, sheep, dromedary, and dolphin TRG loci. The evolutionary analyses were conducted in MEGA X [25,26]. The optimal tree with the sum of branch length = 1.91796264 is shown. The percentage of replicate trees in which the associated taxa clustered together in the bootstrap test (100 replicates) are shown next to the branches [37]. The evolutionary distances were computed using the p-distance method [28] and are in the units of the number of base differences per site. This analysis involved 15 nucleotide sequences. Codon positions included were 1st + 2nd + 3rd + Noncoding. All ambiguous positions were removed for each sequence pair (pairwise deletion option). There were a total of 127,184 positions in the final dataset. Right, schematic representation of the nucleotide comparison of the same genomic region. Colored blocks highlight syntenic regions between the different sequences. Blocks below the line indicate the position of TRGV (green, yellow, and red for functional, ORF, and pseudogenes, respectively), PJ-TRGJ genes (black line), TRGC genes (blue), and En elements (pink) are reported. The black arrows are described in the text.

References

    1. Hall E.R., Simpson G.G. The Principles of Classification and a Classification of Mammals. J. Mammal. 1946;27:287–288. doi: 10.2307/1375443. - DOI
    1. Graur D., Higgins D.G. Molecular evidence for the inclusion of cetaceans within the order Artiodactyla. Mol. Biol. Evol. 1994;11:357–364. doi: 10.1093/oxfordjournals.molbev.a040118. - DOI - PubMed
    1. Montgelard C., Catzeflis F.M., Douzery E. Phylogenetic relationships of artiodactyls and cetaceans as deduced from the comparison of cytochrome b and 12S rRNA mitochondrial sequences. Mol. Biol. Evol. 1997;14:550–559. doi: 10.1093/oxfordjournals.molbev.a025792. - DOI - PubMed
    1. Gatesy J., Milinkovitch M., Waddell V., Stanhope M., Waddell P. Stability of Cladistic Relationships between Cetacea and Higher-Level Artiodactyl Taxa. Syst. Biol. 1999;48:6–20. doi: 10.1080/106351599260409. - DOI - PubMed
    1. IUCN The IUCN Red List of Threatened Species. 2018. [(accessed on 20 December 2021)]. Version 2018–2. Available online: http://www.iucnredlist.org.

Publication types

Substances

LinkOut - more resources