. 2022 Jan 22;13(2):194.
doi: 10.3390/genes13020194.

The Difference in the Proportions of Deleterious Variations within and between Populations Influences the Estimation of FST

Affiliations

The Difference in the Proportions of Deleterious Variations within and between Populations Influences the Estimation of FST

Sankar Subramanian. Genes (Basel). .

Abstract

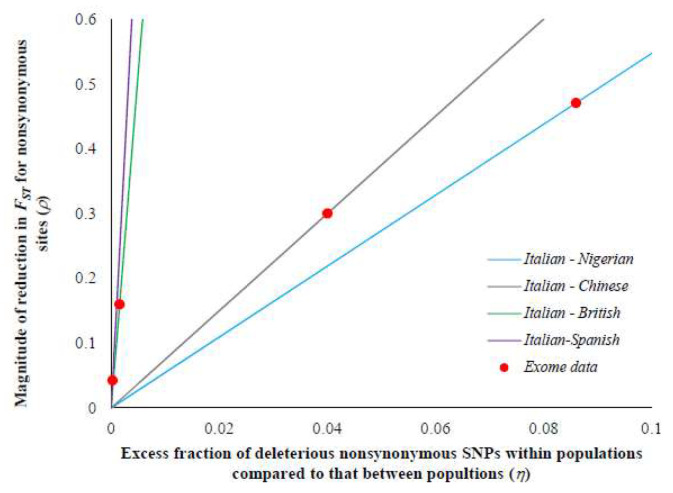
Estimating the extent of genetic differentiation between populations is an important measure in population genetics, ecology and evolutionary biology. The fixation index, or FST, is an important measure, which is routinely used to quantify this. Previous studies have shown that the FST estimated for selectively constrained regions was significantly lower than that estimated for neutral regions. By deriving the theoretical relationship between FST at neutral and constrained sites, we show that excess in the fraction of deleterious variations segregating within populations compared to those segregating between populations is the cause for the reduction in FST estimated at constrained sites. Using whole-genome data, our results revealed that the magnitude of reduction in FST estimates obtained for selectively constrained regions was much higher for distantly related populations compared to those estimated for closely related pairs. For example, the reduction was 47% for comparison between Europeans and Africans, 30% for the European and Asian comparison, 16% for the Northern and Southern European pair, and only 4% for the comparison involving two Southern European (Italian and Spanish) populations. Since deleterious variants are purged over time due to purifying selection, their contribution to the among-population diversity at constrained sites decreases with the increase in the divergence between populations. However, within-population diversities remain the same for all pairs compared; therefore, the FST estimated at constrained sites for distantly related populations are much smaller than those estimated for closely related populations. We obtained similar results when only the SNPs with similar allele frequencies at neutral and constrained sites were used. Our results suggest that the level of population divergence should be considered when comparing constrained site FST estimates from different pairs of populations.

Keywords: FST; deleterious mutations; population differentiation; temporal distributions and population genetics theory.


Conflict of interest statement

The authors declare no conflict of interest.

Figures

Figure 1
Figure 1
(A) Relationship between selection intensity and FST. Whole-exome data comprising synonymous SNPs (sSNPs) and nonsynonymous SNPs (nSNPs) for the Italian (TSI)–Nigerian (YRI) population pair was used to estimate FST. The magnitude of selection intensity on nSNPs was measured by the Combined Annotation-Dependent Depletion (CADD) method that integrates many diverse annotations into a single measure (C score) [31]. A bootstrap resampling procedure (1000 replicates) was used to estimate the standard error. (B) The magnitude of the reduction in the FST estimates and selection intensity. The X-axis shows the reduction in FST estimates of nSNPs in comparison with that of sSNPs (ρ) using Equation (11) (see Materials and Methods) for the exome data described above. Error bars show the standard error of the mean.
Figure 2
Figure 2
The theoretical relationship between the excess in the fraction of deleterious mutations segregating within population compared to between populations (η) and the magnitude of the reduction in the FST estimates of nSNPs (ρ) using Equation (12) (see Materials and Methods). The line was plotted using within- and between-population heterozygosities of neutral sSNPs for the Italian–Nigerian comparison and the red dots are the ρ values estimated from the exome data using Equation (11). Using the theoretical expected line, η values were predicted for the corresponding observed ρ values.
Figure 3
Figure 3
FST estimates for synonymous and highly constrained nonsynonymous SNPs of the (A) Italian–Nigerian, (B) Italian–Chinese, (C) Italian–British, and (D) Italian–Spanish population pairs. Error bars are the standard error of the mean, and a bootstrap resampling procedure (1000 replicates) was used to estimate the variance. The difference between the FST estimates of the neutral and constrained sites are highly significant (p < 0.01, Z test) for three comparisons and not significant for the Italian–Spanish pair.
Figure 4
Figure 4
The magnitude of the reduction in FST estimates of the nSNPs obtained for four population pairs. The population tree on top is drawn to highlight the correlation between the population divergence and the magnitude of the reduction in FST.
Figure 5
Figure 5
The theoretical relationship between the excess in the fraction of deleterious mutations segregating within population and those between populations (η) and the magnitude of the reduction in the FST estimates of nSNPs (ρ) using Equation (12) (see Materials and Methods). Neutral population diversities based on sSNPs for within- and between-population comparisons of the Italian–Nigerian, Italian–Chinese, Italian–British, and Italian–Spanish pairs were used to plot the lines, and the ρ estimated from the exome data (using Equation (11)) are shown as red closed circles. The theoretical lines were used to predict the η values of the corresponding ρ estimated using the exome data.

Similar articles

Cited by

References

    1. Wright S. The genetical structure of populations. Ann. Eugen. 1951;15:323–354. doi: 10.1111/j.1469-1809.1949.tb02451.x. - DOI - PubMed
    1. Akey J.M., Zhang G., Zhang K., Jin L., Shriver M.D. Interrogating a High-Density SNP Map for Signatures of Natural Selection. Genome Res. 2002;12:1805–1814. doi: 10.1101/gr.631202. - DOI - PMC - PubMed
    1. Barreiro L.B., Laval G., Quach H., Patin E., Quintana-Murci L. Natural selection has driven population differentiation in modern humans. Nat. Genet. 2008;40:340–345. doi: 10.1038/ng.78. - DOI - PubMed
    1. Beaumont M.A., Balding D. Identifying adaptive genetic divergence among populations from genome scans. Mol. Ecol. 2004;13:969–980. doi: 10.1111/j.1365-294X.2004.02125.x. - DOI - PubMed
    1. Bersaglieri T., Sabeti P.C., Patterson N., Vanderploeg T., Schaffner S.F., Drake J.A., Rhodes M., Reich D.E., Hirschhorn J.N. Genetic Signatures of Strong Recent Positive Selection at the Lactase Gene. Am. J. Hum. Genet. 2004;74:1111–1120. doi: 10.1086/421051. - DOI - PMC - PubMed

Publication types

LinkOut - more resources