. 2022 Feb 14;13(2):343.
doi: 10.3390/genes13020343.

The Psychoemotional Stress-Induced Changes in the Abundance of SatIII (1q12) and Telomere Repeats, but Not Ribosomal DNA, in Human Leukocytes

Affiliations

The Psychoemotional Stress-Induced Changes in the Abundance of SatIII (1q12) and Telomere Repeats, but Not Ribosomal DNA, in Human Leukocytes

Pavel E Umriukhin et al. Genes (Basel). .

Abstract

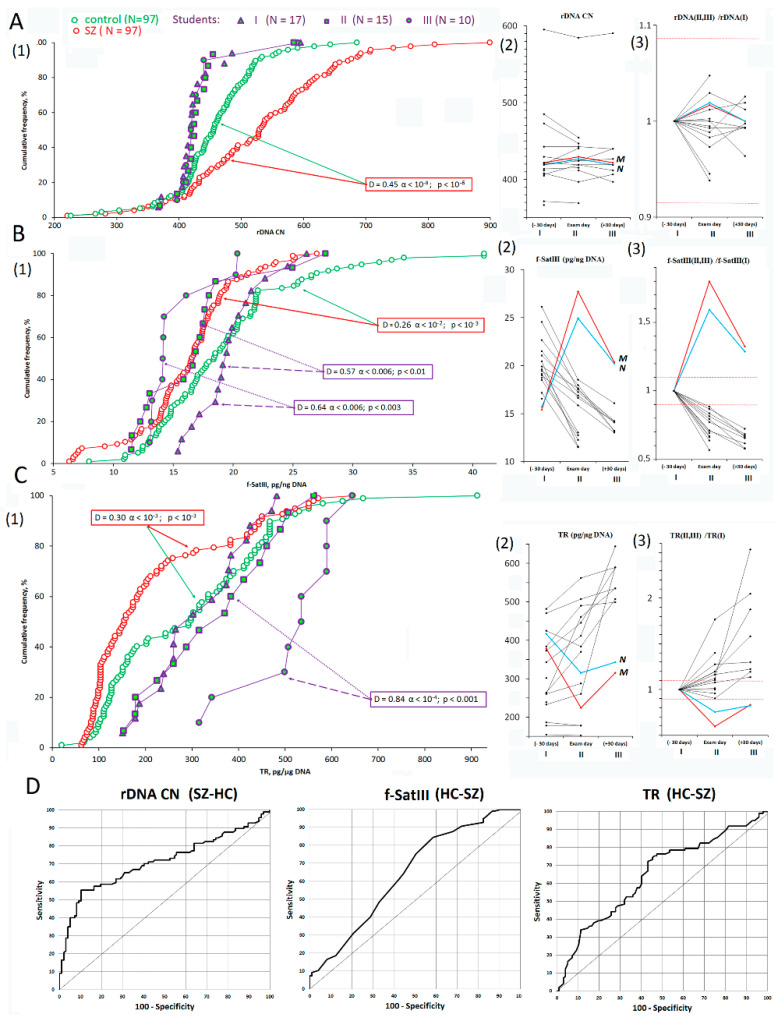
Introduction: As shown earlier, copy number variations (CNV) in the human satellite III (1q12) fragment (f-SatIII) and the telomere repeat (TR) reflects the cell's response to oxidative stress. The contents of f-SatIII and TR in schizophrenic (SZ) patients were found to be lower than in healthy controls (HC) in previous studies. The major question of this study was: 'What are the f-SatIII and TR CNV dynamic changes in human leukocytes, depending on psychoemotional stress?'

Materials and methods: We chose a model of psychoemotional stress experienced by second-year medical students during their exams. Blood samples were taken in stressful conditions (exams) and in a control non-stressful period. Biotinylated probes were used for f-SatIII, rDNA, and TR quantitation in leukocyte DNA by non-radioactive quantitative hybridization in SZ patients (n = 97), HC (n = 97), and medical students (n = 17, n = 42). A flow cytometry analysis was used for the oxidative stress marker (NOX4, 8-oxodG, and γH2AX) detection in the lymphocytes of the three groups.

Results: Oxidative stress markers increased significantly in the students' lymphocytes during psychoemotional stress. The TR and f-SatIII, but not the rDNA, contents significantly changed in the DNA isolated from human blood leukocytes. After a restoration period (post-examinational vacations), the f-SatIII content decreased, and the TR content increased. Changes in the blood cells of students during examinational stress were similar to those in SZ patients during an exacerbation of the disease.

Conclusions: Psychoemotional stress in students during exams triggers a universal mechanism of oxidative stress. The oxidative stress causes significant changes in the f-SatIII and TR contents, while the ribosomal repeat content remains stable. A hypothesis is proposed to explain the quantitative polymorphisms of f-SatIII and TR contents under transient (e.g., students' exams) or chronic (in SZ patients) stress. The changes in the f-SatIII and TR copy numbers are non-specific events, irrespective of the source of stress. Thus, our findings suggest that the psychoemotional stress, common in SZ patients and healthy students during exams, but not in a schizophrenia-specific event, was responsible for the changes in the repeat contents that we observed earlier in SZ patients.

Keywords: CNVs; satellite DNA; schizophrenia; stress; telomere.


Conflict of interest statement

The authors declare that the research was conducted in the absence of any commercial or financial relationships that could be construed as a potential conflict of interest.

Figures

Figure 1
Figure 1
Dependence of TR content (axis of ordinates) on the relative hybridization signal (axis of abscissas) for six samples. The relative hybridization signal was calculated as a ratio of signal intensities of the inspected (Ii) and control (Ic) samples.
Figure 2
Figure 2
CNVs of rDNA, f-SatIII, and TR in the analyzed samples. (A1C1). Cumulative distribution of the rDNA CN, f-SatIII, and TR in the leukocyte DNA of the SZ, HC, and St groups. See descriptive statistics for the groups in Table 2. The significance of the observed differences in the rDNA CNs was analyzed using a non-parametric Mann–Whitney U test (p) and Kolmogorov–Smirnov (D and α) statistics (Table 3). (A2C2). Changes in the contents of rDNA, f-SatIII, and TR in the students’ DNA during the educational process. Straight lines connect the dots for each student. Data are highlighted for two students (M and N) who were different from the rest of the group. (A3C3). Changes in the contents of rDNA, f-SatIII, and TR in students’ DNA during the educational process. All the data were normalized by the parameter values in the St(I) group. Red horizontal lines indicate the relative standard error (SE) of the experiment. Changes in the rDNA CN index lay within the standard error (SE), while changes in the f-SatIII and TR indices exceeded the SE. (D). The ROC curves plotted for the SZ and HC samples. Area under the ROC curve (AUC) is a measure of how well the parameter can distinguish between the two groups (Table 3).
Figure 3
Figure 3
Dependence of f-SatIII content on NOX4, 8-oxodG, γH2AX, BAX levels in the lymphocytes of SZ and HC groups. (A1,A3,A5). Cumulative distributions of FL1-NOX4, FL1-8-oxodG, and FL1-γH2AX in the lymphocytes of SZ, HC, and St groups. See descriptive statistics for the groups in Table 4. The significance of the observed differences was tested using a non-parametric Mann–Whitney U test (p) and Kolmogorov–Smirnov (D and α) statistics (Table 3). (A2,A4,A6). Changes in FL1-NOX4, FL1-8-oxodG, and FL1-γH2AX during the educational process in St subgroups. All the data were normalized by the parameter values in the St(I) subgroup. Red horizontal lines indicate the relative standard error of the experiment. Changes in FL1-NOX4, FL1-8-oxodG, and FL1-γH2AX exceeded the standard error. (B1B3). The link between FL1-NOX4, FL1-8-oxodG, and FL1-γH2AX in the samples studied. The graphs show the data for linear regression (k) and Spearman’s correlation coefficient ®.
Figure 4
Figure 4
Changes in the contents of some markers in the students’ lymphocytes during the educational process. (A) Changes in the contents of some markers in the students’ lymphocytes during the educational process. Straight lines connect the dots for each student. The inscription on the graphs compares the three subgroups by the analyzed index (Mann–Whitney U test). (B) Comparison of three St subgroups by medians of the contents of the three repeats in the genome and medians of the contents of some markers in the students’ lymphocytes. All the data were normalized by the parameter values in St(III) subgroup (the period of the least stress).
Figure 5
Figure 5
The link between the contents of rDNA, f-SatIII, TR in the genomic DNA and the contents of stress markers NOX4, 8-oxodG, and γH2AX in the lymphocytes. (A1,A4,A7). Dependence of FL1-NOX4, FL1-8-oxodG, and FL1-γH2AX on rDNA CNs for the samples studied. (A2,A5,A8). Dependence of f-SatIII on FL1-NOX4, FL1-8-oxodG, and FL1-γH2AX for the samples studied. (A3,A6,A9). Dependence of TR count on FL1-NOX4, FL1-8-oxodG, and FL1-γH2AX for the samples studied. The graphs show the data for linear regression (k) and the Spearman correlation (R) coefficients. (B1,B4,B7). Analysis of NOX4, 8-oxodG, and γH2AX in HC and SZ subgroups that differed by rDNA CNs. (B2,B5,B8). Analysis of f-SatIII content in HC and SZ subgroups that differed by FL1-NOX4, FL1-8-oxodG, and FL1-γH2AX levels. (B3,B6,B9). Analysis of TR content in HC and SZ subgroups that differed by FL1-NOX4, FL1-8-oxodG, and FL1-γH2AX. The Tables in the figures present the descriptive statistics. The graph shows sample comparisons using non-parametric Mann–Whitney U statistics. (C). Scheme that displays the change in the contents of f-SatIII and TR in DNA depending on the contents of NOX4, 8-oxodG, and γH2AX markers in the lymphocytes of the test groups. (D). Scheme showing the contents of f-SatIII and TR in DNA and the contents of the stress markers NOX4 and 8-oxodG in the lymphocytes, depending on rDNA contents in HC and SZ groups.
Figure 6
Figure 6
A hypothetical scheme showing the combinations of different sizes of f-SatIII and TR clusters in human cell nuclei under stress. (A) Changes in the contents of f-SatIII (brown line) and TR (blue line) in the cell under the stress. The stress induces cell death (black line). (B) Changes in the contents of f-SatIII and TR in the students’ cells. Red is for rDNA; blue for TR; brown for f-SatIII. (C) Changes in the contents of f-SatIII and TR in the DNA isolated from the students’ blood cells. Red is for rDNA; blue for TR; brown f-SatIII.

References

    1. De Koning A.P., Gu W., Castoe T.A., Batzer M.A., Pollock D.D. Repetitive elements may comprise over two-thirds of the human genome. PLoS Genet. 2011;7:e1002384. doi: 10.1371/journal.pgen.1002384. - DOI - PMC - PubMed
    1. Monlong J., Cossette P., Meloche C., Rouleau G., Girard S.L., Bourque G. Human copy number variants are enriched in regions of low mappability. Nucleic Acids Res. 2018;46:7236–7249. doi: 10.1093/nar/gky538. - DOI - PMC - PubMed
    1. Freeman J.L., Perry G.H., Feuk L., Redon R., McCarroll S.A., Altshuler D.M., Aburatani H., Jones K.W., Tyler-Smith C., Hurles M.E., et al. Copy number variation: New insights in genome diversity. Genome Res. 2006;16:949–961. doi: 10.1101/gr.3677206. - DOI - PubMed
    1. Redon R., Ishikawa S., Fitch K.R., Feuk L., Perry G.H., Andrews T.D., Fiegler H., Shapero M.H., Carson A.R., Chen W., et al. Global variation in copy number in the human genome. Nature. 2006;444:444–454. doi: 10.1038/nature05329. - DOI - PMC - PubMed
    1. Henrichsen C.N., Chaignat E., Reymond A. Copy number variants, diseases and gene expression. Hum. Mol. Genet. 2009;18:R1–R8. doi: 10.1093/hmg/ddp011. - DOI - PubMed

Publication types