

Non-Invasive Monitoring of Increased Fibrotic Tissue and Hyaluronan Deposition in the Tumor Microenvironment in the Advanced Stages of Pancreatic Ductal Adenocarcinoma
- PMID: 35205746
- PMCID: PMC8870395
- DOI: 10.3390/cancers14040999
Non-Invasive Monitoring of Increased Fibrotic Tissue and Hyaluronan Deposition in the Tumor Microenvironment in the Advanced Stages of Pancreatic Ductal Adenocarcinoma
Abstract
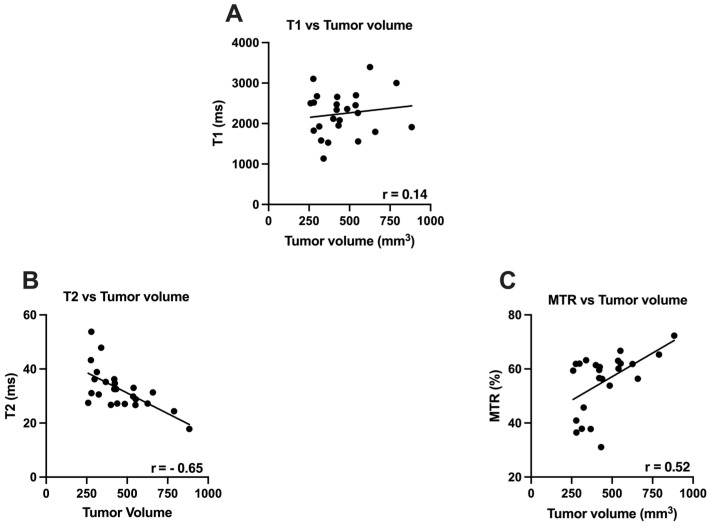
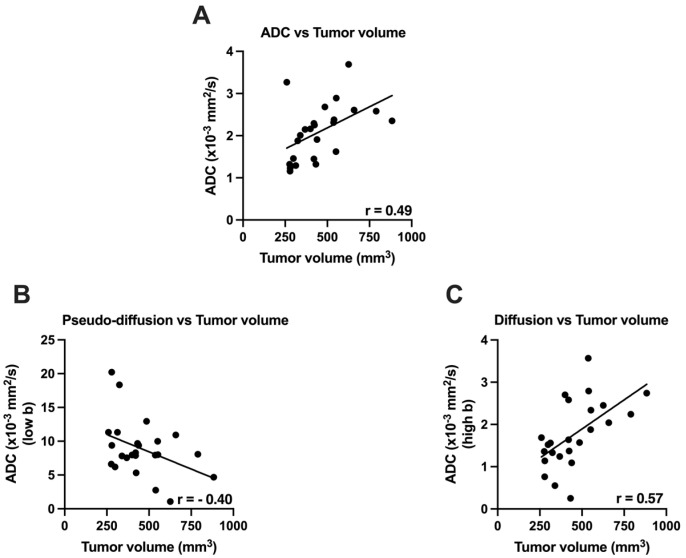
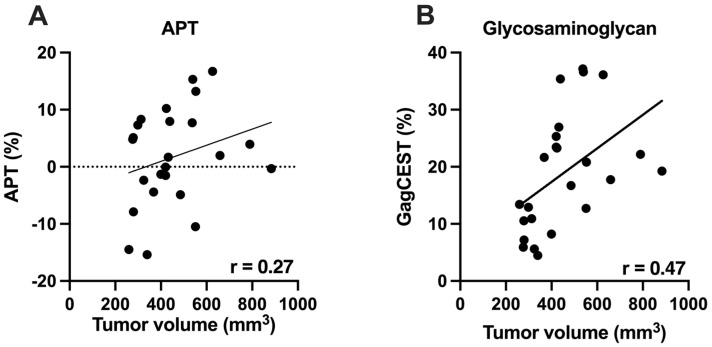
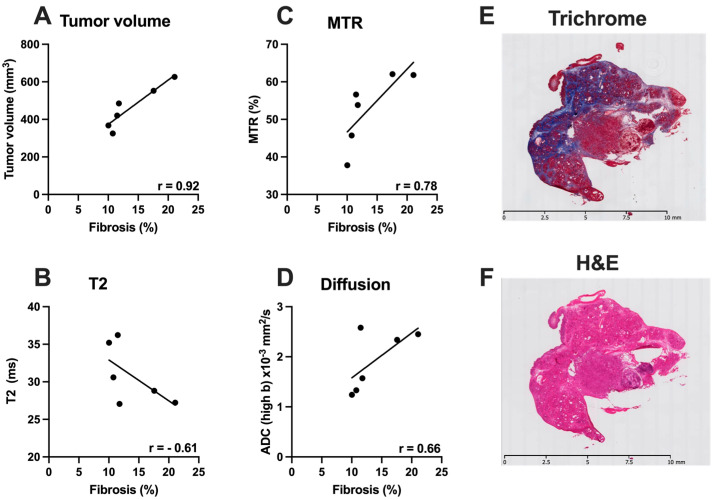
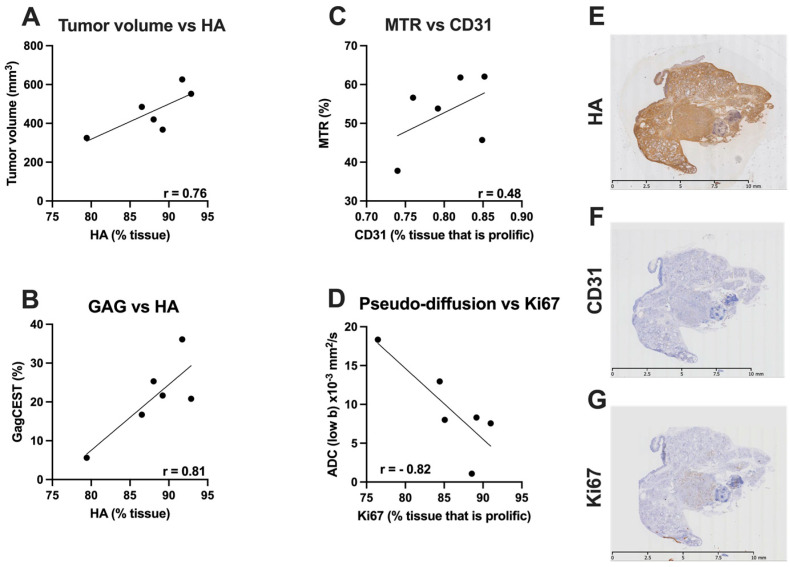
Pancreatic ductal adenocarcinomas are characterized by a complex and robust tumor microenvironment (TME) consisting of fibrotic tissue, excessive levels of hyaluronan (HA), and immune cells. We utilized quantitative multi-parametric magnetic resonance imaging (mp-MRI) methods at 14 Tesla in a genetically engineered KPC (KrasLSL-G12D/+, Trp53LSL-R172H/+, Cre) mouse model to assess the complex TME in advanced stages of tumor development. The whole tumor, excluding cystic areas, was selected as the region of interest for data analysis and subsequent statistical analysis. Pearson correlation was used for statistical inference. There was a significant correlation between tumor volume and T2 (r = -0.66), magnetization transfer ratio (MTR) (r = 0.60), apparent diffusion coefficient (ADC) (r = 0.48), and Glycosaminoglycan-chemical exchange saturation transfer (GagCEST) (r = 0.51). A subset of mice was randomly selected for histological analysis. There were positive correlations between tumor volume and fibrosis (0.92), and HA (r = 0.76); GagCEST and HA (r = 0.81); and MTR and CD31 (r = 0.48). We found a negative correlation between ADC low-b (perfusion) and Ki67 (r = -0.82). Strong correlations between mp-MRI and histology results suggest that mp-MRI can be used as a non-invasive tool to monitor the tumor microenvironment.
Keywords: amide proton transfer (APT); apparent diffusion coefficient (ADC); chemical exchange saturation transfer (CEST); glycosaminoglycan (Gag); multi-parametric magnetic resonance imaging (mp-MRI); pancreatic ductal adenocarcinoma (PDAC).
Conflict of interest statement
The authors declare no conflict of interest. The funders had no role in the design of the study; in the collection, analyses, or interpretation of data; in the writing of the manuscript, or in the decision to publish the results.
Figures
References
-
- Dufort C.C., DelGiorno K.E., Carlson M.A., Osgood R.J., Zhao C., Huang Z., Thompson C.B., Connor R.J., Thanos C.D., Brockenbrough J.S., et al. Interstitial Pressure in Pancreatic Ductal Adenocarcinoma Is Dominated by a Gel-Fluid Phase. Biophys. J. 2016;110:2106–2119. doi: 10.1016/j.bpj.2016.03.040. - DOI - PMC - PubMed
Grants and funding
LinkOut - more resources
Full Text Sources
Research Materials
Miscellaneous
