

Multiple COVID-19 Waves and Vaccination Effectiveness in the United States
- PMID: 35206474
- PMCID: PMC8871705
- DOI: 10.3390/ijerph19042282
Multiple COVID-19 Waves and Vaccination Effectiveness in the United States
Abstract
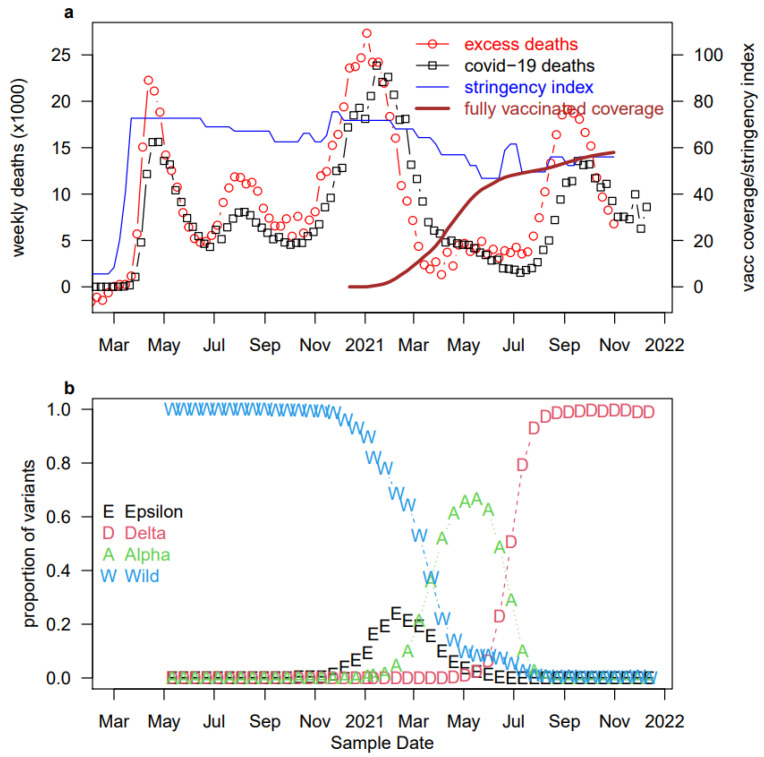
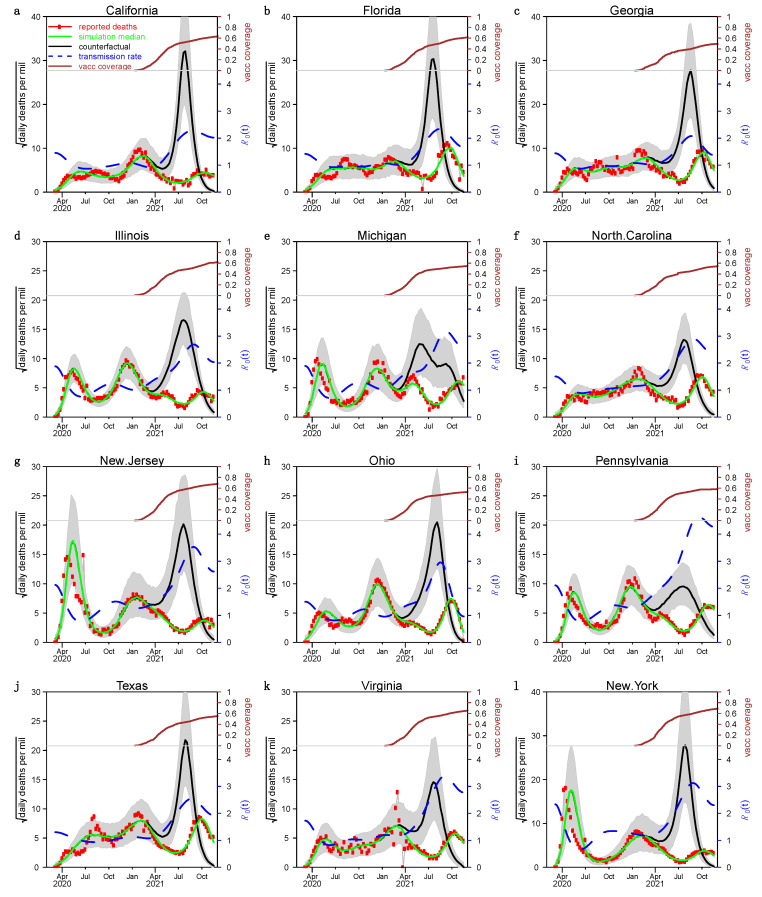
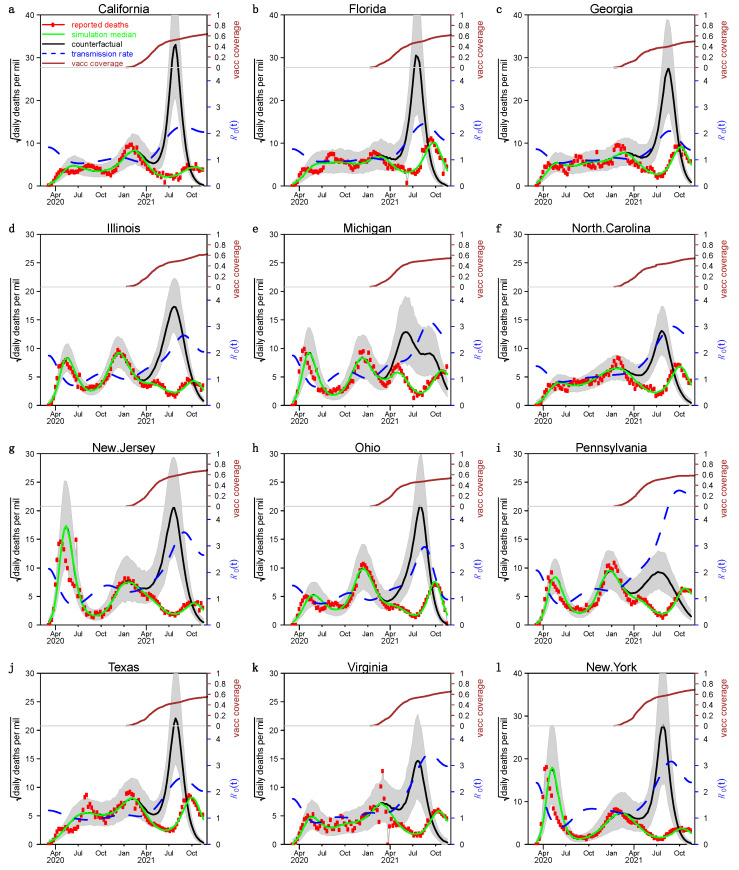
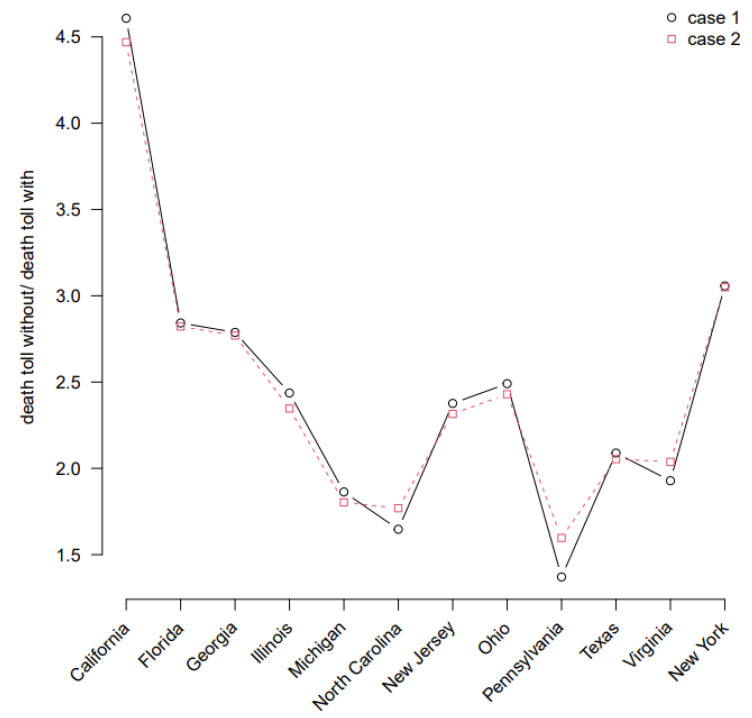
(1) Background: The coronavirus 2019 (COVID-19) pandemic has caused multiple waves of cases and deaths in the United States (US). The wild strain, the Alpha variant (B.1.1.7) and the Delta variant (B.1.617.2) of severe acute respiratory syndrome coronavirus 2 (SARS-CoV-2) were the principal culprits behind these waves. To mitigate the pandemic, the vaccination campaign was started in January 2021. While the vaccine efficacy is less than 1, breakthrough infections were reported. This work aims to examine the effects of the vaccination across 50 US states and the District of Columbia. (2) Methods: Based on the classic Susceptible-Exposed-Infectious-Recovered (SEIR) model, we add a delay class between infectious and death, a death class and a vaccinated class. We compare two special cases of our new model to simulate the effects of the vaccination. The first case expounds the vaccinated individuals with full protection or not, compared to the second case where all vaccinated individuals have the same level of protection. (3) Results: Through fitting the two approaches to reported COVID-19 deaths in all 50 US states and the District of Columbia, we found that these two approaches are equivalent. We calculate that the death toll could be 1.67-3.33 fold in most states if the vaccine was not available. The median and mean infection fatality ratio are estimated to be approximately 0.6 and 0.7%. (4) Conclusions: The two approaches we compared were equivalent in evaluating the effectiveness of the vaccination campaign in the US. In addition, the effect of the vaccination campaign was significant, with a large number of deaths averted.
Keywords: COVID-19; breakthrough infection; reinfection; vaccination effectiveness.
Conflict of interest statement
The authors declare no conflict of interest.
Figures
References
-
- Caroline K., Samantha K., Jason S.B. UPDATED: Timeline of the Coronavirus. [(accessed on 4 December 2021)]. Available online: https://www.thinkglobalhealth.org/article/updated-timeline-coronavirus.
-
- WHO Coronavirus (COVID-19) Dashboard. [(accessed on 24 December 2021)]. Available online: https://covid19.who.int/region/amro/country/us.
Publication types
MeSH terms
Substances
Supplementary concepts
Grants and funding
LinkOut - more resources
Full Text Sources
Medical
Miscellaneous
