

Liquid Biopsy in Type 2 Diabetes Mellitus Management: Building Specific Biosignatures via Machine Learning
- PMID: 35207316
- PMCID: PMC8876363
- DOI: 10.3390/jcm11041045
Liquid Biopsy in Type 2 Diabetes Mellitus Management: Building Specific Biosignatures via Machine Learning
Abstract
Background: The need for minimally invasive biomarkers for the early diagnosis of type 2 diabetes (T2DM) prior to the clinical onset and monitoring of β-pancreatic cell loss is emerging. Here, we focused on studying circulating cell-free DNA (ccfDNA) as a liquid biopsy biomaterial for accurate diagnosis/monitoring of T2DM.
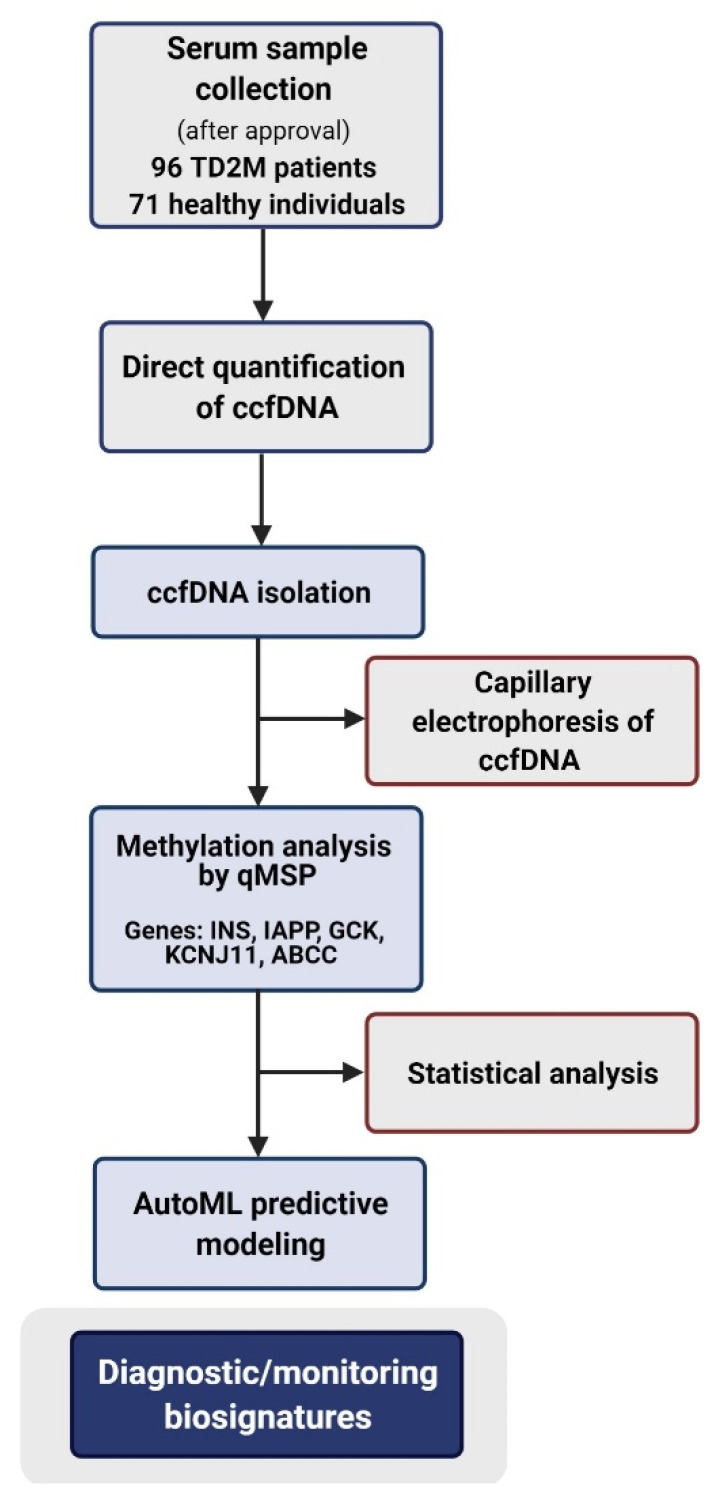
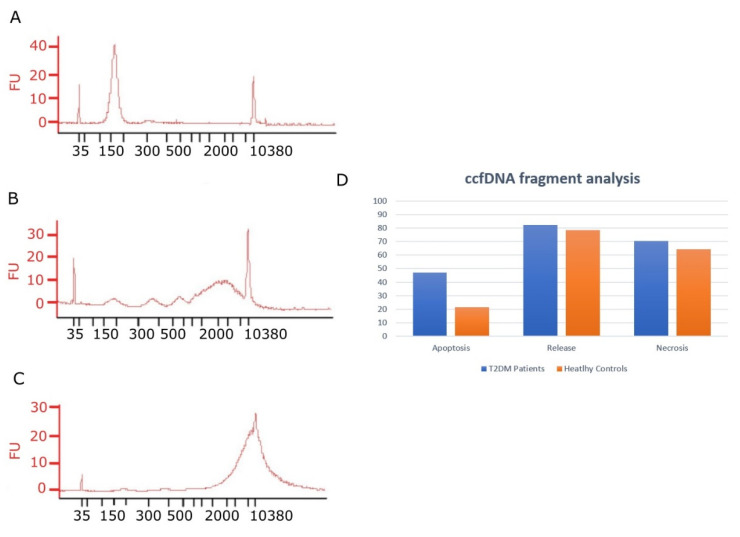
Methods: ccfDNA levels were directly quantified in sera from 96 T2DM patients and 71 healthy individuals via fluorometry, and then fragment DNA size profiling was performed by capillary electrophoresis. Following this, ccfDNA methylation levels of five β-cell-related genes were measured via qPCR. Data were analyzed by automated machine learning to build classifying predictive models.
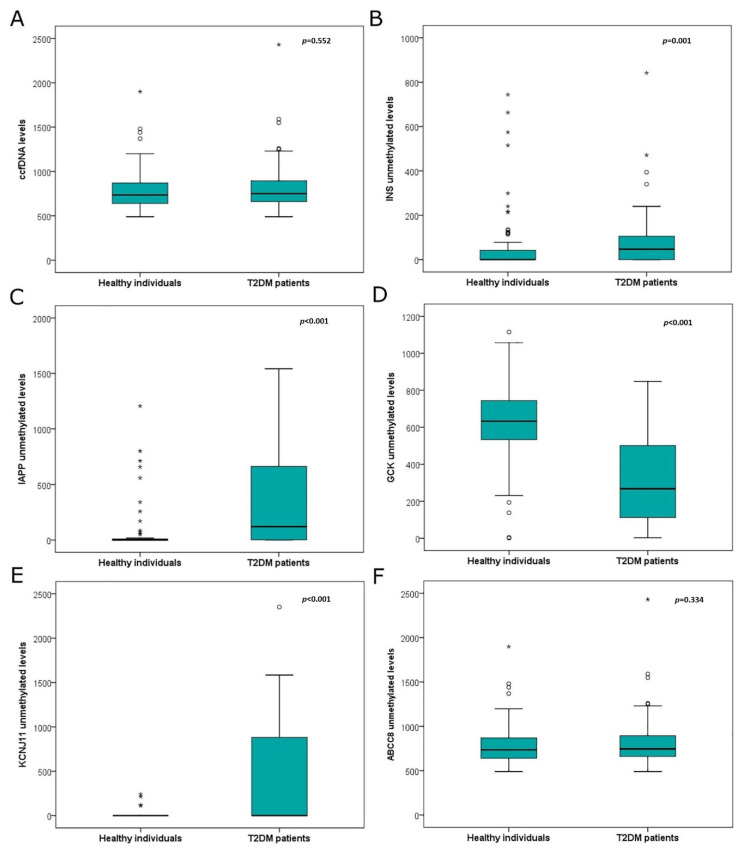
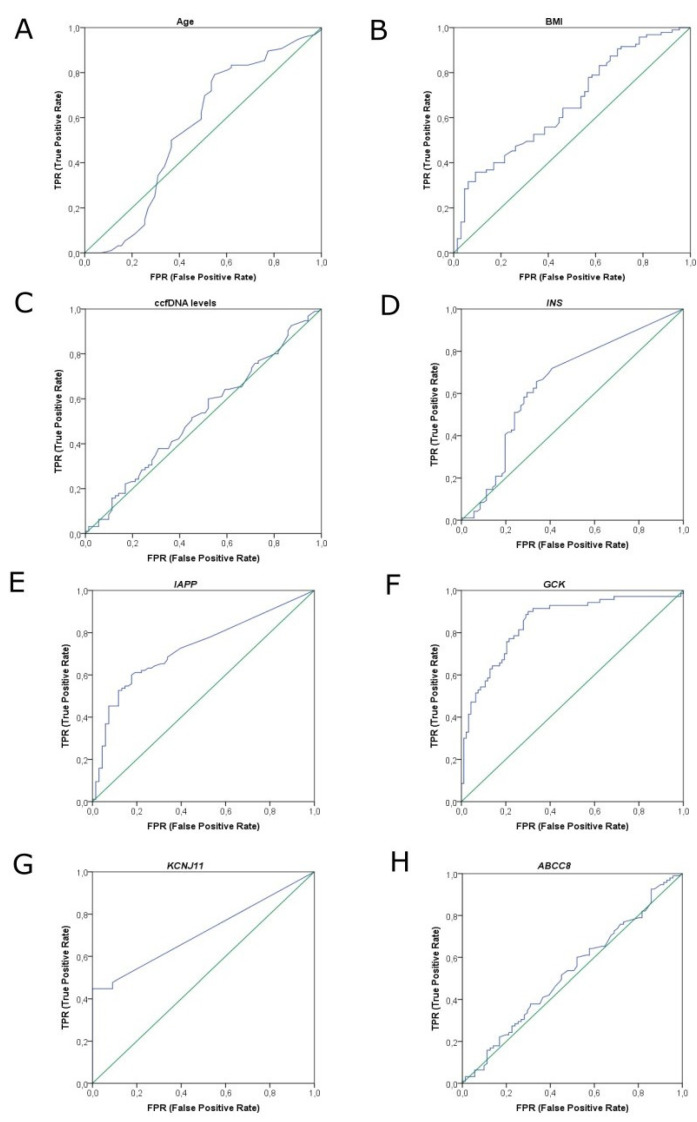
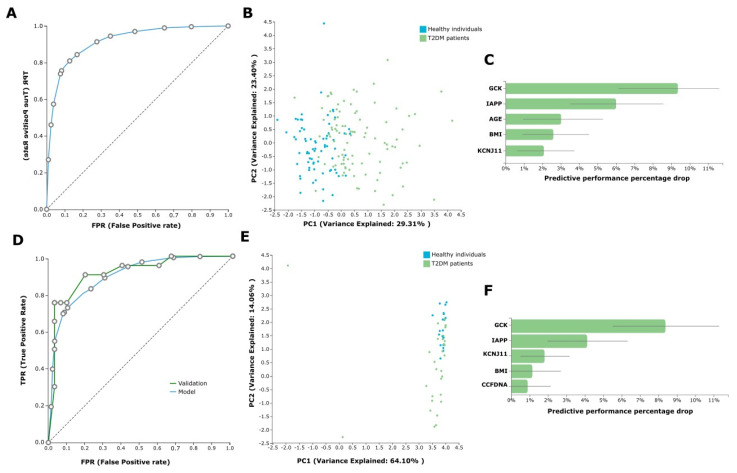
Results: ccfDNA levels were found to be similar between groups but indicative of apoptosis in T2DM. INS (Insulin), IAPP (Islet Amyloid Polypeptide-Amylin), GCK (Glucokinase), and KCNJ11 (Potassium Inwardly Rectifying Channel Subfamily J member 11) levels differed significantly between groups. AutoML analysis delivered biosignatures including GCK, IAPP and KCNJ11 methylation, with the highest ever reported discriminating performance of T2DM from healthy individuals (AUC 0.927).
Conclusions: Our data unravel the value of ccfDNA as a minimally invasive biomaterial carrying important clinical information for T2DM. Upon prospective clinical evaluation, the built biosignature can be disruptive for T2DM clinical management.
Keywords: DNA methylation; circulating cell free DNA; machine learning; type 2 diabetes.
Conflict of interest statement
I.T. is CEO of Gnosis Data Analysis that offers the JADBio service commercially. The other authors declare no other conflict of interest. Part of the results presented here is used for supporting the application of a European patent (EPO), M.K., I.T. and E.C. acting as inventors.
Figures
Similar articles
-
Mitochondrial Fraction of Circulating Cell-Free DNA as an Indicator of Human Pathology.Int J Mol Sci. 2024 Apr 10;25(8):4199. doi: 10.3390/ijms25084199. Int J Mol Sci. 2024. PMID: 38673785 Free PMC article.
-
Tissue-Specific Methylation Biosignatures for Monitoring Diseases: An In Silico Approach.Int J Mol Sci. 2022 Mar 9;23(6):2959. doi: 10.3390/ijms23062959. Int J Mol Sci. 2022. PMID: 35328380 Free PMC article.
-
Circulating cell-free DNA in breast cancer: size profiling, levels, and methylation patterns lead to prognostic and predictive classifiers.Oncogene. 2019 May;38(18):3387-3401. doi: 10.1038/s41388-018-0660-y. Epub 2019 Jan 14. Oncogene. 2019. PMID: 30643192
-
Causative factors for formation of toxic islet amyloid polypeptide oligomer in type 2 diabetes mellitus.Clin Interv Aging. 2015 Nov 19;10:1873-9. doi: 10.2147/CIA.S95297. eCollection 2015. Clin Interv Aging. 2015. PMID: 26604727 Free PMC article. Review.
-
Pathogenesis of feline diabetes mellitus.Mol Cell Endocrinol. 2002 Nov 29;197(1-2):213-9. doi: 10.1016/s0303-7207(02)00265-4. Mol Cell Endocrinol. 2002. PMID: 12431815 Review.
Cited by
-
Research progress on the correlation between islet amyloid peptides and type 2 diabetes mellitus.Open Med (Wars). 2025 Mar 17;20(1):20241124. doi: 10.1515/med-2024-1124. eCollection 2025. Open Med (Wars). 2025. PMID: 40109329 Free PMC article. Review.
-
Label-Free Human Disease Characterization through Circulating Cell-Free DNA Analysis Using Raman Spectroscopy.Int J Mol Sci. 2023 Aug 3;24(15):12384. doi: 10.3390/ijms241512384. Int J Mol Sci. 2023. PMID: 37569759 Free PMC article.
-
Epigenetics Plays a Role in the Pathogenesis and Treatment of Diabetes.Genes (Basel). 2025 Jun 30;16(7):769. doi: 10.3390/genes16070769. Genes (Basel). 2025. PMID: 40725425 Free PMC article. Review.
-
A characteristic cerebellar biosignature for bipolar disorder, identified with fully automatic machine learning.IBRO Neurosci Rep. 2023 Jul 1;15:77-89. doi: 10.1016/j.ibneur.2023.06.008. eCollection 2023 Dec. IBRO Neurosci Rep. 2023. PMID: 38025660 Free PMC article.
-
Regional differences in islet amyloid deposition in the residual pancreas with new-onset diabetes secondary to pancreatic ductal adenocarcinoma.World J Gastrointest Surg. 2023 Aug 27;15(8):1703-1711. doi: 10.4240/wjgs.v15.i8.1703. World J Gastrointest Surg. 2023. PMID: 37701698 Free PMC article.
References
-
- Saeedi P., Petersohn I., Salpea P., Malanda B., Karuranga S., Unwin N., Colagiuri S., Guariguata L., Motala A.A., Ogurtsova K., et al. Global and regional diabetes prevalence estimates for 2019 and projections for 2030 and 2045: Results from the International Diabetes Federation Diabetes Atlas, 9th edition. Diabetes Res. Clin. Pract. 2019;157:1–43. doi: 10.1016/j.diabres.2019.107843. - DOI - PubMed
Grants and funding
LinkOut - more resources
Full Text Sources
Miscellaneous
