. 2022 Feb 6;12(2):240.
doi: 10.3390/life12020240.

Influence of Systemic Therapy on the Expression and Activity of Selected STAT Proteins in Prostate Cancer Tissue

Affiliations

Influence of Systemic Therapy on the Expression and Activity of Selected STAT Proteins in Prostate Cancer Tissue

Celina Ebersbach et al. Life (Basel). .

Abstract

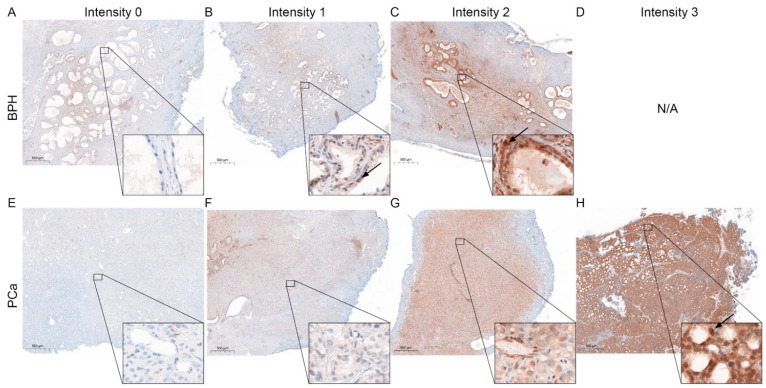
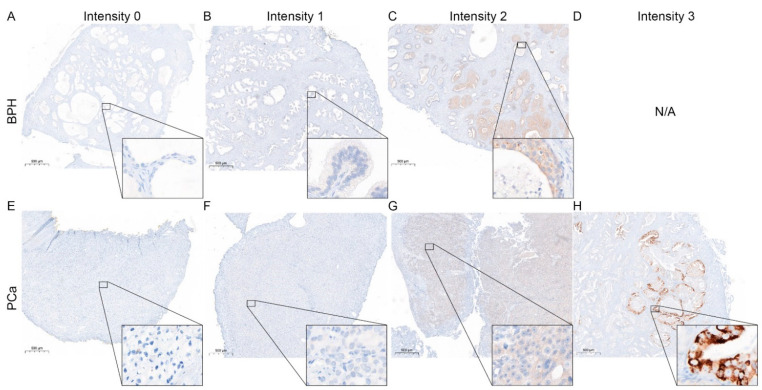
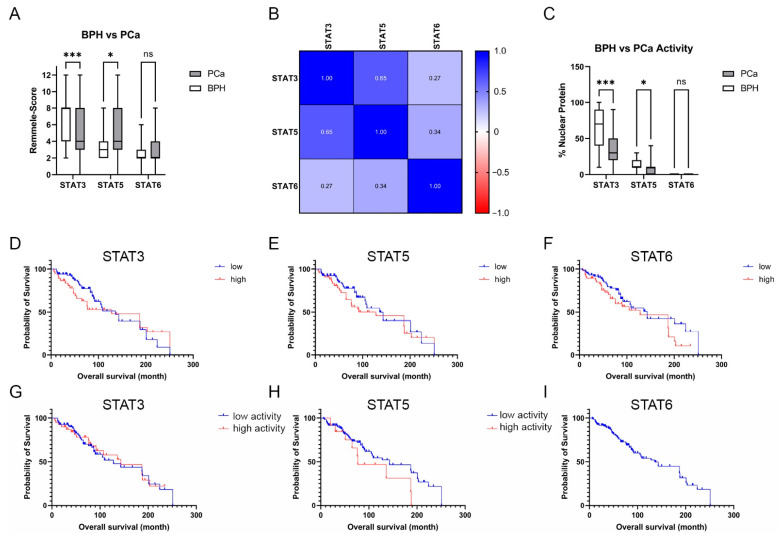
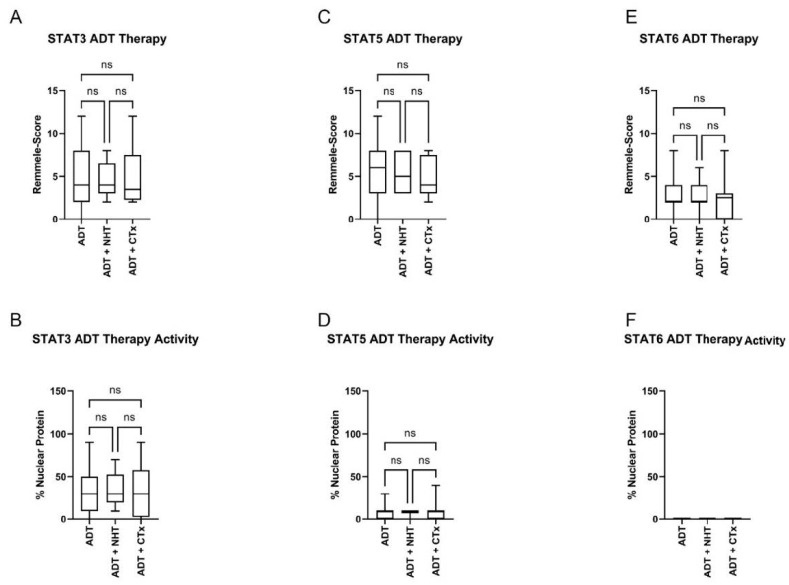
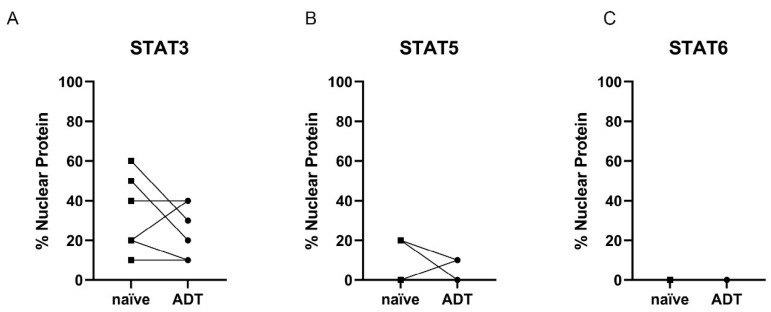
Signal Transducer and Activator of Transcription (STAT) proteins have been identified as drivers of prostate cancer (PCa) progression and development of aggressive castration-resistant phenotypes. In particular, STAT3, 5, and 6 have been linked to resistance to androgen receptor inhibition and metastasis in in vitro and in vivo models. This descriptive study aimed to validate these preclinical data in tissue obtained from patients with PCa before and while under androgen-deprivation therapy. Therefore, STAT3, 5, and 6 expressions and activity were assessed by immunohistochemistry. The data revealed that STAT3 and 5 changed in PCa. However, there was no relationship between expression and survival. Moreover, due to the heterogeneous nature of PCa, the preclinical results could not be transferred congruently to the patient's material. A pilot study with a longitudinal patient cohort could also show this heterogeneous influence of systemic therapy on STAT3, 5, and 6 expressions and activity. Even if the main mechanisms were validated, these data demonstrate the urge for better patient-near preclinical models. Therefore, these data reflect the need for investigations of STAT proteins in a longitudinal patient cohort to identify factors responsible for the diverse influence of system therapy on STAT expression.

Keywords: CRPC; HSPC; STAT3; STAT5; STAT6; androgen deprivation therapy; chemotherapy; novel hormonal therapy; therapy resistance.


Conflict of interest statement

The authors declare no conflict of interest.

Figures

Figure 1
Figure 1
Kaplan–Meier analysis of the PCa cohort. (A) Kaplan–Meier analysis of the HSPC vs. the ADT therapy cohort; (B) Kaplan–Meier analysis of the different ADT cohorts.
Figure 2
Figure 2
Representative STAT3 staining in BPH and PCa. (AD) Immunohistochemical staining for STAT3 of representative benign tissue with different staining intensities cores. Scale bar = 500 μM. (EH) Immunohistochemical staining for STAT3 of representative malignant tissue with different staining intensities cores. Arrows mark representative nuclear localization. Scale bar = 500 μM.
Figure 3
Figure 3
Representative STAT5 staining in BPH and PCa. (AD) Immunohistochemical staining for STAT5 of representative benign tissue with different staining intensities cores. Scale bar = 500 μM. (EH) Immunohistochemical staining for STAT5 of representative malignant tissue with different staining intensities cores. Arrows mark representative nuclear localization. Scale bar = 500 μM.
Figure 4
Figure 4
Representative STAT6 staining in BPH and PCa. (AD) Immunohistochemical staining for STAT6 of representative benign tissue with different staining intensities cores. Scale bar = 500 μM. (EH) Immunohistochemical staining for STAT6 of representative malignant tissue with different staining intensities cores. Scale bar = 500 μM.
Figure 5
Figure 5
Evaluation of the STAT3, 5, and 6 protein staining in BPH and PCa. (A) Evaluation of the expression of STAT3,5, and 6 of BPH and PCa tissue using the Remmele score. Data are shown as box and whisker diagrams (ns: not significant,*: p ≤ 0.05, ***: p ≤ 0.001). (B) Pearson correlation of STAT3, 5, and 6 in PCa tissue. The r-values are displayed in a heat map. (C) Evaluation of the % STAT3, 5, and 6 nuclear localization in BPH and PCa tissue as a surrogate for the activity of the transcription factors. Data are shown as box and whisker diagrams (ns—not significant; *: p ≤ 0.05, ***: p ≤ 0.001). (DF) OS analysis of patients with low and high STAT3, 5, or 6 expressions (D) Kaplan–Meier curves indicating OS according to the STAT3 expression level of the PCa cohort. The median STAT3-IRS was chosen as the threshold. (E) Kaplan–Meier curves indicate OS according to STAT3 expression level. The median STAT5-IRS was selected as the threshold. (F) Kaplan–Meier curves indicate OS according to STAT6 expression level. The median STAT6-IRS was chosen as the threshold. (GI) OS analysis of patients with low and high STAT3, 5, or 6 activity. (G) Kaplan–Meier curves indicating OS according to the STAT3 expression level of the PCa cohort. The median % of nuclear STAT3 was chosen as the threshold. (H) Kaplan–Meier curves indicate OS according to STAT3 expression level. The median % of nuclear STAT5 was selected as the threshold. (I) Kaplan–Meier curves indicate OS according to STAT6 activity.
Figure 6
Figure 6
Evaluation of the STAT3, 5, and 6 levels and activity in HSPC and ADT subgroups. (A) Evaluation of the expression of STAT3,5, and 6 in PCa tissue of the HSPC and ADT subgroups using the Remmele score. Data are shown as box and whisker diagrams (ns.: not significant). (B) Evaluation of the % STAT3, 5, and 6 nuclear localization in PCa tissue of the HSPC and ADT subgroups as a surrogate for the activity of the transcription factors. Data are shown as box and whisker diagrams (ns.: not significant).
Figure 7
Figure 7
Evaluation of the STAT3, 5, and 6 levels (A+C+E) and activity in HSPC and ADT subgroups (B+D+F). (A+C+E) Evaluation of the expression of STAT3 (A), 5 (C), and 6 (E) in PCa tissue of the HSPC and ADT subgroups using the Remmele score. Data are shown as box and whisker diagrams (ns.: not significant). (B+D+F) Evaluation of the % STAT3 (B), 5 (D), and 6 (F) nuclear localization in PCa tissue of the HSPC and ADT subgroups as a surrogate for the activity of the transcription factors. Data are shown as box and whisker diagrams (ns.: not significant).
Figure 8
Figure 8
Evaluation of the STAT3, 5, and 6 levels in HSPC (naïve) and ADT subgroups. Evaluation of the expression of STAT3 (A), 5 (B), and 6 (C) in PCa tissue of the HSPC and ADT subgroups using the Remmele score. Individual data points are shown. Corresponding patient data before and under ADT have been connected.
Figure 9
Figure 9
Evaluation of the STAT3, 5, and 6 activity in HSPC (naïve) and ADT subgroups. (A+B+C) Evaluation of the % STAT3 (A), 5 (B), and 6 (C) nuclear localization in PCa tissue of the HSPC and ADT subgroups as a surrogate for the activity of the transcription factors. Individual data points are shown. Corresponding patient data before and under ADT have been connected.

References

    1. Sung H., Ferlay J., Siegel R.L., Laversanne M., Soerjomataram I., Jemal A., Bray F. Global Cancer Statistics 2020: Globocan Estimates of Incidence and Mortality Worldwide for 36 Cancers in 185 Countries. CA Cancer J. Clin. 2021;71:209–249. doi: 10.3322/caac.21660. - DOI - PubMed
    1. Mottet N., van den Bergh R.C.N., Briers E., van den Broeck T., Cumberbatch M.G., De Santis M., Fanti S., Fossati N., Gandaglia G., Gillessen S., et al. EAU-EANM-ESTRO-ESUR-SIOG Guidelines on Prostate Cancer—2020 Update. Part 1: Screening, Diagnosis, and Local Treatment with Curative Intent. Eur. Urol. 2021;79:243–262. doi: 10.1016/j.eururo.2020.09.042. - DOI - PubMed
    1. Siegel D.A., O’Neil M.E., Richards T.B., Dowling N.F., Weir H.K. Prostate Cancer Incidence and Survival, by Stage and Race/Ethnicity—United States, 2001–2017. MMWR Morb. Mortal. Wkly. Rep. 2020;69:1473–1480. doi: 10.15585/mmwr.mm6941a1. - DOI - PMC - PubMed
    1. Cornford P., van den Bergh R.C.N., Briers E., van den Broeck T., Cumberbatch M.G., De Santis M., Fanti S., Fossati N., Gandaglia G., Gillessen S., et al. EAU-EANM-ESTRO-ESUR-SIOG Guidelines on Prostate Cancer. Part II—2020 Update: Treatment of Relapsing and Metastatic Prostate Cancer. Eur. Urol. 2021;79:263–282. doi: 10.1016/j.eururo.2020.09.046. - DOI - PubMed
    1. Ebersbach C., Beier A.-M.K., Thomas C., Erb H.H.H. Impact of STAT Proteins in Tumor Progress and Therapy Resistance in Advanced and Metastasized Prostate Cancer. Cancers. 2021;13:4854. doi: 10.3390/cancers13194854. - DOI - PMC - PubMed