. 2022 Feb 3;12(2):209.
doi: 10.3390/jpm12020209.

Causal Effect of the Tokyo 2020 Olympic and Paralympic Games on the Number of COVID-19 Cases under COVID-19 Pandemic: An Ecological Study Using the Synthetic Control Method

Affiliations

Causal Effect of the Tokyo 2020 Olympic and Paralympic Games on the Number of COVID-19 Cases under COVID-19 Pandemic: An Ecological Study Using the Synthetic Control Method

Norio Yamamoto et al. J Pers Med. .

Abstract

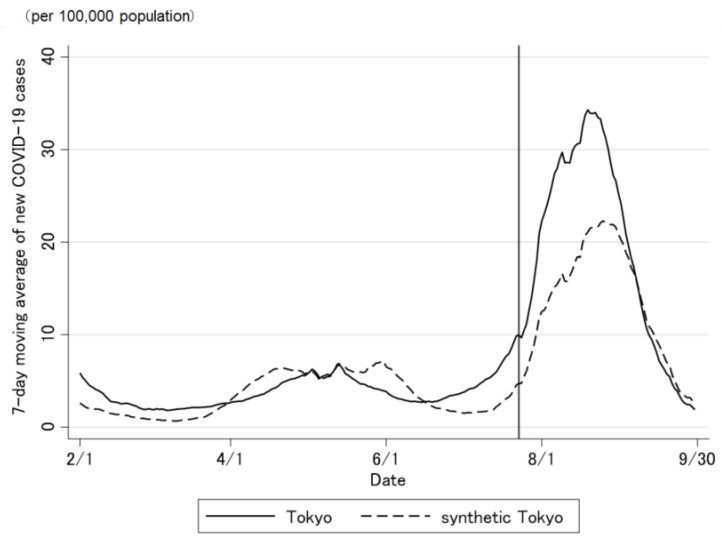
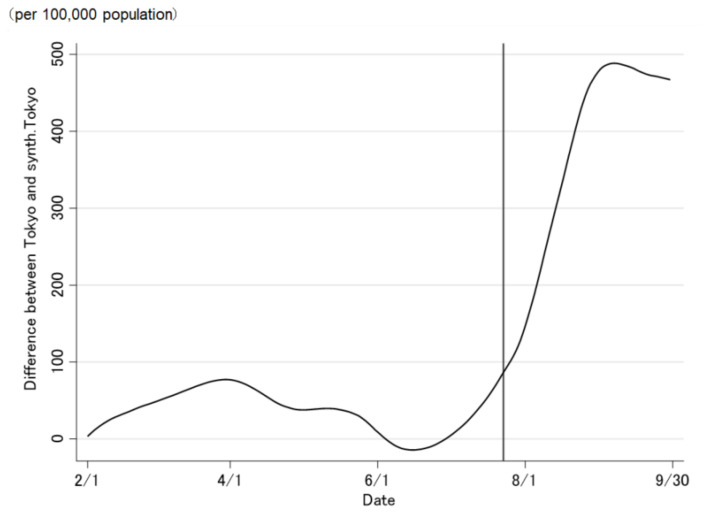
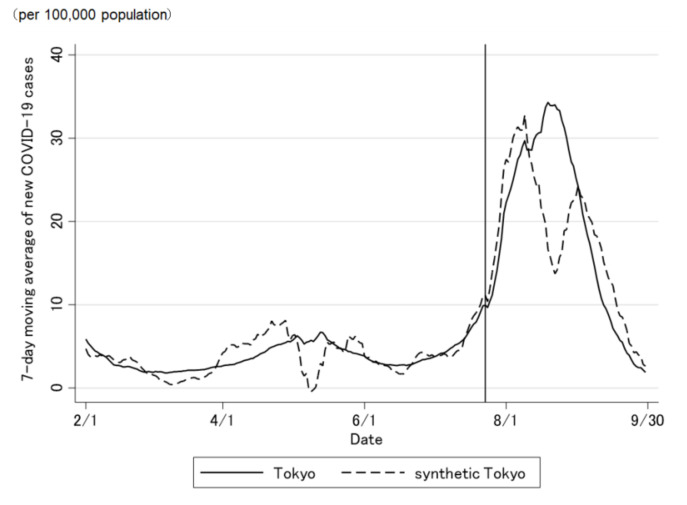
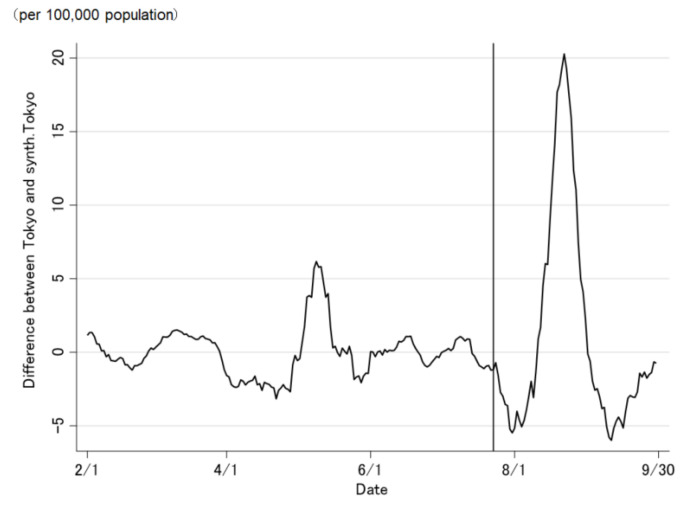
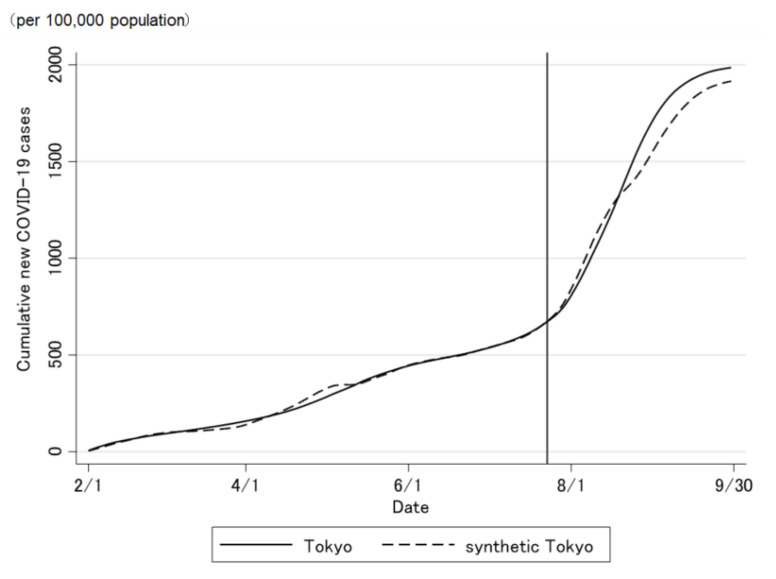
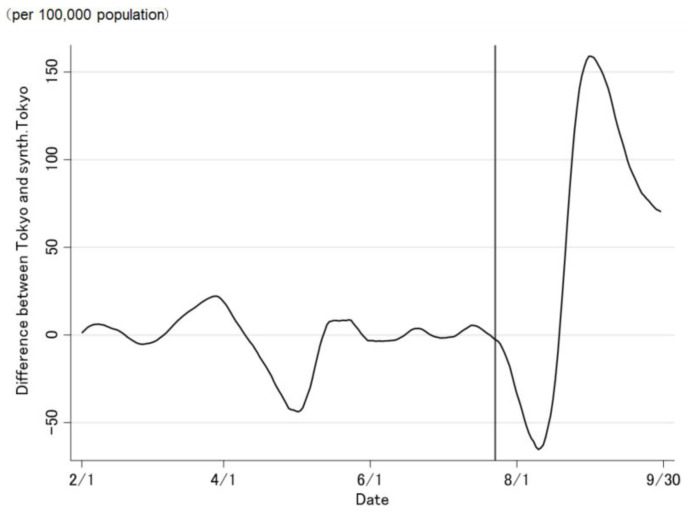
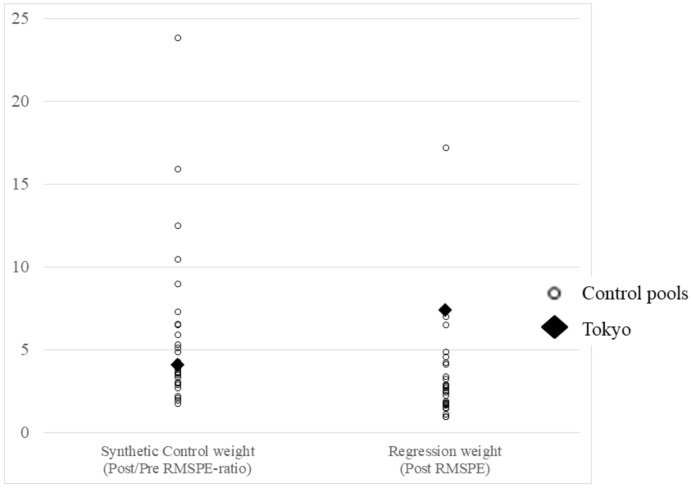
Previous studies have not assessed the causal effect of the Olympic Games on the spread of pandemics. Using the synthetic control method and the national public city data in Japan recorded from February to September 2021, we estimated the causal effects of the Tokyo 2020 Olympic and Paralympic Games on the number of coronavirus disease 2019 (COVID-19) cases. The difference between the number of COVID-19 cases in Tokyo and a counterfactual "synthetic Tokyo" (created using synthetic control method) after the opening of the Tokyo 2020 Games (23 July 2021) widened gradually and then considerably over time. It was predicted that the Tokyo 2020 Games increased the number of COVID-19 cases in Tokyo by approximately 469.4 per 100,000 population from the opening of the event to 30 September. However, sensitivity analysis of the ratio of the pre- and post-game root mean square prediction errors using regression weights did not suggest robustness. Our results showed that the Tokyo 2020 Games probably increased the number of COVID-19 cases even under preventive regulations; however, the extent of this increase was difficult to estimate clearly due to an overlap with the fifth wave associated with the Delta variant.

Keywords: COVID-19; Olympic and Paralympic Games; Tokyo 2020; causal effect; ecological study; pandemic; synthetic control method.


Conflict of interest statement

The authors declare no conflict of interest.

Figures

Figure 1
Figure 1
Map of the 47 prefectures in Japan. Red—Tokyo (host city); Green—prefectures where the Tokyo 2020 games were held; Blue—donor pool (29 prefectures west of Toyama, Gifu, and Aichi).
Figure 2
Figure 2
Trends in the daily number of newly confirmed COVID-19 cases in Tokyo and synthetic Tokyo, estimated using synthetic control weights. The vertical line on 23 July 2021 indicates the opening of The Tokyo 2020 Games.
Figure 3
Figure 3
Difference in the daily number of newly confirmed COVID-19 cases between Tokyo and synthetic Tokyo, estimated using synthetic control weights.
Figure 4
Figure 4
Trends of the cumulative daily number of newly confirmed COVID-19 cases in Tokyo and synthetic Tokyo, determined using synthetic control weights.
Figure 5
Figure 5
Difference in the cumulative daily number of newly confirmed COVID-19 cases between Tokyo and synthetic Tokyo, estimated using synthetic control weights.
Figure 6
Figure 6
Trends of the daily number of newly confirmed COVID-19 cases in Tokyo and synthetic Tokyo, determined using regression weights.
Figure 7
Figure 7
Difference in the daily number of newly confirmed COVID-19 cases between Tokyo and synthetic Tokyo, determined using regression weights.
Figure 8
Figure 8
Trends of the cumulative daily number of newly confirmed COVID-19 cases in Tokyo and synthetic Tokyo, determined using regression weights.
Figure 9
Figure 9
Difference in the cumulative daily number of newly confirmed COVID-19 cases between Tokyo and synthetic Tokyo, determined using regression weights.
Figure 10
Figure 10
Total results of the synthetic control weights and regression weights. RMSPE—root mean square prediction error. Tokyo ranks 15th in the synthetic control weight analysis and second in the regression weight analysis.

Similar articles

Cited by

References

    1. Cutler D.M., Summers L.H. The COVID-19 pandemic and the $16 trillion virus. JAMA. 2020;324:1495–1496. doi: 10.1001/jama.2020.19759. - DOI - PMC - PubMed
    1. Abadie A., Diamond A., Hainmueller J. Synthetic control methods for comparative case studies: Estimating the effect of California’s tobacco control program. J. Am. Stat. Assoc. 2010;105:493–505. doi: 10.1198/jasa.2009.ap08746. - DOI
    1. Abadie A., Gardeazabal J. The economic costs of conflict: A case study of the Basque Country. Am. Econ. Rev. 2003;93:113–132. doi: 10.1257/000282803321455188. - DOI
    1. Born B., Dietrich A.M., Müller G.J. The lockdown effect: A counterfactual for Sweden. PLoS ONE. 2021;16:e0249732. doi: 10.1371/journal.pone.0249732. - DOI - PMC - PubMed
    1. Mitze T., Kosfeld R., Rode J., Wälde K. Face masks considerably reduce COVID-19 cases in Germany. Proc. Natl. Acad. Sci. USA. 2020;117:32293–32301. doi: 10.1073/pnas.2015954117. - DOI - PMC - PubMed

LinkOut - more resources