. 2022 Feb 19;12(2):315.
doi: 10.3390/jpm12020315.

Artificial Intelligence-Enabled Electrocardiogram Estimates Left Atrium Enlargement as a Predictor of Future Cardiovascular Disease

Affiliations

Artificial Intelligence-Enabled Electrocardiogram Estimates Left Atrium Enlargement as a Predictor of Future Cardiovascular Disease

Yu-Sheng Lou et al. J Pers Med. .

Abstract

Background: Left atrium enlargement (LAE) can be used as a predictor of future cardiovascular diseases, including hypertension (HTN) and atrial fibrillation (Afib). Typical electrocardiogram (ECG) changes have been reported in patients with LAE. This study developed a deep learning model (DLM)-enabled ECG system to identify patients with LAE.

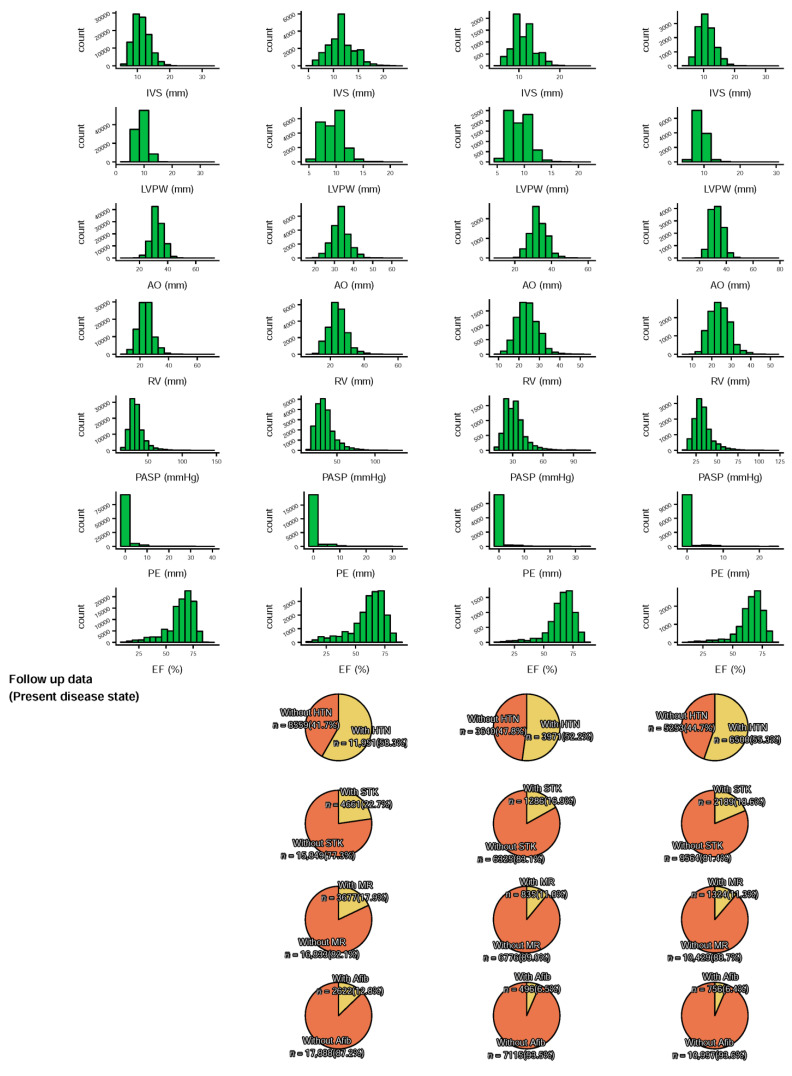
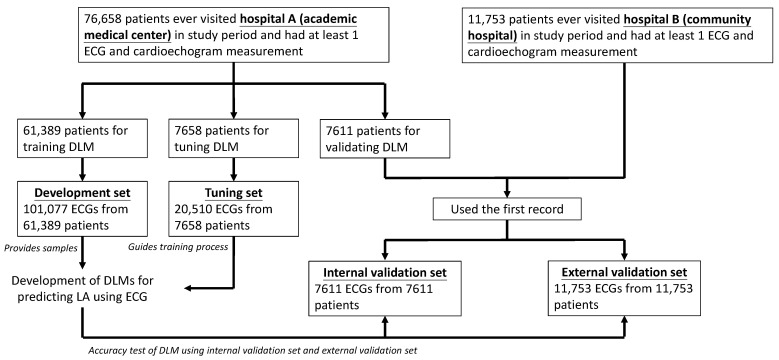
Method: Patients who had ECG records with corresponding echocardiography (ECHO) were included. There were 101,077 ECGs, 20,510 ECGs, 7611 ECGs, and 11,753 ECGs in the development, tuning, internal validation, and external validation sets, respectively. We evaluated the performance of a DLM-enabled ECG for diagnosing LAE and explored the prognostic value of ECG-LAE for new-onset HTN, new-onset stroke (STK), new-onset mitral regurgitation (MR), and new-onset Afib.

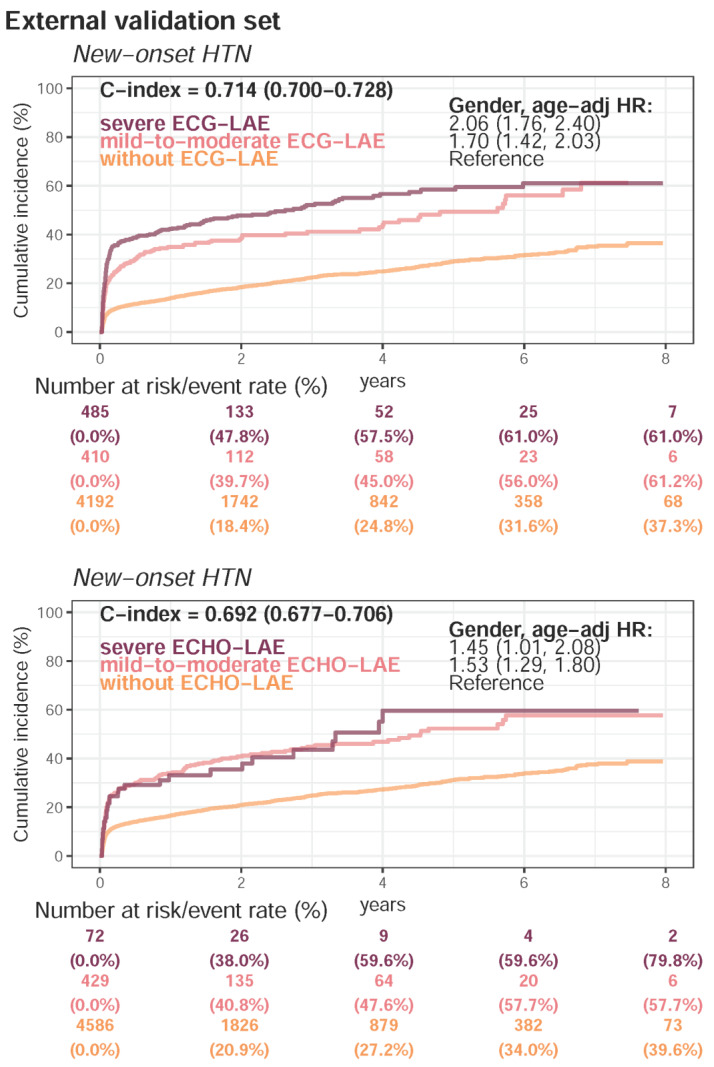
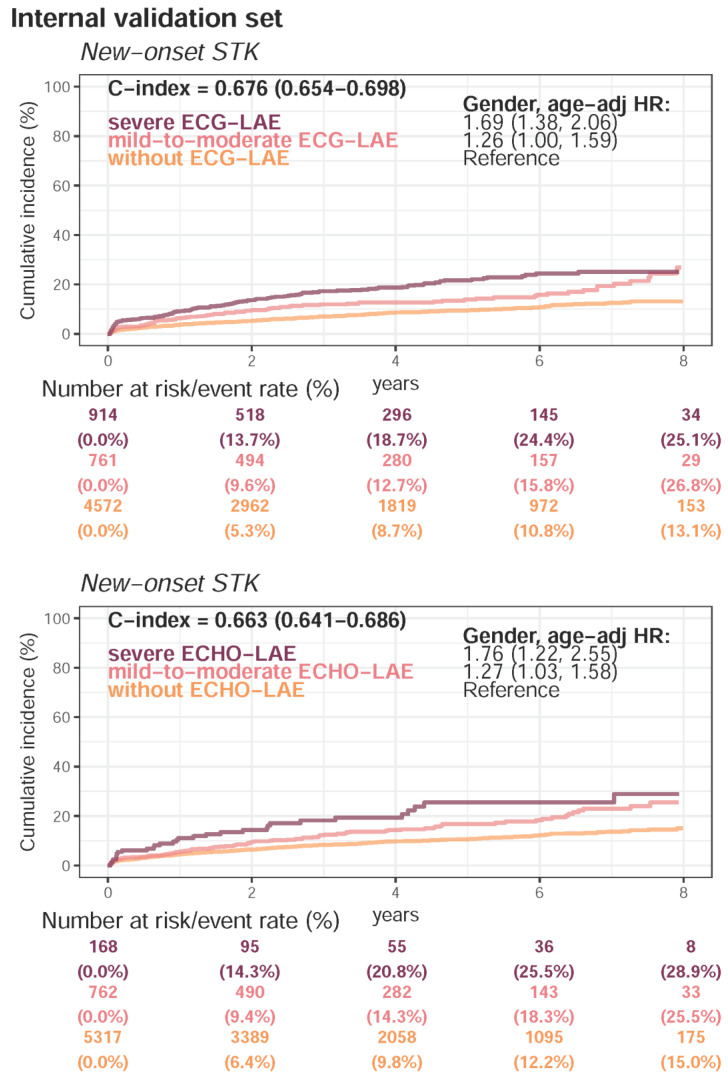
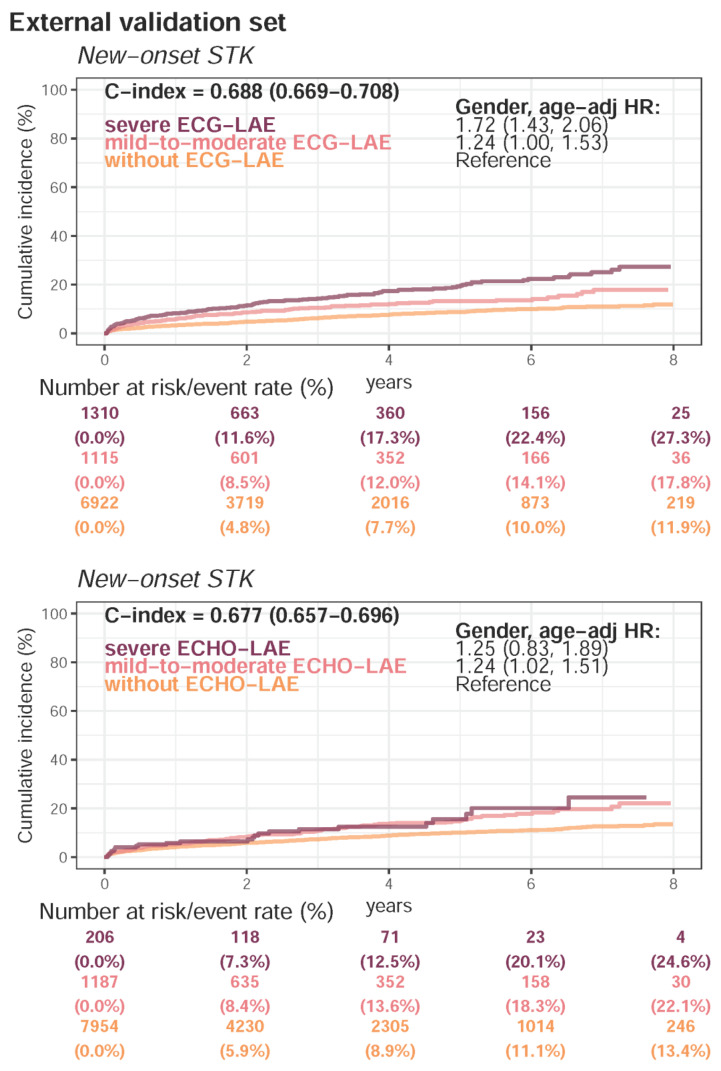
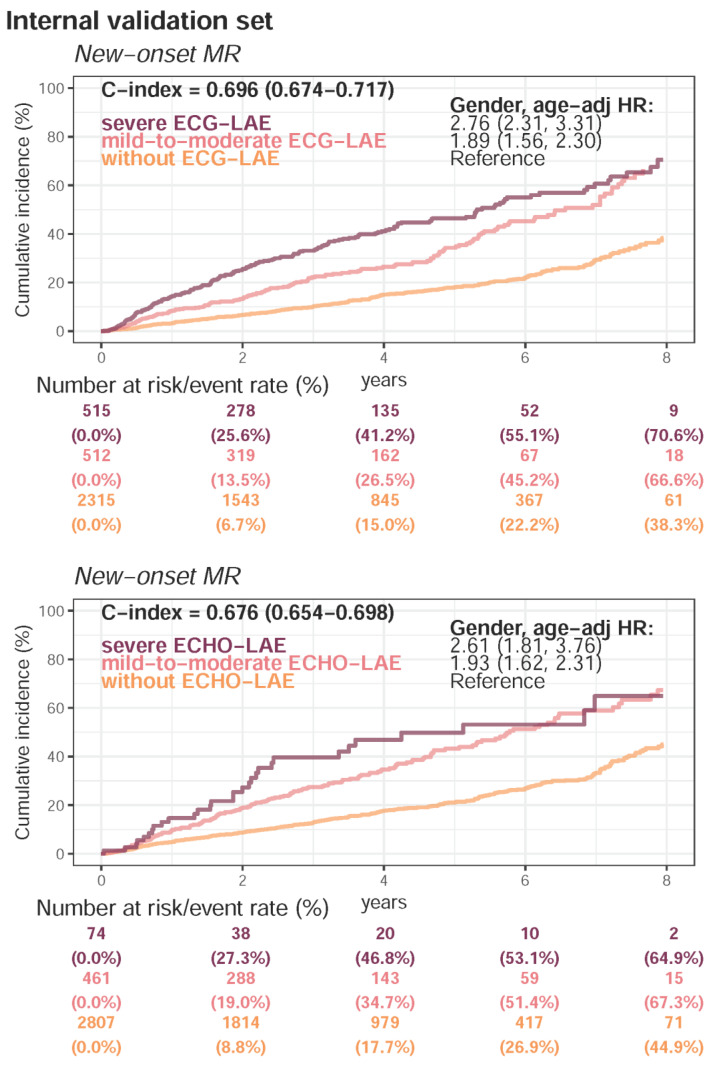
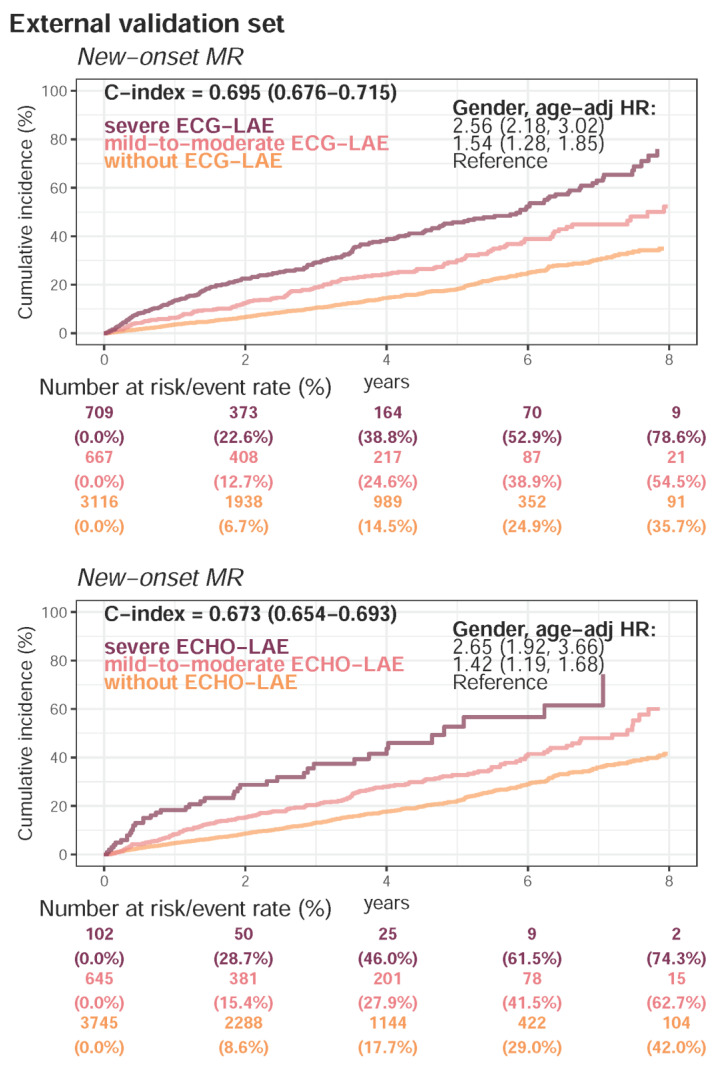
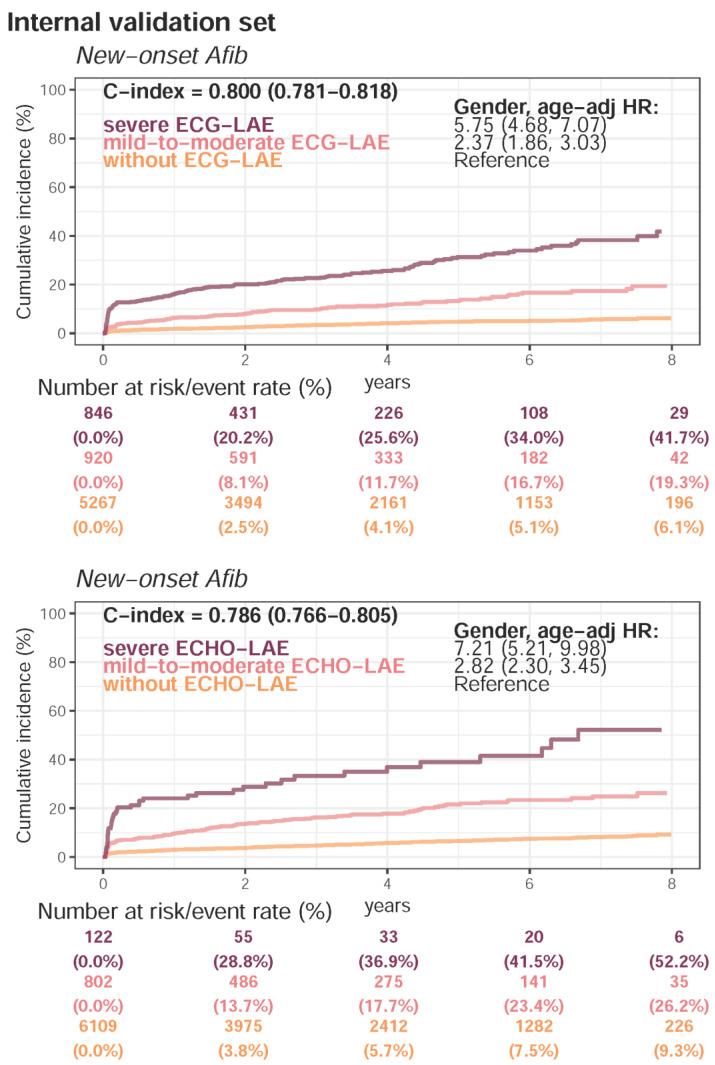
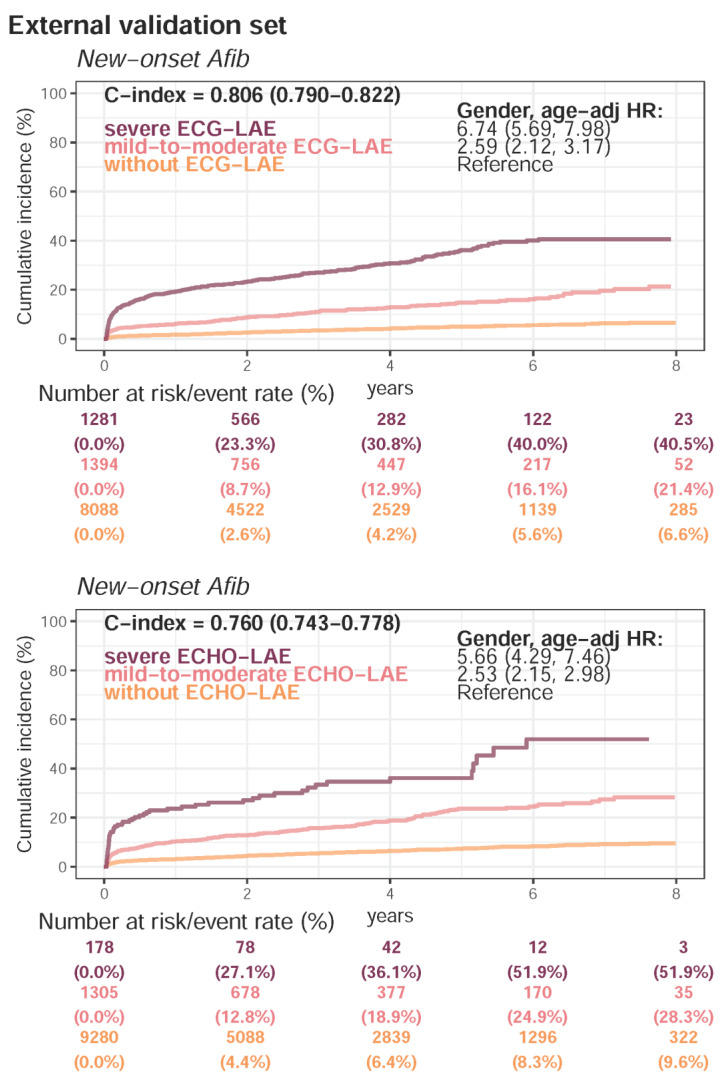
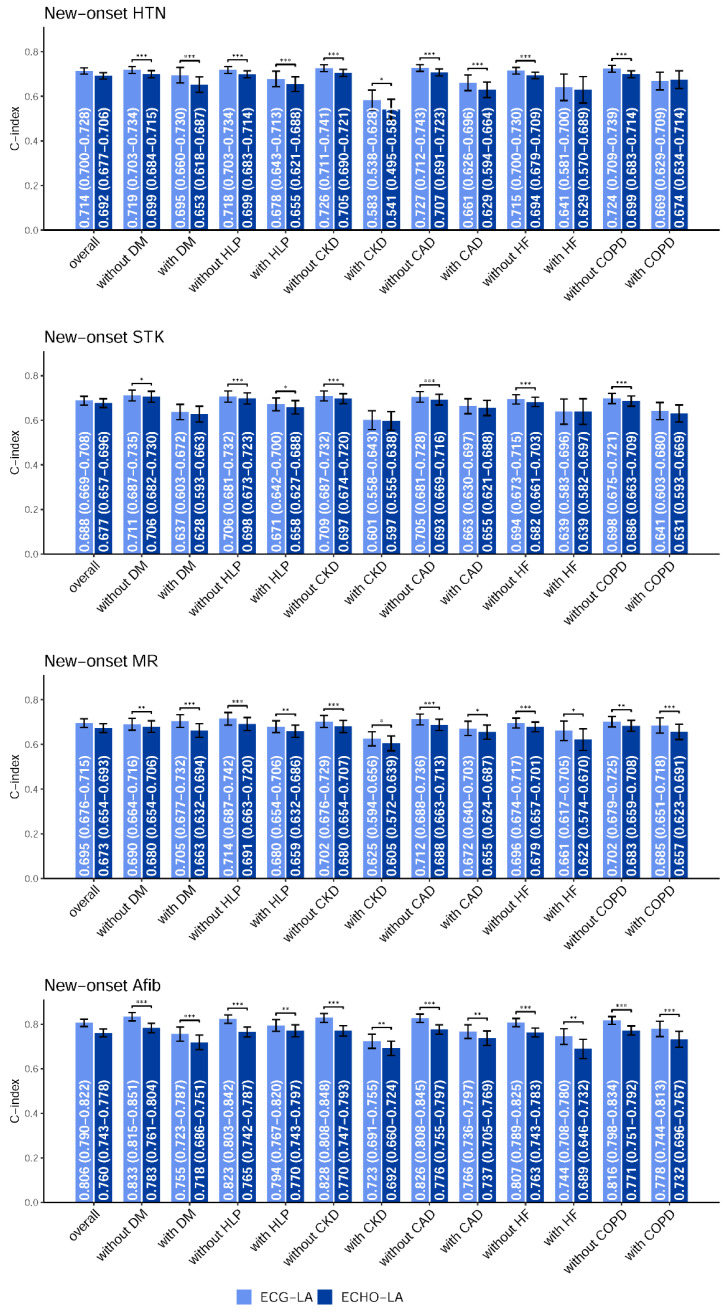
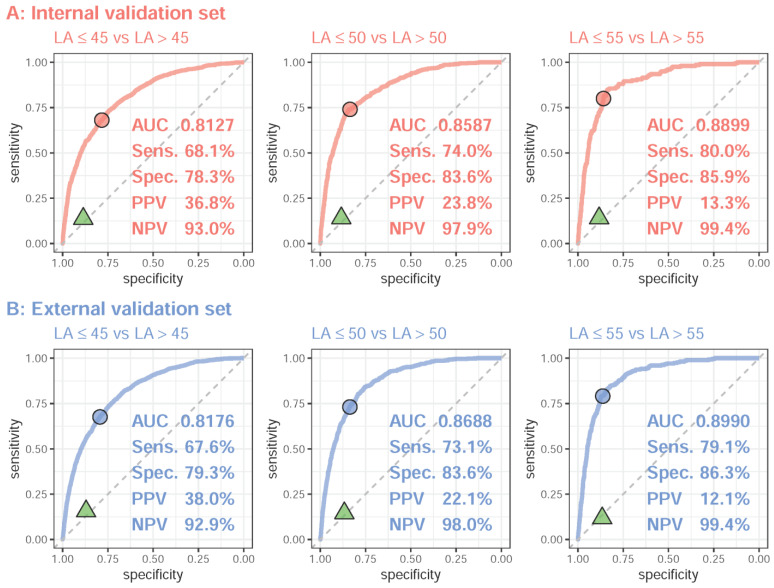
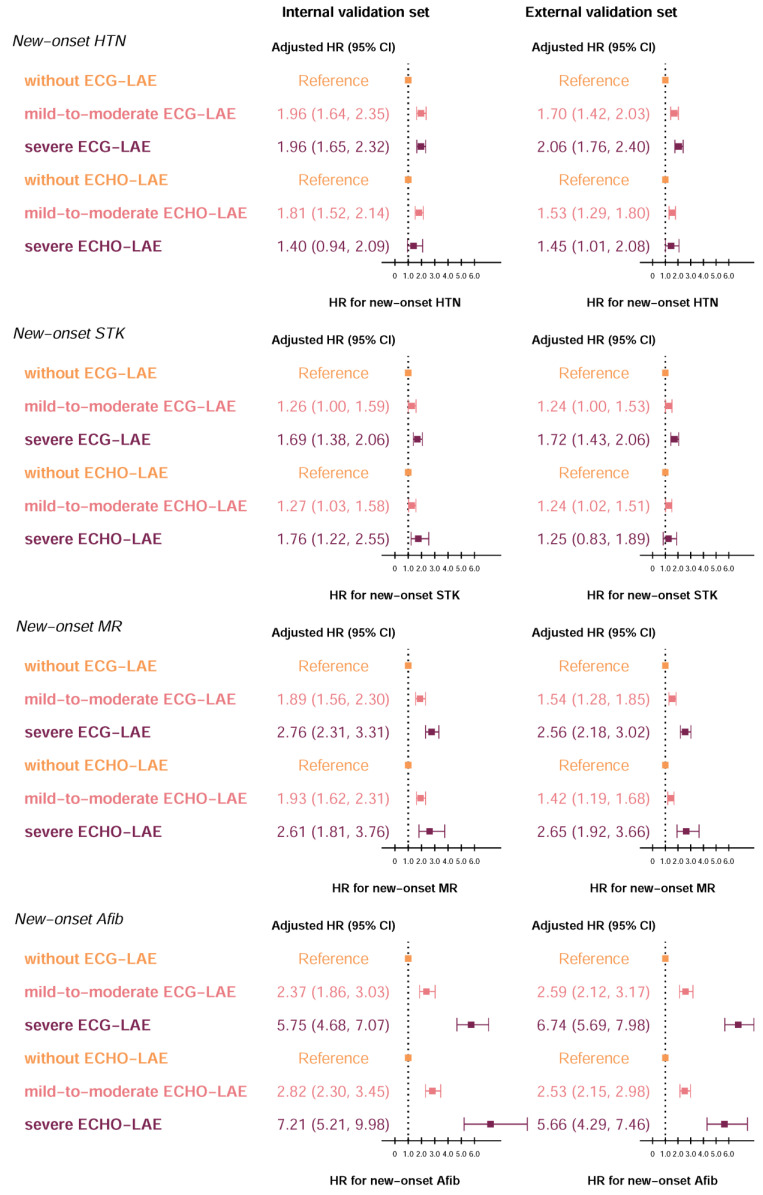
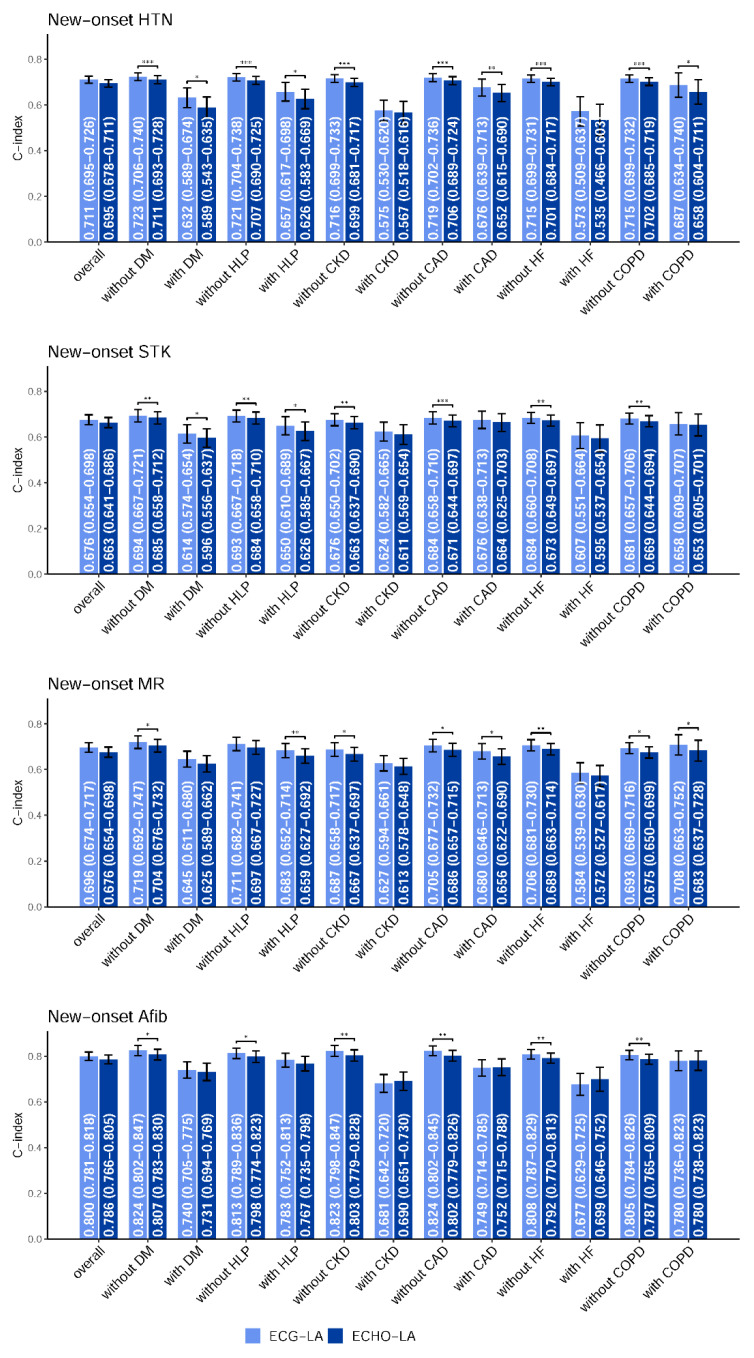
Results: The DLM-enabled ECG achieved AUCs of 0.8127/0.8176 for diagnosing mild LAE, 0.8587/0.8688 for diagnosing moderate LAE, and 0.8899/0.8990 for diagnosing severe LAE in the internal/external validation sets. Notably, ECG-LAE had higher prognostic value compared to ECHO-LAE, which had C-indices of 0.711/0.714 compared to 0.695/0.692 for new-onset HTN, 0.676/0.688 compared to 0.663/0.677 for new-onset STK, 0.696/0.695 compared to 0.676/0.673 for new-onset MR, and 0.800/0.806 compared to 0.786/0.760 for new-onset Afib in internal/external validation sets, respectively.

Conclusions: A DLM-enabled ECG could be considered as a LAE screening tool and provide better prognostic information for related cardiovascular diseases.

Keywords: artificial intelligence; deep learning; electrocardiogram; left atrium; left atrium enlargement; new-onset atrial fibrillation; new-onset hypertension; new-onset mitral regurgitation; new-onset stroke.


Conflict of interest statement

The authors declare no competing interest.

Figures

Figure A1
Figure A1
Summary of the baseline distributions in development, tuning, internal validation, and external validation sets. Abbreviations: ECHO, echocardiography; BMI, body mass index; DM, diabetes mellitus; HLP, hyperlipidemia; CKD, chronic kidney disease; CAD, coronary artery disease; HF, heart failure; COPD, chronic obstructive pulmonary disease; LA, left atrium; LV-D, left ventricle (end-diastole); LV-S, left ventricle (end-systole); IVS, interventricular septum; LVPW, left ventricular posterior wall; AO, aortic root; RV, right ventricle; PASP, pulmonary artery systolic pressure; PE, pericardial effusion; EF, ejection fraction; HTN, hypertension; STK, stroke; MR, mitral regurgitation; Afib, atrial fibrillation.
Figure A1
Figure A1
Summary of the baseline distributions in development, tuning, internal validation, and external validation sets. Abbreviations: ECHO, echocardiography; BMI, body mass index; DM, diabetes mellitus; HLP, hyperlipidemia; CKD, chronic kidney disease; CAD, coronary artery disease; HF, heart failure; COPD, chronic obstructive pulmonary disease; LA, left atrium; LV-D, left ventricle (end-diastole); LV-S, left ventricle (end-systole); IVS, interventricular septum; LVPW, left ventricular posterior wall; AO, aortic root; RV, right ventricle; PASP, pulmonary artery systolic pressure; PE, pericardial effusion; EF, ejection fraction; HTN, hypertension; STK, stroke; MR, mitral regurgitation; Afib, atrial fibrillation.
Figure A2
Figure A2
Kaplan–Meier curves for each severity of electrocardiogram-based left atrium enlargement (ECG-LAE) and echocardiography-based left atrium enlargement (ECHO-LAE) on new-onset hypertension (HTN) in internal validation set. The cutoff points of without, mild-to-moderate, and severe LAE were defined as 45 and 55 mm, respectively. The C-index was calculated based on the continuous value combined with sex and age. The table shows the at-risk population and cumulative risk for the given time intervals in each risk stratification.
Figure A3
Figure A3
Kaplan–Meier curves for each severity of electrocardiogram-based left atrium enlargement (ECG-LAE) and echocardiography-based left atrium enlargement (ECHO-LAE) on new-onset hypertension (HTN) in external validation set. The cutoff points of without, mild-to-moderate, and severe LAE were defined as 45 and 55 mm, respectively. The C-index was calculated based on the continuous value combined with sex and age. The table shows the at-risk population and cumulative risk for the given time intervals in each risk stratification.
Figure A4
Figure A4
Kaplan–Meier curves for each severity of electrocardiogram-based left atrium enlargement (ECG-LAE) and echocardiography-based left atrium enlargement (ECHO-LAE) on new-onset stroke (STK) in internal validation set. The cutoff points of without, mild-to-moderate, and severe LAE were defined as 45 and 55 mm, respectively. The C-index was calculated based on the continuous value combined with sex and age. The table shows the at-risk population and cumulative risk for the given time intervals in each risk stratification.
Figure A5
Figure A5
Kaplan–Meier curves for each severity of electrocardiogram-based left atrium enlargement (ECG-LAE) and echocardiography-based left atrium enlargement (ECHO-LAE) on new-onset stroke (STK) in external validation set. The cutoff points of without, mild-to-moderate, and severe LAE were defined as 45 and 55 mm, respectively. The C-index was calculated based on the continuous value combined with sex and age. The table shows the at-risk population and cumulative risk for the given time intervals in each risk stratification.
Figure A6
Figure A6
Kaplan–Meier curves for each severity of electrocardiogram-based left atrium enlargement (ECG-LAE) and echocardiography-based left atrium enlargement (ECHO-LAE) on new-onset mitral regurgitation (MR) in internal validation set. The cutoff points of without, mild-to-moderate, and severe LAE were defined as 45 and 55 mm, respectively. The C-index was calculated based on the continuous value combined with sex and age. The table shows the at-risk population and cumulative risk for the given time intervals in each risk stratification.
Figure A7
Figure A7
Kaplan–Meier curves for each severity of electrocardiogram-based left atrium enlargement (ECG-LAE) and echocardiography-based left atrium enlargement (ECHO-LAE) on new-onset mitral regurgitation (MR) in external validation set. The cutoff points of without, mild-to-moderate, and severe LAE were defined as 45 and 55 mm, respectively. The C-index was calculated based on the continuous value combined with sex and age. The table shows the at-risk population and cumulative risk for the given time intervals in each risk stratification.
Figure A8
Figure A8
Kaplan–Meier curves for each severity of electrocardiogram-based left atrium enlargement (ECG-LAE) and echocardiography-based left atrium enlargement (ECHO-LAE) on new-onset atrial fibrillation (Afib) in internal validation set. The cutoff points of without, mild-to-moderate, and severe LAE were defined as 45 and 55 mm, respectively. The C-index was calculated based on the continuous value combined with sex and age. The table shows the at-risk population and cumulative risk for the given time intervals in each risk stratification.
Figure A9
Figure A9
Kaplan–Meier curves for each severity of electrocardiogram-based left atrium enlargement (ECG-LAE) and echocardiography-based left atrium enlargement (ECHO-LAE) on new-onset atrial fibrillation (Afib) in external validation set. The cutoff points of without, mild-to-moderate, and severe LAE were defined as 45 and 55 mm, respectively. The C-index was calculated based on the continuous value combined with sex and age. The table shows the at-risk population and cumulative risk for the given time intervals in each risk stratification.
Figure A10
Figure A10
Stratified analysis for the C-index comparison between electrocardiogram-based left atrium (ECG-LA) diameter and echocardiography-based left atrium (ECHO-LA) diameter on new-onset complications in external validation set. The analyses were stratified by the disease histories of the populations. The C-index was calculated based on the ECG-LA/ECHO-LA combined with sex and age. *: p < 0.05; **: p < 0.01; ***: p < 0.001. The overall population analyses were performed with an unstratified Cox proportional-hazards model.
Figure 1
Figure 1
Development, tuning, internal validation, and external validation set generation and ECG labeling of the left atrium in a private dataset. Illustration of the dataset generation. This dataset creation was designed to assure the reliability and robustness of the data for training, tuning, and validation of the deep learning model. To avoid cross-contamination, once patients were included in one of the datasets, patients were not included in other datasets. The details of the workflow and the usage of each dataset are described in the Methods.
Figure 2
Figure 2
Scatter plots of the predicted left atrium (ECG-LA) diameter via an ECG only compared to the actual left atrium (LA) diameter. The x-axis indicates the actual LA diameter, and the y-axis presents the ECG-LA diameter. The highest density is represented by red points, followed by yellow, green, light blue, and dark blue points. We presented the mean difference (Diff), Pearson correlation coefficients (COR), and mean absolute errors (MAE) to demonstrate the accuracy of the DLM. The black lines with 95% confidence intervals are fitted via simple linear regression.
Figure 3
Figure 3
Receiver operating characteristic (ROC) curve analysis for mild to severe left atrium enlargement (LAE) from deep learning model-based ECG voltage–time traces. The ROC curve (x-axis = specificity and y-axis = sensitivity) and the area under the ROC curve (AUC) were calculated using the internal validation set and external validation set. The triangles denote the performance of the LAE diagnosis from the rule-based ECG analysis. The operating point was selected based on the maximum Yunden’s index in the tuning set, which was used to calculate the corresponding sensitivities and specificities in the two validation sets.
Figure 4
Figure 4
Forest plots of the adjusted hazard ratio for each severity of electrocardiogram-based left atrium enlargement (ECG-LAE) and echocardiography-based left atrium enlargement (ECHO-LAE) on new-onset complications. The cutoff points of without, mild-to-moderate, and severe LAE were defined as 45 and 55 mm, respectively. The analyses were conducted in both internal and external validation sets. Hazard ratios are adjusted for sex and age. Abbreviations: HR, Hazard ratios; CI, confidence interval.
Figure 5
Figure 5
Stratified analysis for the C-index comparison between electrocardiogram-based left atrium (ECG-LA) diameter and echocardiography-based left atrium (ECHO-LA) diameter on new-onset complications in internal validation set. The analyses were stratified by the disease histories of the populations. The C-index was calculated based on the ECG-LA/ECHO-LA combined with sex and age. *: p < 0.05; **: p < 0.01; ***: p < 0.001. The overall population analyses were performed with an unstratified Cox proportional-hazards model.

Similar articles

Cited by

References

    1. Pritchett A.M., Jacobsen S.J., Mahoney D.W., Rodeheffer R.J., Bailey K.R., Redfield M.M. Left atrial volume as an index ofleft atrial size: A population-based study. J. Am. Coll. Cardiol. 2003;41:1036–1043. doi: 10.1016/S0735-1097(02)02981-9. - DOI - PubMed
    1. Fang D., Wang N., Chen Q., Wu G., Wu J., Zhang W., Fu G. The association between hyperuricemia and left atrial enlargement in healthy adults. Ann. Transl. Med. 2021;9:1176. doi: 10.21037/atm-21-3402. - DOI - PMC - PubMed
    1. Milan A., Puglisi E., Magnino C., Naso D., Abram S., Avenatti E., Rabbia F., Mulatero P., Veglio F. Left atrial enlargement in essential hypertension: Role in the assessment of subclinical hypertensive heart disease. Blood Press. 2012;21:88–96. doi: 10.3109/08037051.2011.617098. - DOI - PubMed
    1. Su G., Cao H., Xu S., Lu Y., Shuai X., Sun Y., Liao Y., Li J. Left atrial enlargement in the early stage of hypertensive heart disease: A common but ignored condition. J. Clin. Hypertens. 2014;16:192–197. doi: 10.1111/jch.12282. - DOI - PMC - PubMed
    1. Xu Y., Zhao L., Zhang L., Han Y., Wang P., Yu S. Left Atrial Enlargement and the Risk of Stroke: A Meta-Analysis of Prospective Cohort Studies. Front. Neurol. 2020;11:26. doi: 10.3389/fneur.2020.00026. - DOI - PMC - PubMed

LinkOut - more resources