. 2022 Feb 10;15(4):1311.
doi: 10.3390/ma15041311.

Transplantation of Mature Adipocyte-Derived Dedifferentiated Fat Cells Facilitates Periodontal Tissue Regeneration of Class II Furcation Defects in Miniature Pigs

Affiliations

Transplantation of Mature Adipocyte-Derived Dedifferentiated Fat Cells Facilitates Periodontal Tissue Regeneration of Class II Furcation Defects in Miniature Pigs

Daisuke Akita et al. Materials (Basel). .

Abstract

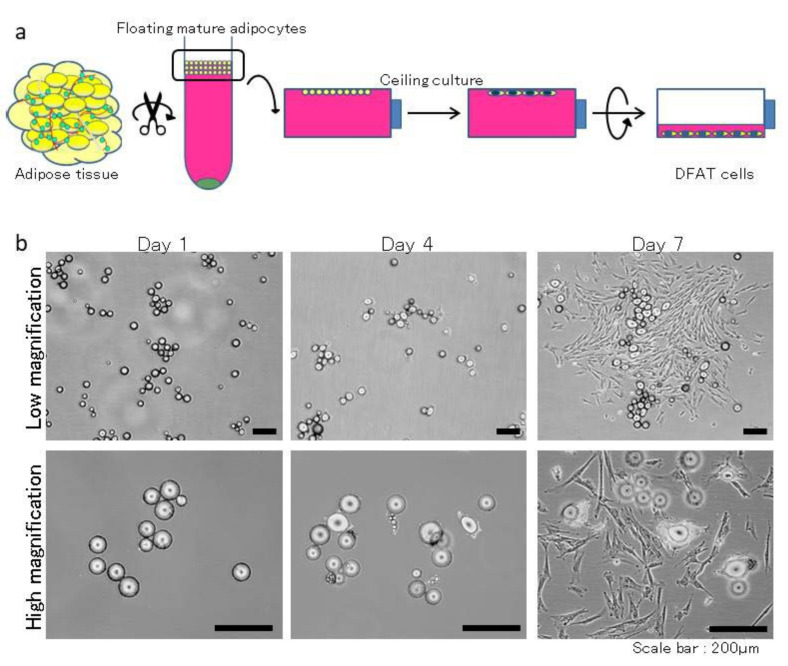
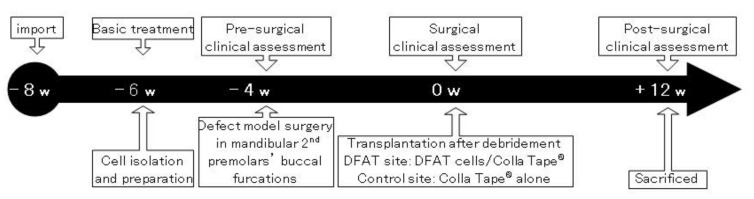
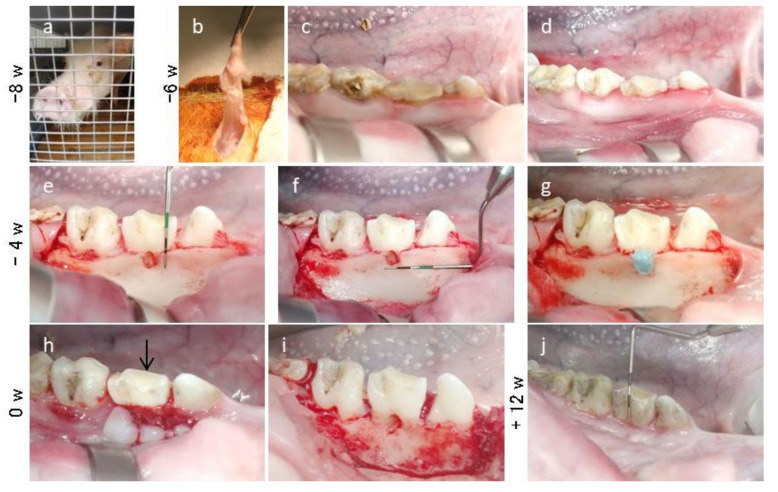
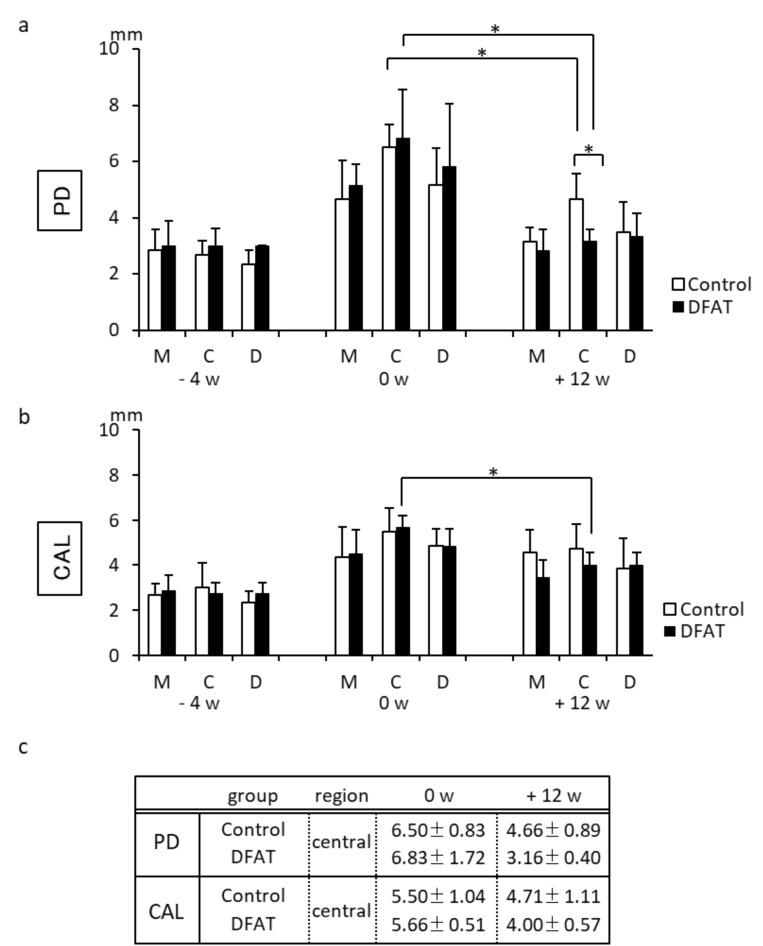
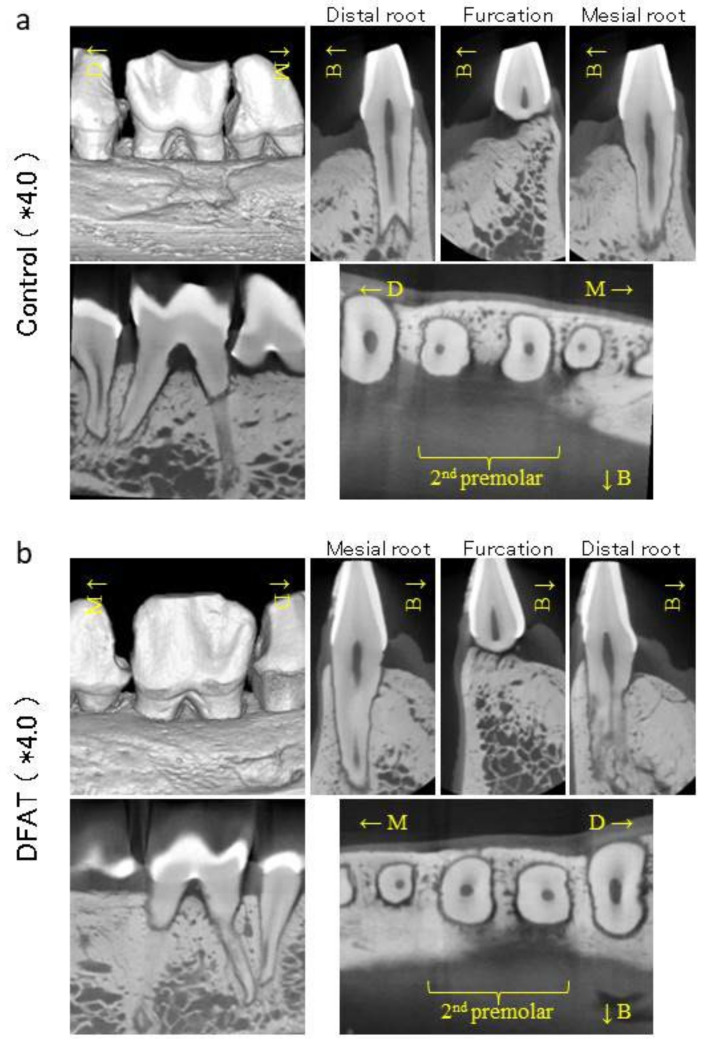
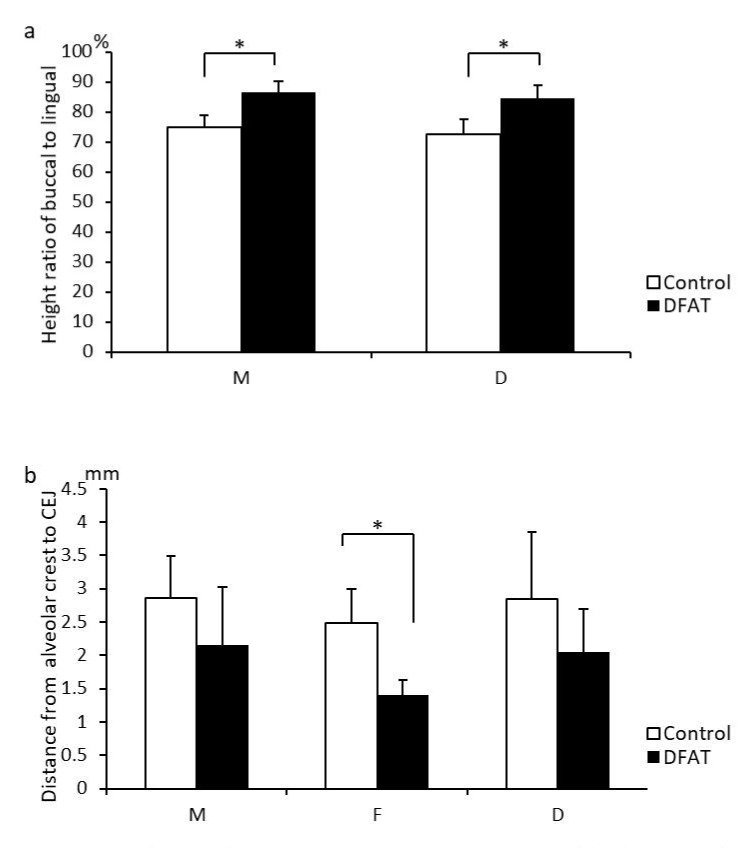
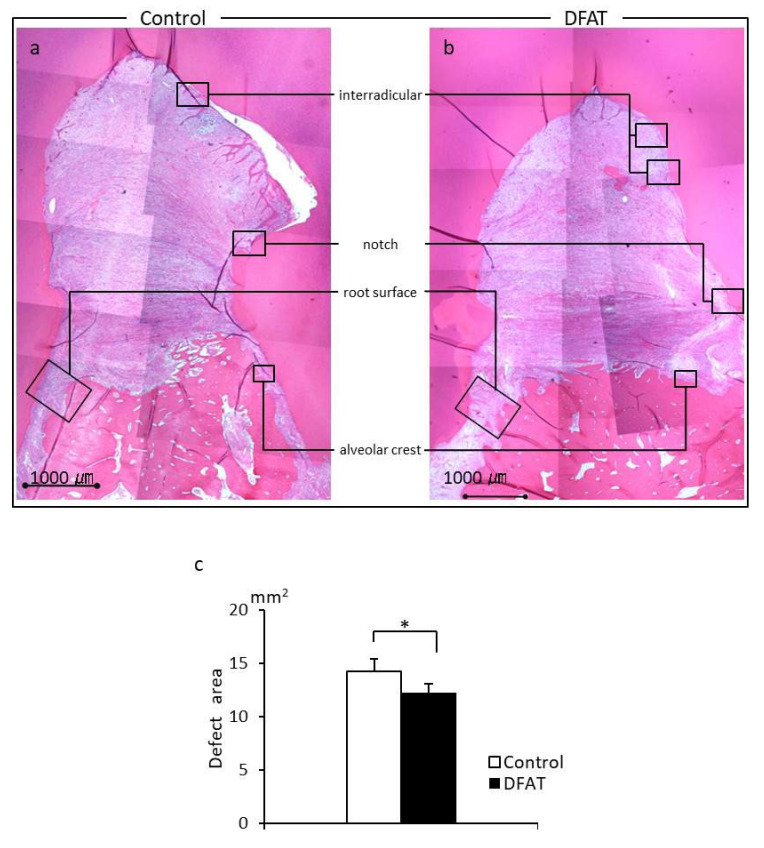
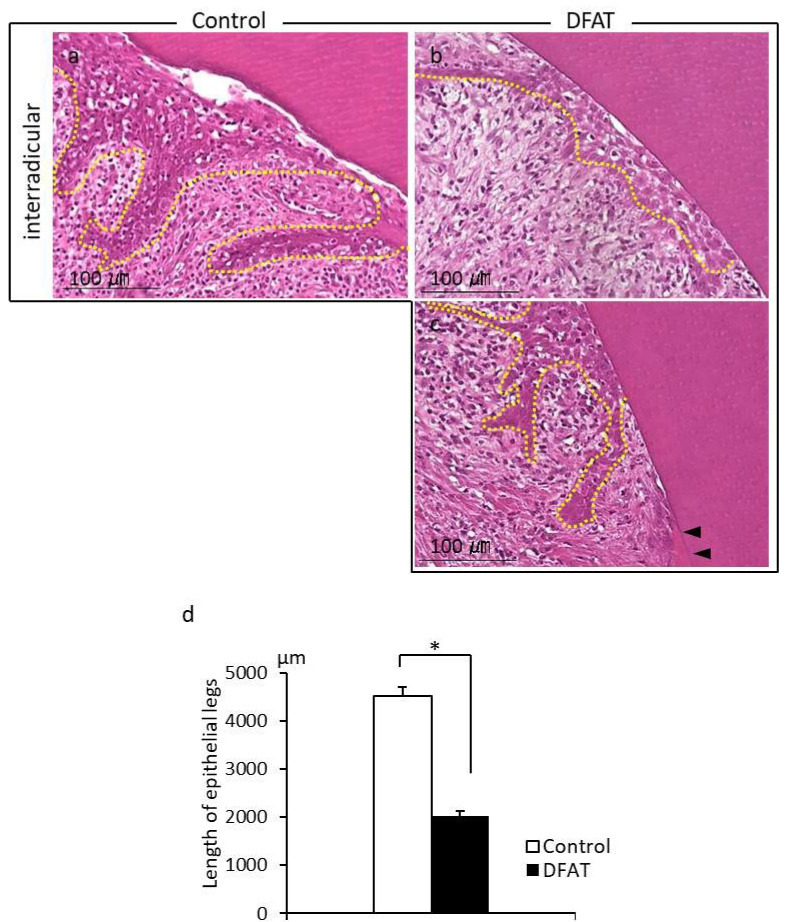
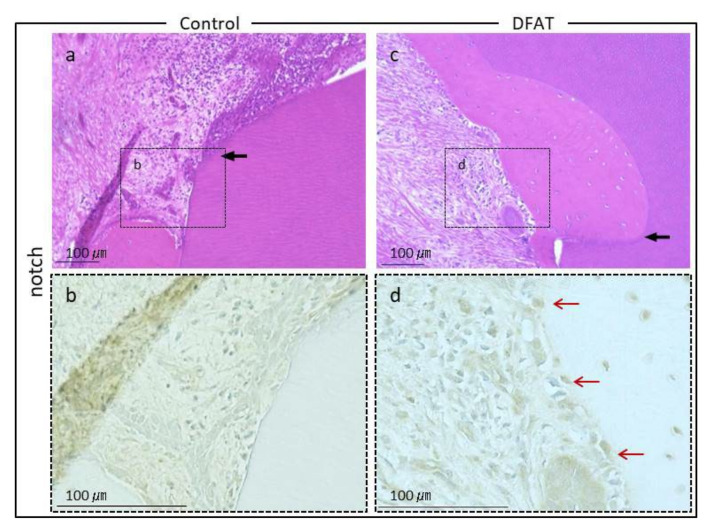
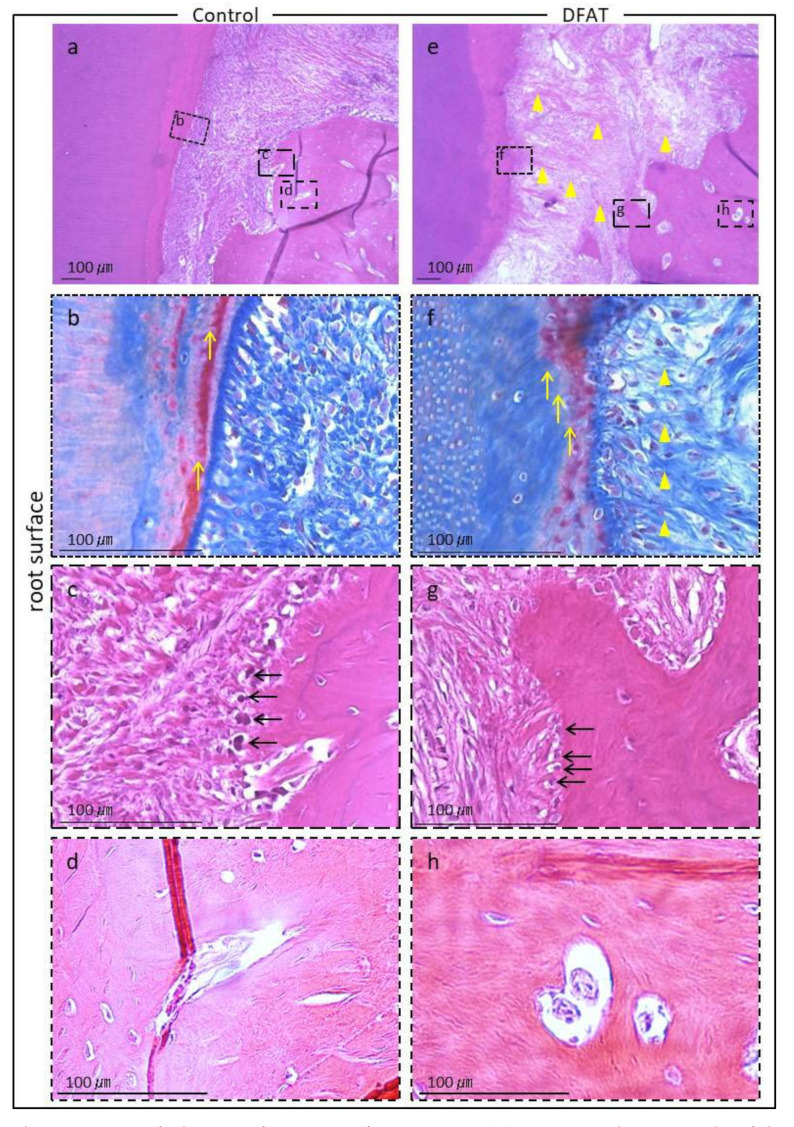
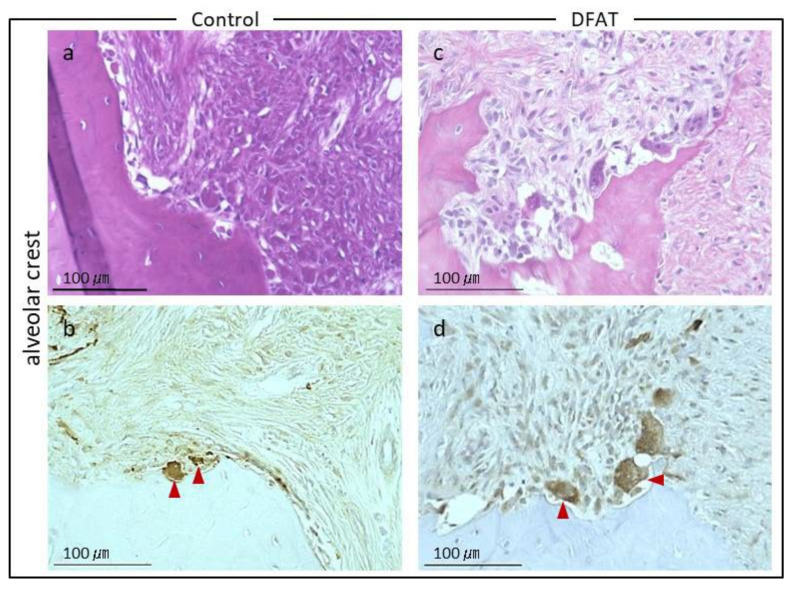
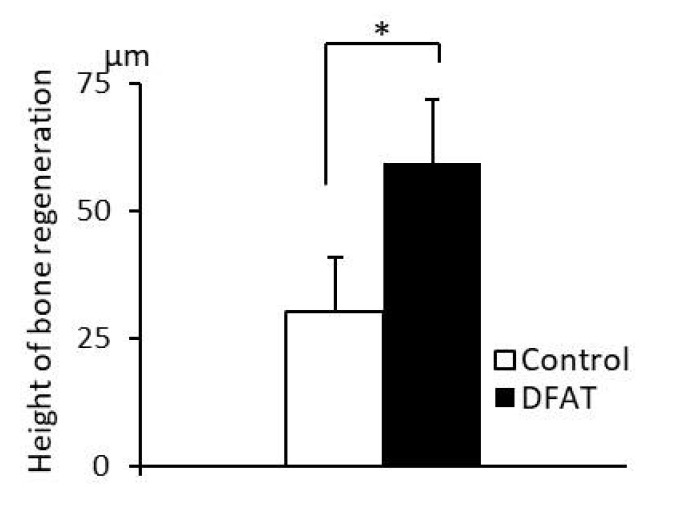
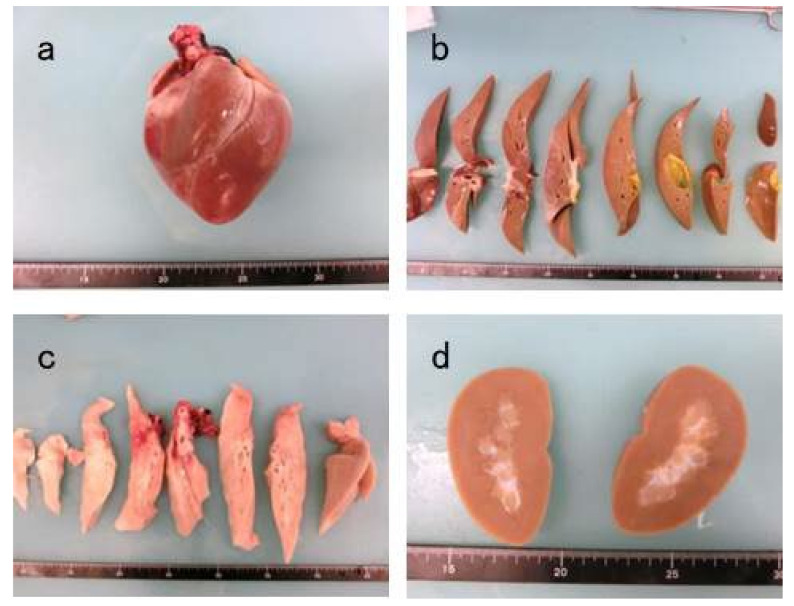
Adipose tissue is composed mostly of adipocytes that are in contact with capillaries. By using a ceiling culture method based on buoyancy, lipid-free fibroblast-like cells, also known as dedifferentiated fat (DFAT) cells, can be separated from mature adipocytes with a large single lipid droplet. DFAT cells can re-establish their active proliferation ability and transdifferentiate into various cell types under appropriate culture conditions. Herein, we sought to compare the regenerative potential of collagen matrix alone (control) with autologous DFAT cell-loaded collagen matrix transplantation in adult miniature pigs (microminipigs; MMPs). We established and transplanted DFAT cells into inflammation-inducing periodontal class II furcation defects. At 12 weeks after cell transplantation, a marked attachment gain was observed based on the clinical parameters of probing depth (PD) and clinical attachment level (CAL). Additionally, micro computed tomography (CT) revealed hard tissue formation in furcation defects of the second premolar. The cemento-enamel junction and alveolar bone crest distance was significantly shorter following transplantation. Moreover, newly formed cellular cementum, well-oriented periodontal ligament-like fibers, and alveolar bone formation were observed via histological analysis. No teratomas were found in the internal organs of recipient MMPs. Taken together, these findings suggest that DFAT cells can safely enhance periodontal tissue regeneration.

Keywords: dedifferentiated fat cells; periodontal furcation defect; periodontal tissue regeneration; transplantation.


Conflict of interest statement

The authors declare no conflict of interest. The funders had no role in the design of the study; in the collection, analyses, or interpretation of data; in the writing of the manuscript, or in the decision to publish the results.

Figures

Figure 1
Figure 1
Isolation and morphology of DFAT cells. (a) After digestion and centrifugation of small pieces of fat tissue, the isolated unicolor mature adipocytes adhered to the top inner surface of a culture flask and generated fibroblast-like cells. (b) Microscopic view of primary cultured DFAT cells harvested from MMPs during the ceiling culture divide asymmetrically and generate fibroblast-like cells.
Figure 2
Figure 2
The timetable of in vivo experimental procedures. Six MMPs with 12 teeth in total were included.
Figure 3
Figure 3
Creation of the periodontal furcation defect in the mandible of MMPs. (a) MMP at the Nihon University School of Medicine. (b) Small pieces of adipose tissue obtained from the hypogastrium. (c,d) Removal of the calculus in the supragingival region of mandible premolars using a curette. (e,f) The furcation defects (4 mm wide, 5 mm deep, and 3 mm horizontally) were created on the buccal side of the bilateral second premolars. (g) Filling the impression material into the created furcation defect to induce chronic inflammation. (h) Four weeks later, inflammation was observed at the buccal surface. Black arrow indicates gingival inflammation and bleeding from the buccal side of the bilateral second premolar. (i) After debridement, the furcation defect and the buccal bone of premolars exhibited destruction. (j) Twelve weeks later, the clinical parameters were once again measured before extracting the mandible.
Figure 4
Figure 4
Clinical parameters at the buccal surface of the mandibular second premolar at three different time points. (a) In the control group, a significant difference was observed in the central area of the second premolar between 0 and +12 weeks. In the DFAT group, significant differences were observed in the whole area of the second premolar between 0 and +12 weeks. In addition, a significant difference was observed in the central area between the control group and DFAT group at +12 weeks. (b) A significant difference was observed in the central area of the DFAT group between 0 and +12 weeks. Each bar represents the mean ± SD (n = 6, * p < 0.05). M, mesial; C, central; D, distal. (c) Results of mean values (±SD) in central region of DFAT group and control group between 0 and +12 weeks (mm).
Figure 5
Figure 5
Representative micro-CT images of the mandibular second premolar at +12 weeks. (a) The upper left panels show CT images of the control group reconstructed using i-VIEW. Alveolar bone with irregularities was observed on the buccal side of mandibular. The upper right panel shows the frontal plane section of the second premolar. Frontal plane images revealed that the height of the alveolar bone from the root apex to alveolar crest on the buccal side was lower than that on the lingual side. The frontal plane image of the furcation revealed that the buccal side of the alveolar bone formation was uneven. The lower left panel shows the sagittal plane section. The artificially created furcation defect and notch are clearly visible. The lower right panel shows the horizontal plane section of the mandible. Hard tissue formation was not observed on the buccal side of mesial and distal roots of the second premolar. (b) The lower left panel shows CT images of the DFAT group reconstructed using i-VIEW. Alveolar bone without the step was observed on the buccal side of mandibula. The lower right panel shows the frontal plane section of the second premolar. The lower left panel shows the sagittal plane section. The artificially created furcation defect and notch are clearly visible. The lower right panel shows the horizontal plane section of the mandible. Inarticulate hard tissue was observed on the buccal side of mesial and distal roots of the second premolar. Asterisks indicate magnification.
Figure 6
Figure 6
Quantification of the micro-CT analysis. (a) Comparison of the dimensions from the root apex to the alveolar crest in the alveolar bone between the lingual and buccal sides. The ratio of the dimension at mesial and distal roots in the DFAT group was greater than that in control group. (b) Dimension from the alveolar crest to the cemento-enamel junction. A significant difference was observed in the furcation between the control group and DFAT group. Each bar represents the mean ± SD (n = 6, * p < 0.05). M, mesial; F, furcation; D, distal.
Figure 7
Figure 7
Representative H&E-stained sagittal plane section from the furcation of the second premolar at +12 weeks. Furcation defects in the control group (a) and DFAT group (b) were easily identified in the central part of the image. (c) Quantification of the defect area. The defect area was smaller in the DFAT group that in the control group. Each bar represents the mean ± SD (n = 6, * p < 0.05).
Figure 8
Figure 8
High-magnification image of interradicular regions from Figure 7. (a) Control group; the dotted line indicates epithelial legs reaching the upper section of the furcation defect. (b) DFAT group; the dotted line indicates epithelial tissue in the upper section of the furcation defect. (c) The dotted line indicates epithelial legs above the hard tissue formation. Black arrowheads indicate newly formed cementum. (d) The length of epithelial legs was longer in the control group than in the DFAT group. Each bar represents the mean ± SD (n = 6, * p < 0.05).
Figure 9
Figure 9
Magnified notch regions of Figure 7. (a) In the control group, epithelial tissue was observed above the notch of the created defect (black arrow). (b) At higher magnification of the dotted frame in (a), immunocytochemistry revealed no cementoblasts in the created defect. (c) In DFAT group, defect sites and eosinophilic structures were observed within the created furcation defect (black arrow). (d) At higher magnification of dotted frame in (c), immunocytochemistry revealed periostin-positive cells in the newly formed cementum. Red arrows indicate the newly formed cementoblasts.
Figure 10
Figure 10
Magnified root surface regions from Figure 7. (a) H&E-stained micrographs of the cementum-ligament-alveolar bone complex from the control group. (b) At higher magnification of dotted frame in (a), azan-stained histological section of the dentin root surface exhibits cementum and periodontal ligament (in the central part of the image). Yellow arrows indicate Sharpey’s fiber. (c) At higher magnification of the dotted frame of alveolar bone surface in (a), osteoblasts lining the alveolar crest were identified. (d) At higher magnification of dotted frame in the alveolar crest in (a), the bone marrow-like organization, including blood vessel structures, was observed. (e) H&E-stained micrographs of the cementum-ligament-alveolar bone complex in the DFAT group. Yellow arrowheads indicate collagen bundles. (f) At higher magnification of the dotted frame in (e), azan-stained histologic sections harbor collagen bundles inserted perpendicular to the dental root surface. Yellow arrows indicate Sharpey’s fiber. Yellow arrowheads indicate collagen bundles. (g) At higher magnification of the dotted frame on alveolar bone surface in (e), osteoblasts lining the alveolar crest can be observed. (h) At higher magnification of the dotted frame in the alveolar crest in (e), the bone marrow-like organization, including blood vessel structure, can be observed.
Figure 11
Figure 11
High-magnification image of alveolar crest regions from Figure 7. (a) H&E-stained micrographs from the control group. (b) Immunocytochemistry photomicrographs. Red arrows indicate cathepsin K-positive osteoclasts in the control group. (c) H&E-stained micrographs in the DFAT group. (d) Immunocytochemistry photomicrographs. Red arrowheads indicate cathepsin K-positive osteoclasts lining the newly formed alveolar crest in the DFAT group.
Figure 12
Figure 12
Histometric analysis of newly formed alveolar bone in the furcation of the second premolar at +12 weeks. The height from the top of the newly formed alveolar crest to notch-shaped marks in the DFAT group was higher than that in the control group. Each bar indicates the mean ± SD (n = 6, * p < 0.05).
Figure 13
Figure 13
Representative observation of internal organs at + 12 weeks. (a) heart. (b) liver. (c) pancreas. (d) kidney.

Similar articles

Cited by

References

    1. Kinane D.F., Marshall G.J. Periodontal Manifestations of Systemic Disease. Aust. Dent. J. 2001;46:2–12. doi: 10.1111/j.1834-7819.2001.tb00267.x. - DOI - PubMed
    1. Moutsopoulos N.M., Madianos P.N. Low-Grade Inflammation in Chronic Infectious Diseases: Paradigm of Periodontal Infections. Ann. N. Y. Acad. Sci. 2006;1088:251–264. doi: 10.1196/annals.1366.032. - DOI - PubMed
    1. Guan J., Zhang D., Wang C. Identifying periodontitis risk factors through a retrospective analysis of 80 cases. Pak. J. Med. Sci. 2022;38:293–296. doi: 10.12669/pjms.38.1.5205. - DOI - PMC - PubMed
    1. Taba M., Jr., Jin Q., Sugai J.V., Giannobile W.V. Current Concepts in Periodontal Bioengineering. Orthod. Craniofac. Res. 2005;8:292–302. doi: 10.1111/j.1601-6343.2005.00352.x. - DOI - PMC - PubMed
    1. Rios H.F., Lin Z., Oh B., Park C.H., Giannobile W.V. Cell- and Gene-Based Therapeutic Strategies for Periodontal Regenerative Medicine. J. Periodontol. 2011;82:1223–1237. doi: 10.1902/jop.2011.100710. - DOI - PMC - PubMed

LinkOut - more resources