

Effect of Crumb Rubber, Fly Ash, and Nanosilica on the Properties of Self-Compacting Concrete Using Response Surface Methodology
- PMID: 35208049
- PMCID: PMC8877931
- DOI: 10.3390/ma15041501
Effect of Crumb Rubber, Fly Ash, and Nanosilica on the Properties of Self-Compacting Concrete Using Response Surface Methodology
Abstract
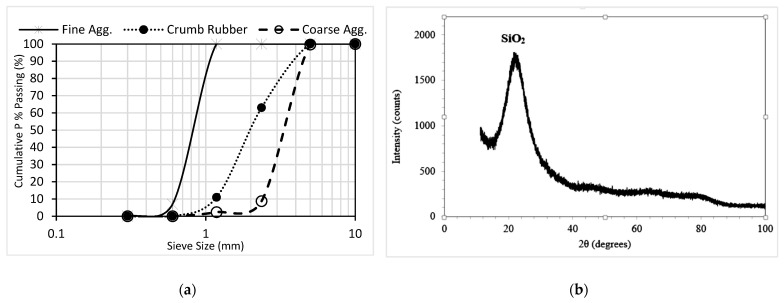
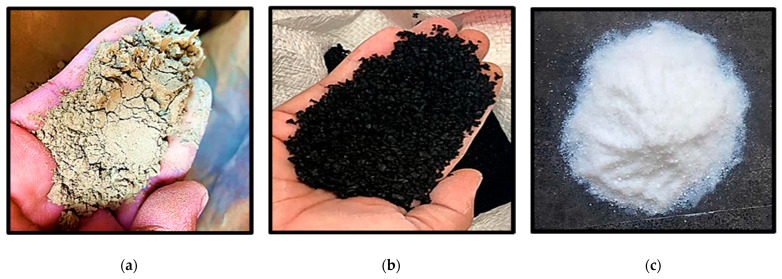
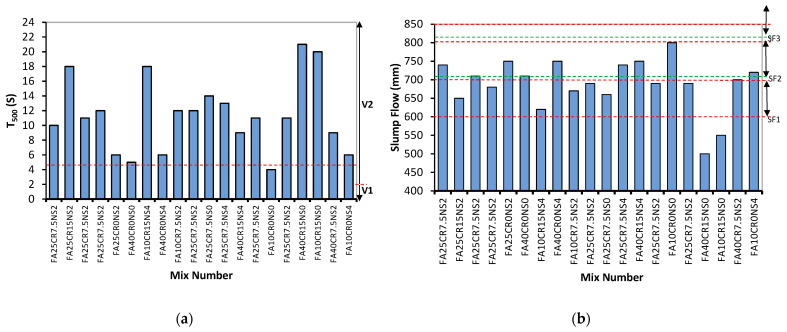
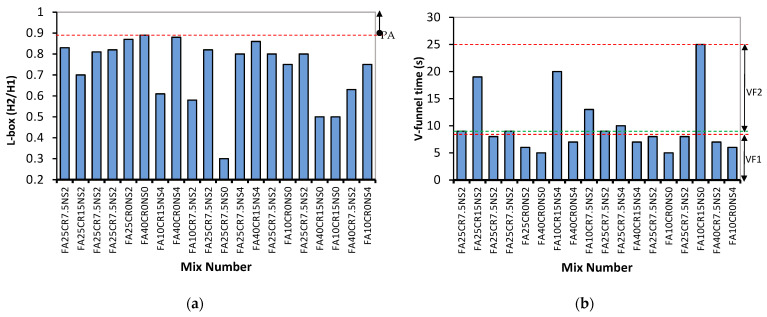
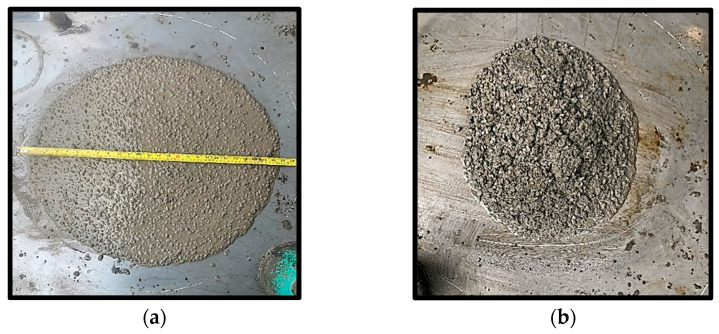
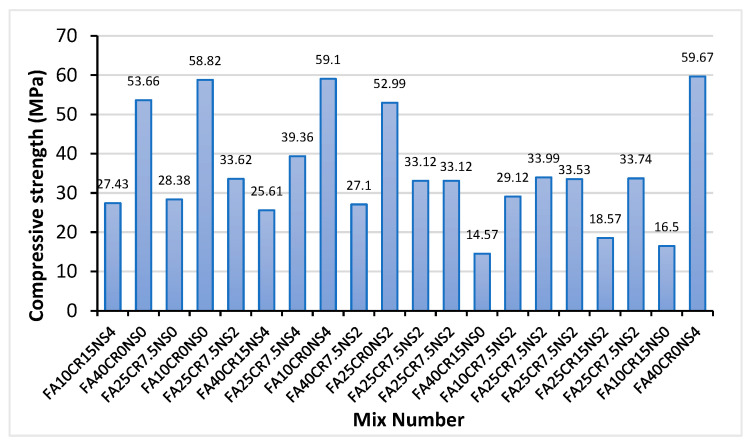
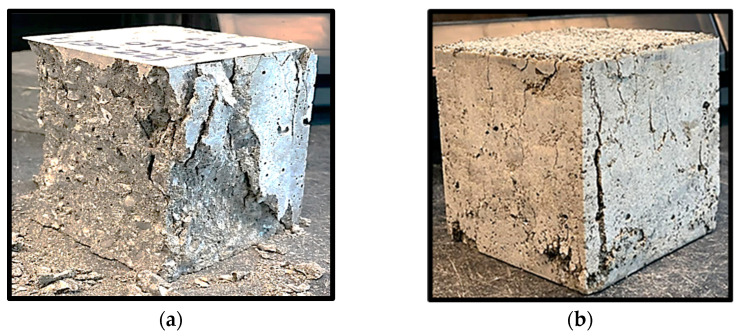
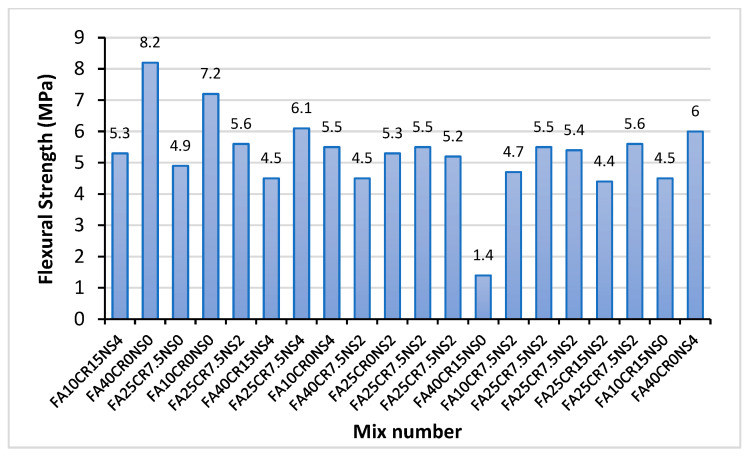
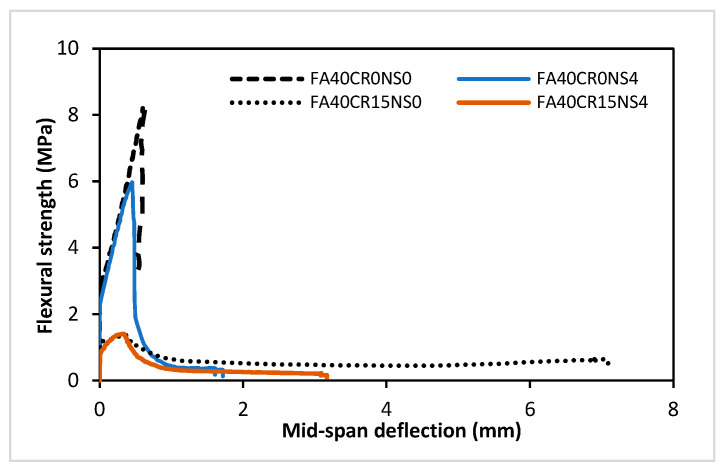
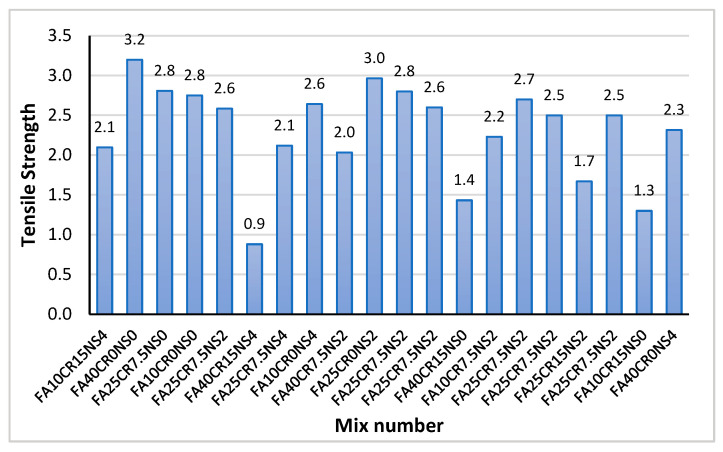
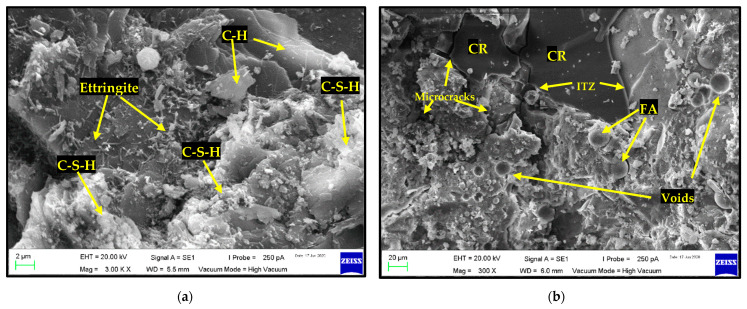
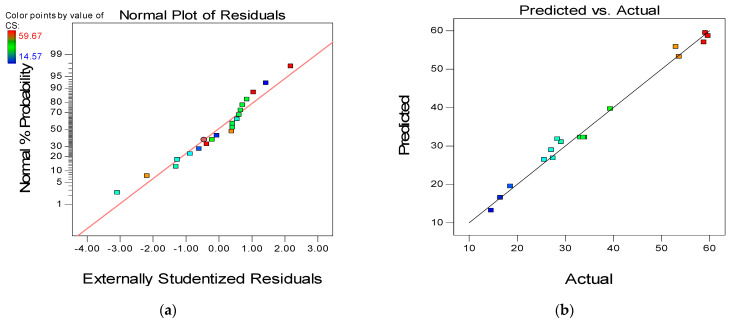
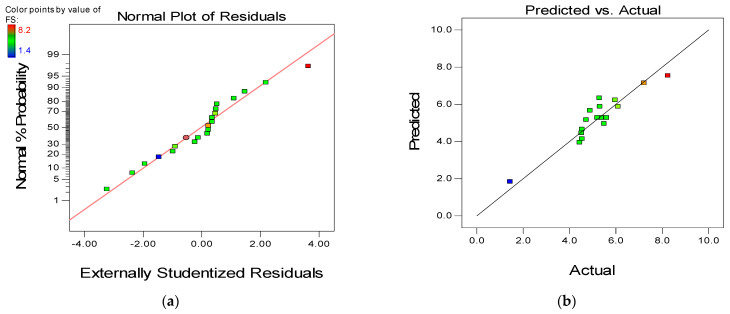
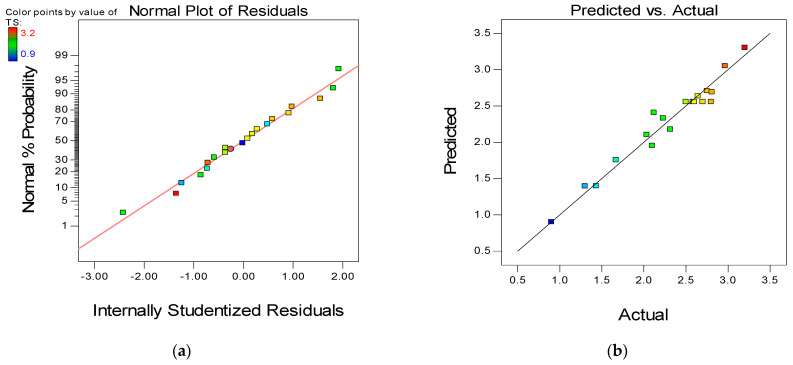
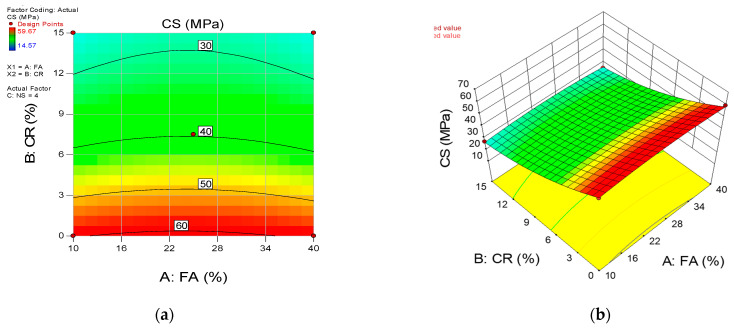
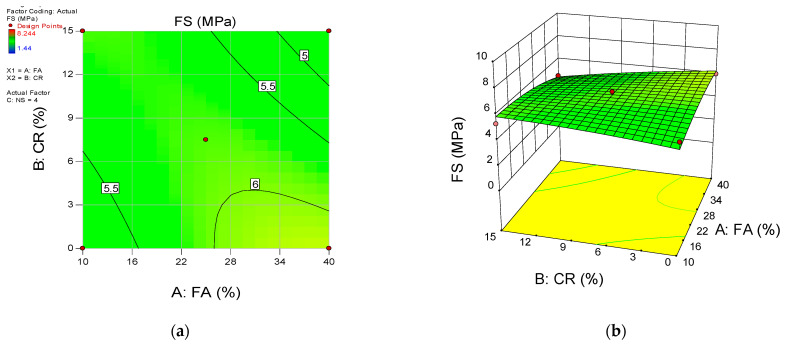
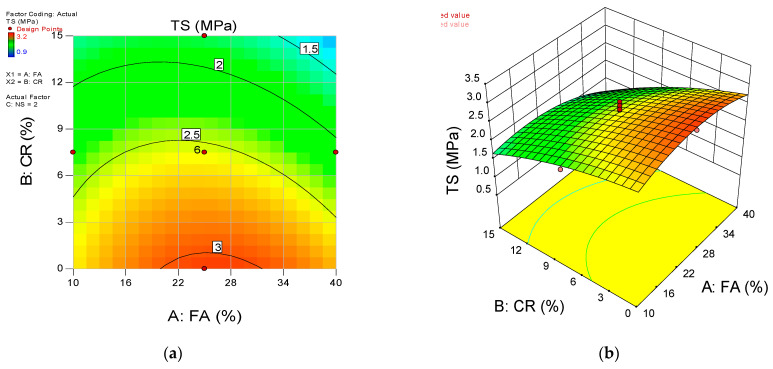
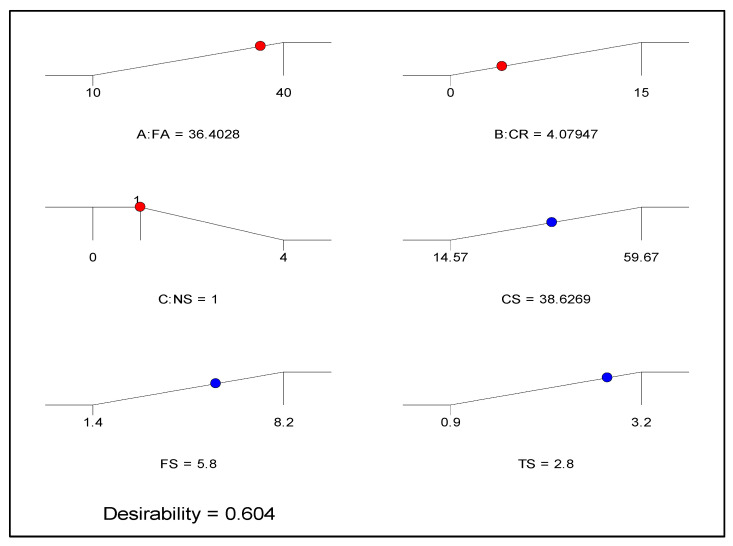
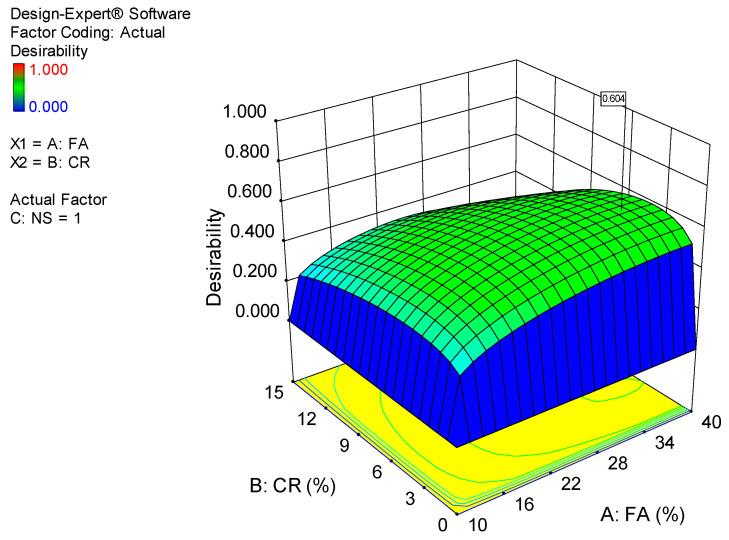
Producing high-strength self-compacting concrete (SCC) requires a low water-cement ratio (W/C). Hence, using a superplasticizer is necessary to attain the desired self-compacting properties at a fresh state. The use of low W/C results in very brittle concrete with a low deformation capacity. This research aims to investigate the influence of crumb rubber (CR), fly ash (FA), and nanosilica (NS) on SCC's workability and mechanical properties. Using response surface methodology (RSM), 20 mixes were developed containing different levels and proportions of FA (10-40% replacement of cement), CR (5-15% replacement of fine aggregate), and NS (0-4% addition) as the input variables. The workability was assessed through the slump flow, T500, L-box, and V-funnel tests following the guidelines of EFNARC 2005. The compressive, flexural, and tensile strengths were determined at 28 days and considered as the responses for the response surface methodology (RSM) analyses. The results revealed that the workability properties were increased with an increase in FA but decreased with CR replacement and the addition of NS. The pore-refining effect and pozzolanic reactivity of the FA and NS increased the strengths of the composite. Conversely, the strength is negatively affected by an increase in CR, however ductility and deformation capacity were significantly enhanced. Response surface models of the mechanical strengths were developed and validated using ANOVA and have high R2 values of 86-99%. The optimization result produced 36.38%, 4.08%, and 1.0% for the optimum FA, CR, and NS replacement levels at a desirability value of 60%.
Keywords: crumb rubber (CR); nanosilica (NS); response surface methodology (RSM); self-compacting concrete (SCC).
Conflict of interest statement
The authors declare that there is no conflict of interest.
Figures
Similar articles
-
Effects of Graphene Oxide and Crumb Rubber on the Fresh Properties of Self-Compacting Engineered Cementitious Composite Using Response Surface Methodology.Materials (Basel). 2022 Mar 29;15(7):2519. doi: 10.3390/ma15072519. Materials (Basel). 2022. PMID: 35407853 Free PMC article.
-
Utilization of Crumb Rubber and High-Volume Fly Ash in Concrete for Environmental Sustainability: RSM-Based Modeling and Optimization.Materials (Basel). 2021 Jun 16;14(12):3322. doi: 10.3390/ma14123322. Materials (Basel). 2021. PMID: 34208431 Free PMC article.
-
Durability Performance of Self-Compacting Concrete Containing Crumb Rubber, Fly Ash and Calcium Carbide Waste.Materials (Basel). 2022 Jan 9;15(2):488. doi: 10.3390/ma15020488. Materials (Basel). 2022. PMID: 35057206 Free PMC article.
-
Impact of Design Parameters on the Ratio of Compressive to Split Tensile Strength of Self-Compacting Concrete with Recycled Aggregate.Materials (Basel). 2021 Jun 22;14(13):3480. doi: 10.3390/ma14133480. Materials (Basel). 2021. PMID: 34206646 Free PMC article. Review.
-
Influence of Design Parameters on Fresh Properties of Self-Compacting Concrete with Recycled Aggregate-A Review.Materials (Basel). 2020 Dec 16;13(24):5749. doi: 10.3390/ma13245749. Materials (Basel). 2020. PMID: 33339318 Free PMC article. Review.
Cited by
-
Development of High-Tech Self-Compacting Concrete Mixtures Based on Nano-Modifiers of Various Types.Materials (Basel). 2022 Apr 8;15(8):2739. doi: 10.3390/ma15082739. Materials (Basel). 2022. PMID: 35454432 Free PMC article.
-
Effects of Graphene Oxide and Crumb Rubber on the Fresh Properties of Self-Compacting Engineered Cementitious Composite Using Response Surface Methodology.Materials (Basel). 2022 Mar 29;15(7):2519. doi: 10.3390/ma15072519. Materials (Basel). 2022. PMID: 35407853 Free PMC article.
-
A Study on the Cement Gel Formation Process during the Creation of Nanomodified High-Performance Concrete Based on Nanosilica.Gels. 2022 Jun 2;8(6):346. doi: 10.3390/gels8060346. Gels. 2022. PMID: 35735690 Free PMC article.
-
Feasibility Study of Reclaimed Asphalt Pavements (RAP) as Recycled Aggregates Used in Rigid Pavement Construction.Materials (Basel). 2023 Feb 10;16(4):1504. doi: 10.3390/ma16041504. Materials (Basel). 2023. PMID: 36837135 Free PMC article.
References
-
- Concrete Terminology—An ACI Standard. ACI; Farmington Hills, MI, USA: 2017.
-
- Alaloul W.S., Musarat M.A., Haruna S., Law K., Tayeh B.A., Rafiq W., Ayub S. Mechanical Properties of Silica Fume Modified High-Volume Fly Ash Rubberized Self-Compacting Concrete. Sustainbility. 2021;13:5571. doi: 10.3390/su13105571. - DOI
-
- Wanasinghe D., Aslani F., Dai K. Effect of age and waste crumb rubber aggregate proportions on flexural characteristics of self-compacting rubberized concrete. Struct. Conc. 2021:1–20. doi: 10.1002/suco.202000597. - DOI
-
- Bignozzi M.C., Sandrolini F. Tyre rubber waste recycling in self-compacting concrete. Cem. Conc. Res. 2006;36:735–739. doi: 10.1016/j.cemconres.2005.12.011. - DOI
Grants and funding
LinkOut - more resources
Full Text Sources
Research Materials
Miscellaneous
