. 2022 Jan 30;12(2):130.
doi: 10.3390/metabo12020130.

A Potential Role for Bile Acid Signaling in Celiac Disease-Associated Fatty Liver

Affiliations

A Potential Role for Bile Acid Signaling in Celiac Disease-Associated Fatty Liver

Paul Manka et al. Metabolites. .

Abstract

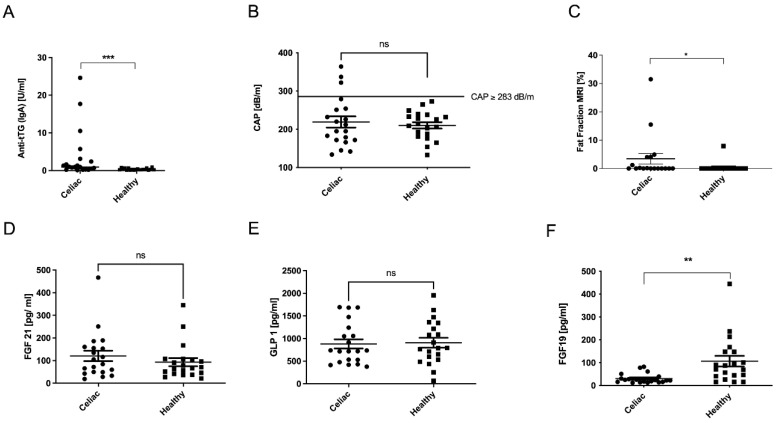
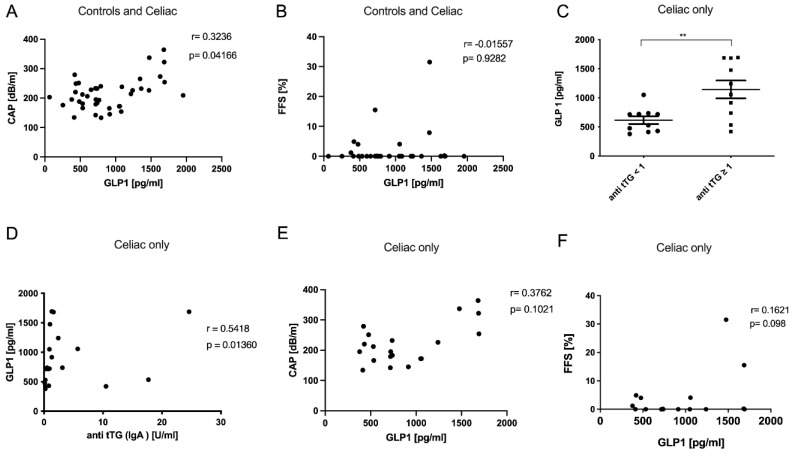
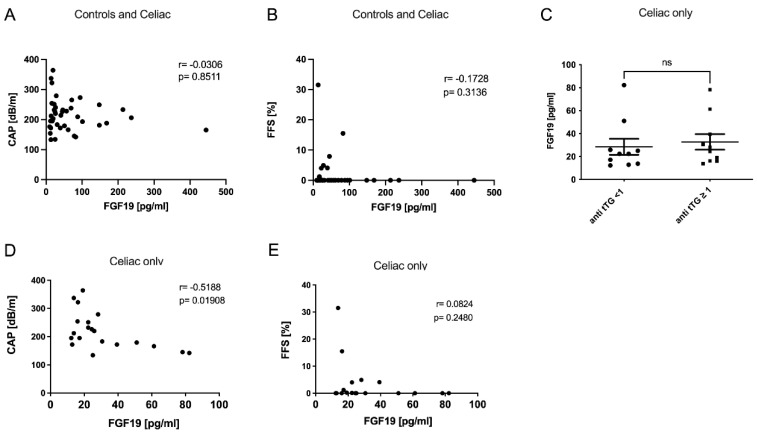
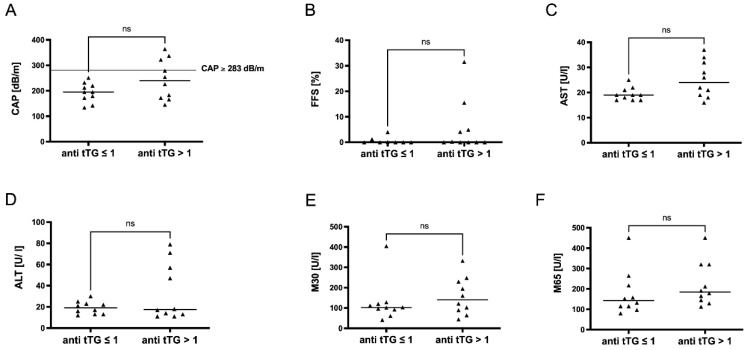
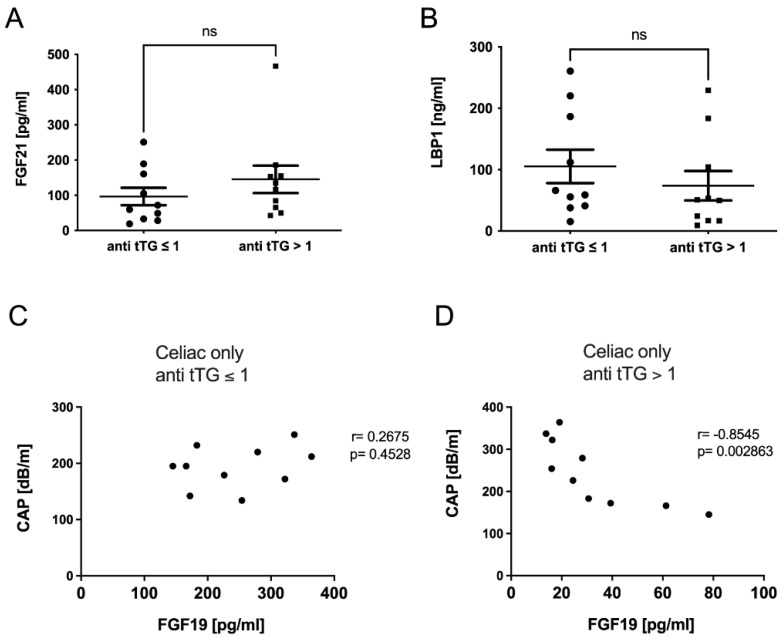
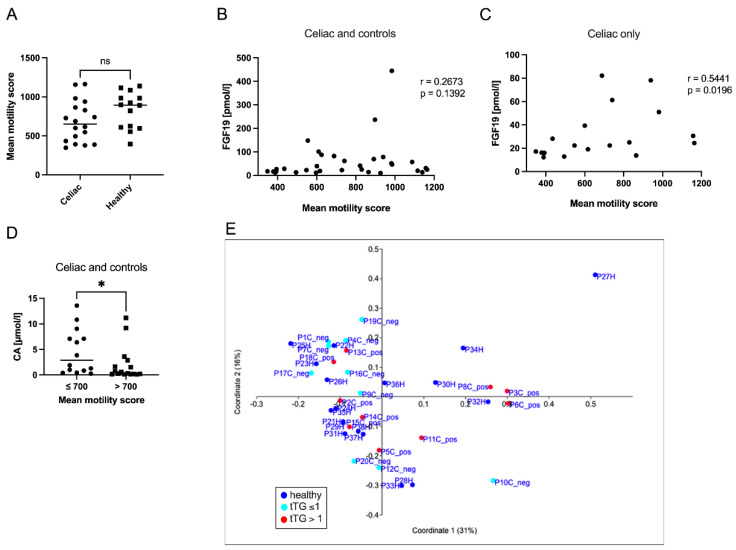
Celiac disease (CeD) is a chronic autoimmune disorder characterized by an intolerance to storage proteins of many grains. CeD is frequently associated with liver damage and steatosis. Bile acid (BA) signaling has been identified as an important mediator in gut-liver interaction and the pathogenesis of non-alcoholic fatty liver disease (NAFLD). Here, we aimed to analyze BA signaling and liver injury in CeD patients. Therefore, we analyzed data of 20 CeD patients on a gluten-free diet compared to 20 healthy controls (HC). We furthermore analyzed transaminase levels, markers of cell death, BA, and fatty acid metabolism. Hepatic steatosis was determined via transient elastography, by MRI and non-invasive scores. In CeD, we observed an increase of the apoptosis marker M30 and more hepatic steatosis as compared to HC. Fibroblast growth factor 19 (FGF19) was repressed in CeD, while low levels were associated with steatosis, especially in patients with high levels of anti-tissue transglutaminase antibodies (anti-tTG). When comparing anti-tTG-positive CeD patients to individuals without detectable anti-tTG levels, hepatic steatosis was accentuated. CeD patients with significant sonographic steatosis (defined by CAP ≥ 283 db/m) were exclusively anti-tTG-positive. In summary, our results suggest that even in CeD patients in clinical remission under gluten-free diet, alterations in gut-liver axis, especially BA signaling, might contribute to steatotic liver injury and should be further addressed in future studies and clinical practice.

Keywords: FGF19; bile acids; celiac disease; hepatic steatosis; non-alcoholic fatty liver disease (NAFLD).


Conflict of interest statement

All authors declare that they do not have a conflict of interests.

Figures

Figure 1
Figure 1
A trend toward hepatic steatosis in patients with CeD. Despite gluten-free diets, celiac patients had elevated levels of anti-tissue transglutaminase antibodies (anti-tTG) (A). In the celiac group, patients showed higher CAP levels than controls, and in addition, there were more individuals in the celiac group who had CAP levels significantly above the threshold of 283 dB/m (B). Celiac patients also had a higher fat content in the liver measurable by MRI (C). Serum concentrations of the incretins FGF21 (D) and GLP1 (E) did not differ significantly between groups, and FGF19 serum levels were decreased in CeD patients (F). * p < 0.05, ** p < 0.01, *** p < 0.001; ns stands for not significant.
Figure 2
Figure 2
GLP1 serum levels were associated with increased hepatic steatosis. The degree of steatosis as assessed by CAP (A) was associated with GLP1 in the entire study cohort, while this could not be confirmed by MRI (B). Celiac disease patients with increased anti-tTG antibodies had higher GLP1 serum concentrations (C), and these parameters also showed a positive correlation (D). Looking at the association of GLP1 with steatosis only in the celiac patients, we found the same trend by both CAP (E) and MRI measurements (F). ** p < 0.01.
Figure 3
Figure 3
FGF19 serum levels of CeD patients were associated with increased hepatic steatosis. Neither CAP (A) nor fat fraction as assessed by MRI (B) was significantly associated with FGF19 levels in the entire cohort. Comparing FGF19 serum levels in celiac patients with different anti-tTG antibodies levels, we found that no differences between the groups were detected (C). However, when comparing the association of FGF19 with steatosis in the celiac patients only, CAP showed a significant correlation with FGF19 (D). Correlation of FGF19 with MRI measurement was not significant (E). ns stands for not significant.
Figure 4
Figure 4
A subgroup analysis showed trended differences in steatotic liver injury depending on disease activity. In a subgroup cohort analysis comparing celiac patients with anti-tTG levels ≤ 1 and those with anti-tTG levels > 1, we could show that those patients with anti-tTG > 1 showed a trend towards increased steatosis as assessed by CAP (A) and MRI-FFS (B). Those individuals with anti-tTG levels > 1 showed a tendency of increased transaminase levels of AST (C) and ALT (D) as well as of hepatocellular apoptosis marker M30 (E) and overall cell death marker M65 (F). ns stands for not significant.
Figure 5
Figure 5
FGF19 serum levels in celiac disease were associated with disease activity. The incretins FGF21 (A) and LBP1 (B) did not differ between patients with anti-tTG ≤ 1 and anti-tTG > 1. FGF19 levels in CeD patients with antitTG ≤ 1 showed no significant correlation with CAP (C), but an invert association with steatosis as assessed by CAP was seen for CeD patients with antitTG > 1 (D). ns stands for not significant.
Figure 6
Figure 6
Intestinal motility correlated with FGF19 in celiac disease. Intestinal motility was measured by MRI and showed a tendency of lower motility in celiac patients (A). FGF19 showed a positive trend without statistical significance when correlated with intestinal motility in the whole cohort (B). When analyzing the celiac patients only, we found that FGF19 and measurement of intestinal motility correlated significantly (C). Levels of the primary bile acids CA (D) were compared in the whole cohort, comparing those individuals with a slower (≤700 mean motility score) versus patients with a faster gut motility (>700 mean motility score). Microbiome analysis based on 16sDNA sequencing of fecal samples showed no clear delineation of specific groupings when comparing control, anti-tTG-positive (anti-tTG > 1), and anti-tTG-negative (anti-tTG < 1) individuals (E). * p < 0.05, ns stands for not significant.

References

    1. Gujral N., Freeman H.J., Thomson A.B.R. Celiac Disease: Prevalence, Diagnosis, Pathogenesis and Treatment. World J. Gastroenterol. 2012;18:6036–6059. doi: 10.3748/wjg.v18.i42.6036. - DOI - PMC - PubMed
    1. Viljamaa M., Kaukinen K., Huhtala H., Kyrönpalo S., Rasmussen M., Collin P. Coeliac Disease, Autoimmune Diseases and Gluten Exposure. Scand. J. Gastroenterol. 2005;40:437–443. doi: 10.1080/00365520510012181. - DOI - PubMed
    1. Rubio-Tapia A., Murray J.A. Liver Involvement in Celiac Disease. Minerva Med. 2008;99:595–604. - PMC - PubMed
    1. Kälsch J., Bechmann L.P., Manka P., Kahraman A., Schlattjan M., Marth T., Rehbehn K., Baba H.A., Canbay A. Non-Alcoholic Steatohepatitis Occurs in Celiac Disease and Is Associated with Cellular Stress. Z. Gastroenterol. 2013;51:26–31. doi: 10.1055/s-0032-1330421. - DOI - PubMed
    1. Anania C., De Luca E., De Castro G., Chiesa C., Pacifico L. Liver Involvement in Pediatric Celiac Disease. World J. Gastroenterol. 2015;21:5813–5822. doi: 10.3748/wjg.v21.i19.5813. - DOI - PMC - PubMed

LinkOut - more resources