Review
. 2022 Jan 21;58(2):165.
doi: 10.3390/medicina58020165.

Diagnosis and Treatment of Primary Inflammatory Choriocapillaropathies (PICCPs): A Comprehensive Overview

Affiliations
Review

Diagnosis and Treatment of Primary Inflammatory Choriocapillaropathies (PICCPs): A Comprehensive Overview

Ioannis Papasavvas et al. Medicina (Kaunas). .

Abstract

Purpose: Primary inflammatory choriocapillaropathies (PICCPs) belong to a group of intraocular inflammatory diseases with the common characteristic of inflammatory choriocapillaris hypo- or non-perfusion as the main clinicopathological mechanism. The purpose of our article is to describe clinical characteristics and multimodal imaging, that can help the diagnosis and treatment of PICCPs.

Methods: Narrative review with multimodal imaging analysis.

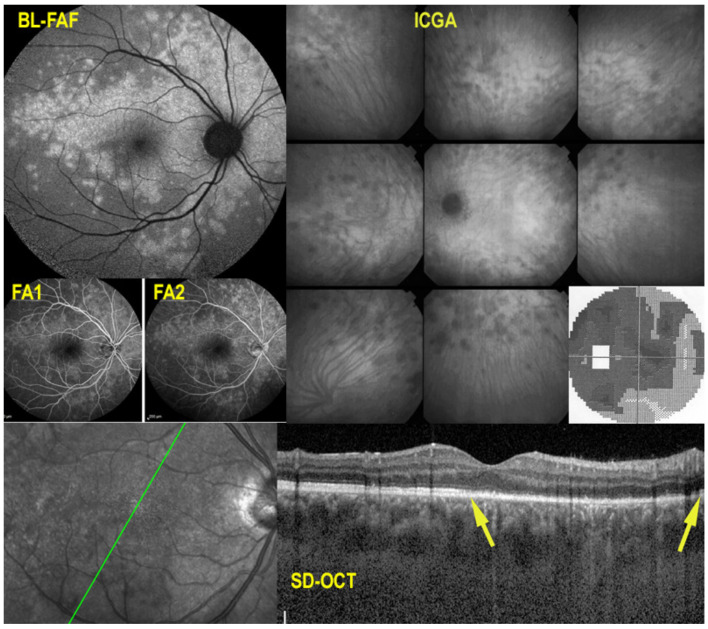
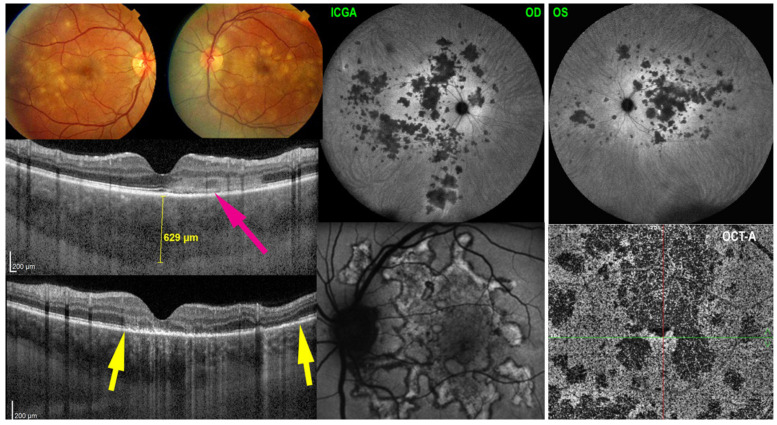
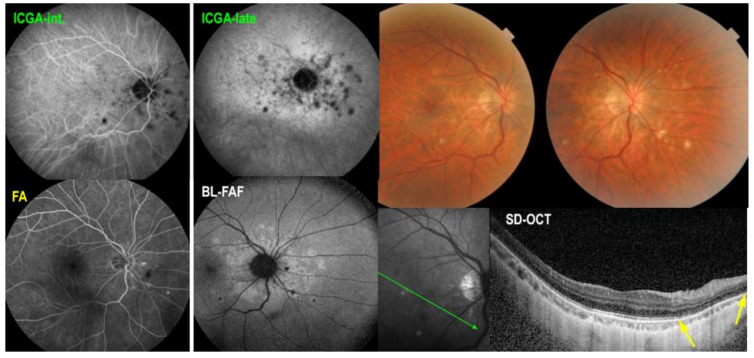
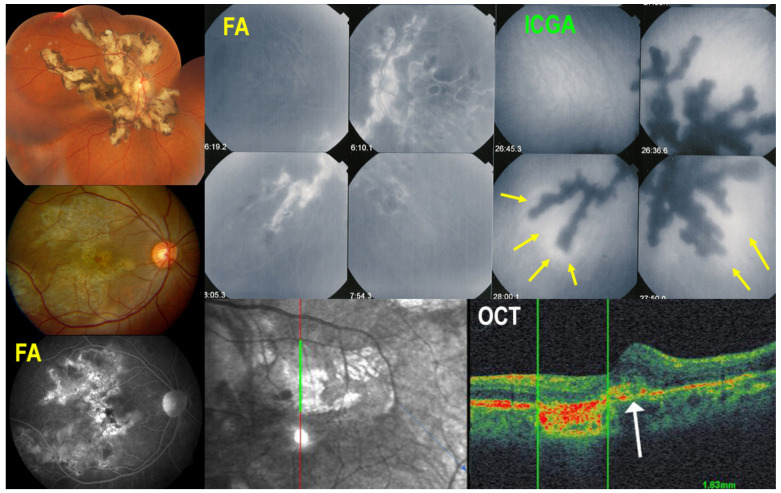
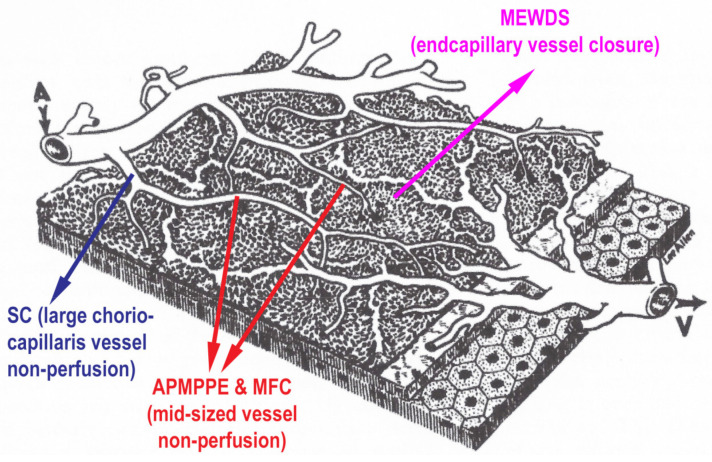
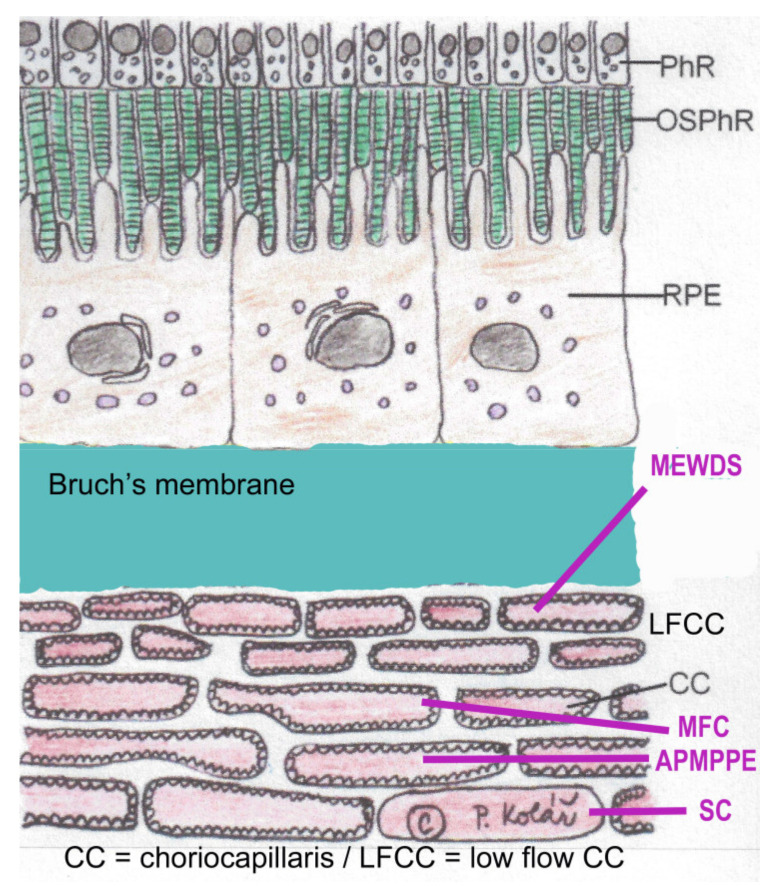
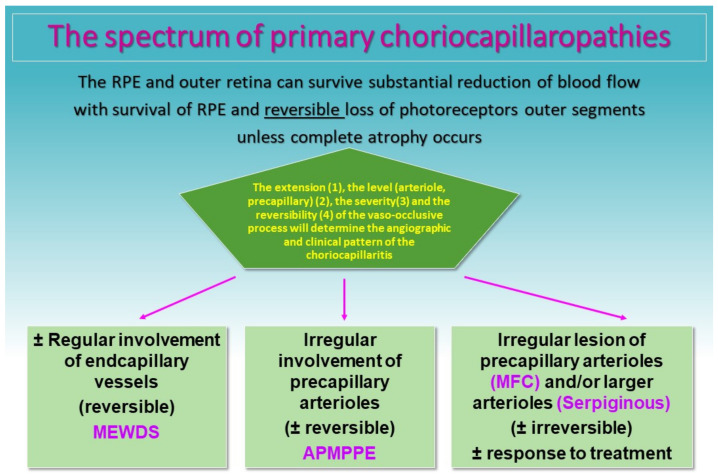
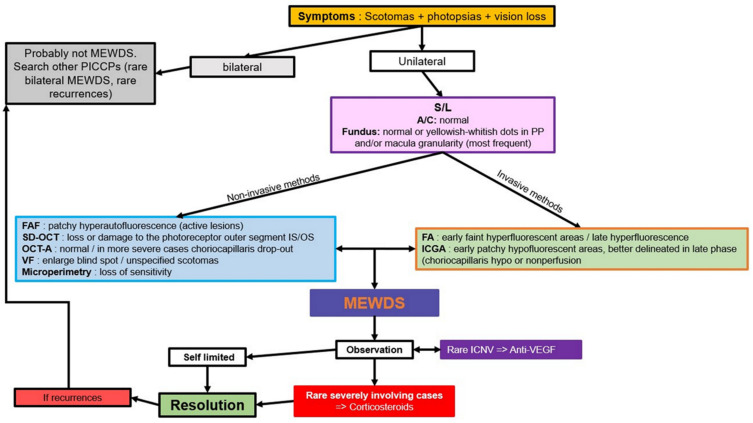
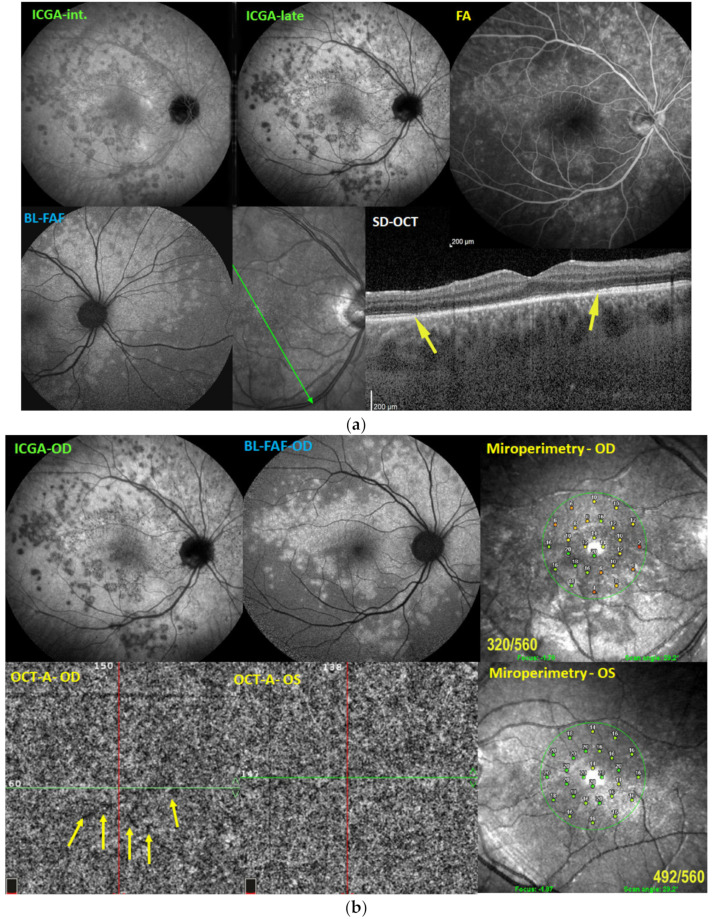
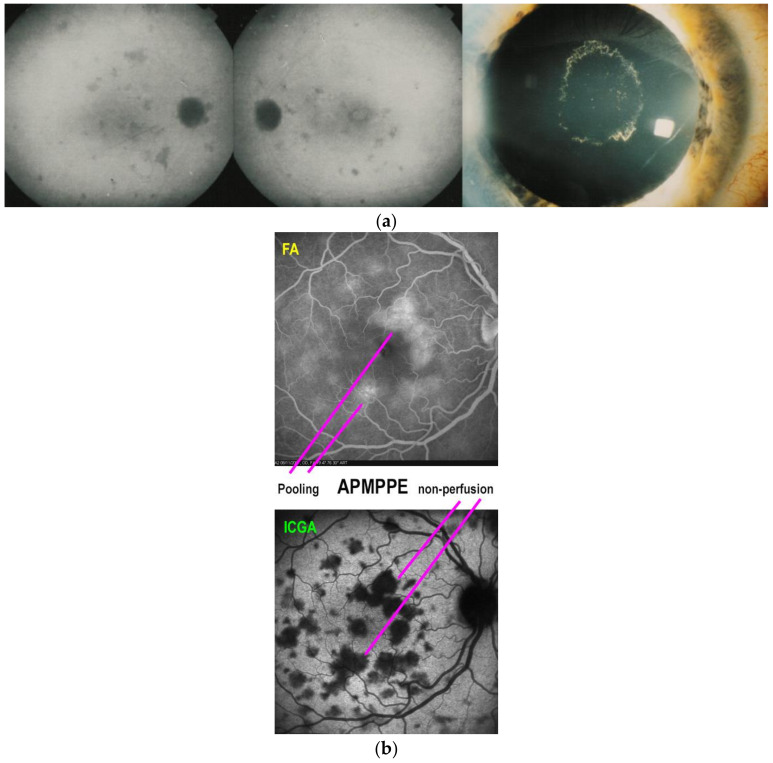
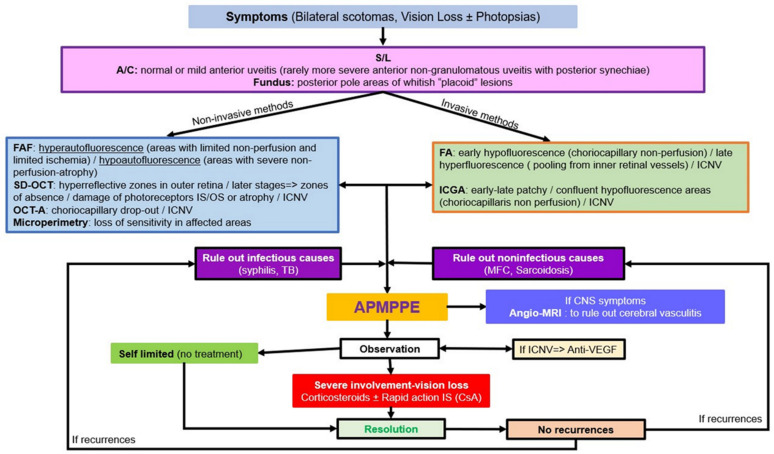
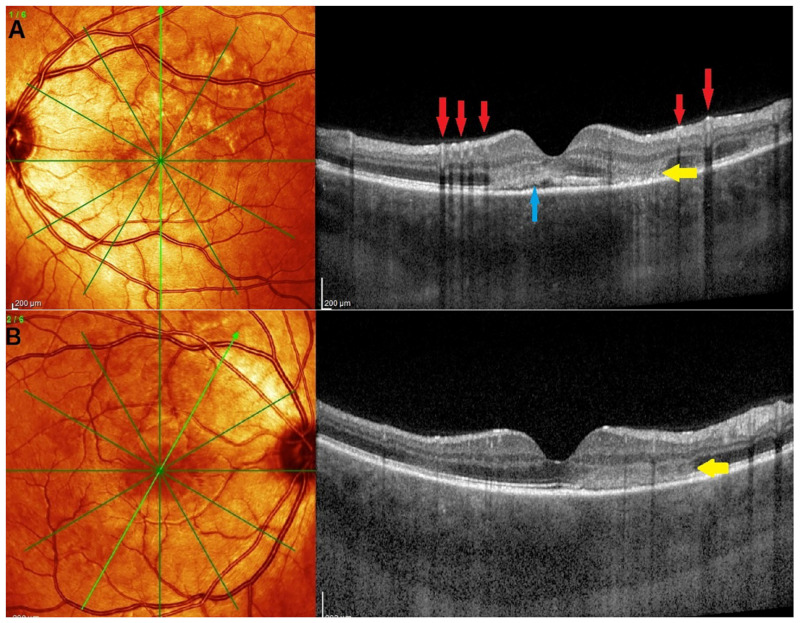
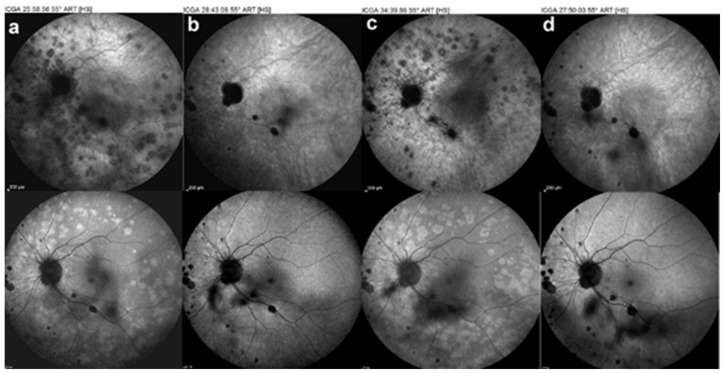
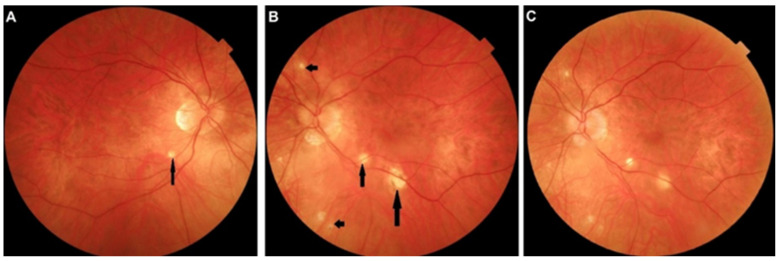
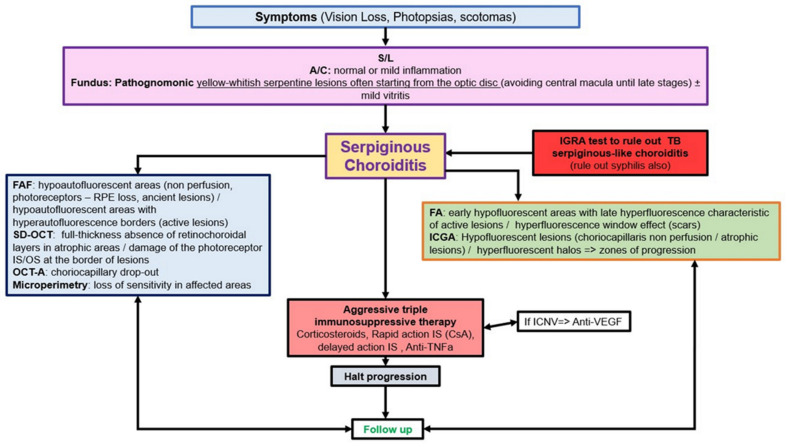
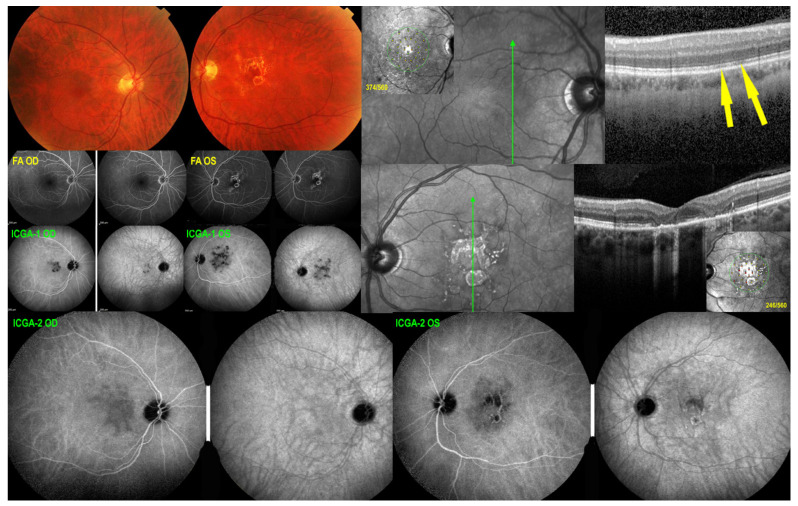
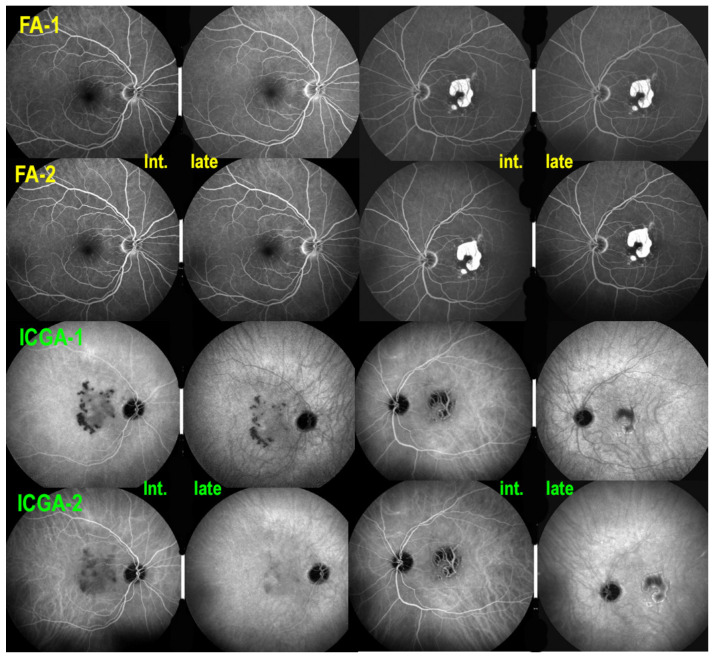
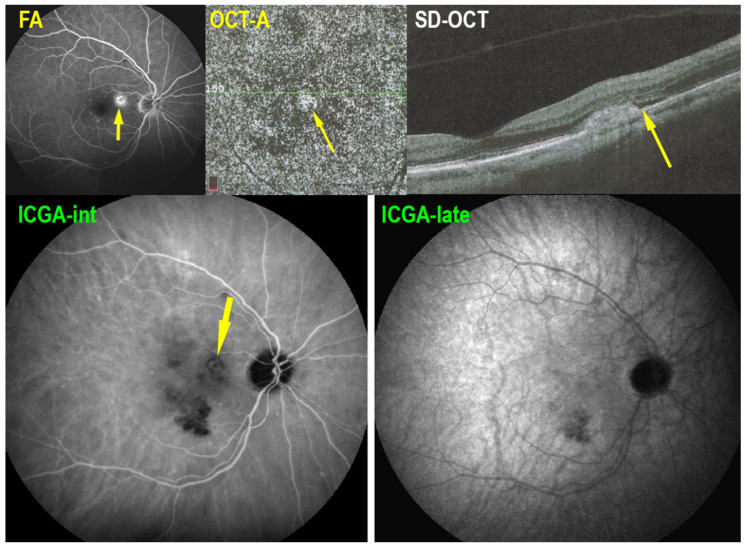
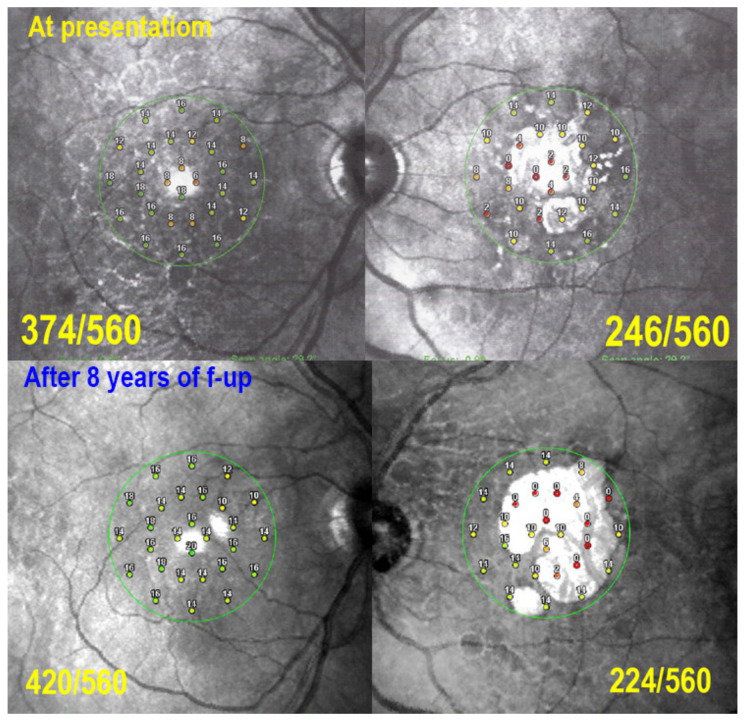
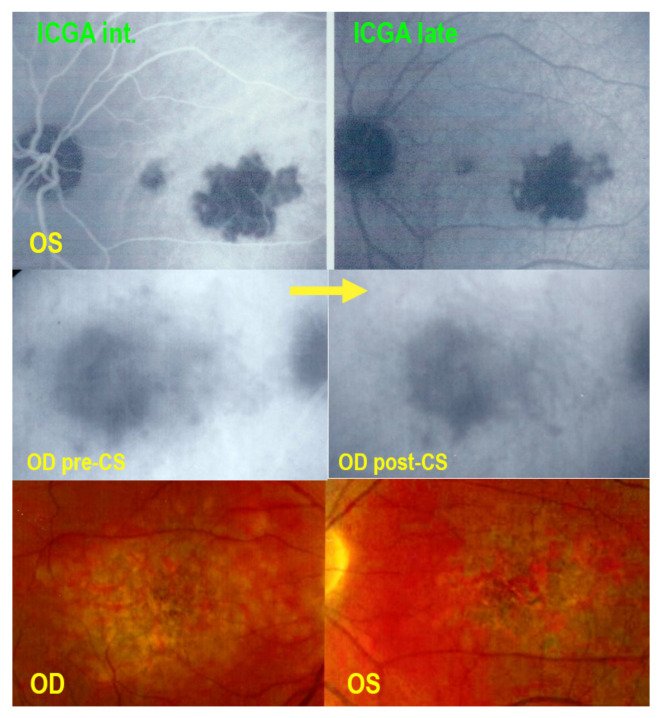
Results: Choriocapillaris non-perfusion can affect the end-choriocappilaries, at the benign end of the PICCP spectrum (MEWDS), to larger choriocapillaris vessels or precapillary vessels at the origin of more severe forms such as acute posterior multifocal placoid pigment epitheliopathy (APMPPE), idiopathic multifocal choroiditis (MFC) and Serpiginous Choroiditis (SC). Diagnosis is mostly based on multimodal imaging and especially on indocyanine green angiography (ICGA), fundus autofluorescence (FAF) and spectral-domain optical coherence tomography (SD-OCT)/OCT-angiography (OCT-A). ICGA shows the typical pattern of patchy lobular hypofluorescence reflecting hypo- or non-perfusion of the choriocapillaris that can also take the aspect of geographic areas in the more severe forms. Treatment depends on the severity of the disease and goes from observation in MEWDS and some mild cases of APMPPE, to oral corticosteroid and/or immunomodulator agents in the more severe conditions of APMPPE and MFC and SC cases. Close multimodal monitoring is crucial in order to introduce or adjust treatment.

Conclusion: PICCPs are resulting from one common clinicopathological mechanism, inflammatory choriocapillaris hypo- or non-perfusion. ICGA findings are essential for the diagnosis and follow-up of PICCPs, but non-invasive methods such as FAF and SD-OCT/OCT-A also have their role especially in follow-up of the diseases. Treatment should be individualized according to the pathology and the evolution of lesions.

Keywords: APMPPE; FA; ICGA; MEWDS; MFC; OCT-A; PICPPS; SC; SDOCT; non-infectious posterior uveitis.


Conflict of interest statement

The authors declare no conflict of interest.

Figures

Figure 1
Figure 1
Multimodal imaging signs in MEWDS. BL-FAF (top left) showing geographic and confluent areas of hyperautofluorescence indicating active lesions. ICGA (top right, different patient) showing patchy areas of hypofluorescence with peripapillary hypofluorescence causing severe visual field loss (insert). FA (middle left) faint hyperfluorescence on early (FA1) and late (FA2) frames. SD-OCT (bottom) showing loss of photoreceptor outer segments (between yellow arrows).
Figure 2
Figure 2
Multimodal imaging signs in APMPPE. Fundus (top left) shows numerous bilateral placoid discolored lesions, corresponding to ICGA hypofluorescent choriocapillary non-perfusion lesions (top right two frames). SD-OCT pictures show alteration and thickening of outer retina (ONL/photoreceptor IS/OS layer middle left picture, crimson arrow) and loss of photoreceptor IS/OS line (bottom left picture, between the two yellow arrows). BL-FAF shows hyperautofluorescence, indicating loss of photoreceptor outer segments as explained in paragraph 2.1 (bottom middle picture) OCT-A (bottom right picture) shows choriocapillary drop-out (dark areas).
Figure 3
Figure 3
Multimodal imaging signs in MFC. The ICGA (top two left frames) show numerous hypofluorescent dots in the intermediate angiographic phase, (top left) much better visualized in the late phase frame (ICGA-late). Some hypofluorescent lesions correspond also to the cicatricial lesions visible as hyperfluorescent punctiform spots on fluorescein angiography (bottom left). The BL-FAF picture (bottom middle) shows hyperautofluorescent areas corresponding to active lesions characterized by loss of photoreceptor outer segments shown on SD-OCT (bottom right, between two yellow arrows).
Figure 4
Figure 4
Multimodal imaging signs in SC. Typical fundus aspect of SC (top left); extensive central atrophy in a different case (middle left) with FA hyperfluorescent window effect (bottom left). Comparison of FA (top middle) and ICGA (top right) findings; ICGA hypofluorescence is much more widespread than FA hyperfluorescence, as it represents both atrophy and choriocapillaris non-perfusion of new lesions. Perilesional ICGA hyperfluorescent halo (yellow arrows) indicates progression of disease. OCT (bottom right) shows that at the border of atrophy, there is retinal oedema and damage to the outer retina (white arrow).
Figure 5
Figure 5
Clinicopathology of PICCPs according to vessel location of non-perfusion. Schematic drawing of the different levels of choriocapillaris vessels, the occlusions of which determine the type of choriocapillaritis. (Reproduced from Hayreh SS, Br J Ophthal 1973; 59:631, by permission of the BJO).
Figure 6
Figure 6
Clinicopathology of PICCPs according to size of non-perfused vessel. Schematic representation of the choriocapillaris with inner low-flow choriocapillaris (LFCC), the occlusion of which is at the origin of MEWDS. Occlusion of larger choriocapillaris vessels (CC) are at the origin of more severe conditions such as APMPPE, MFC or SC. (Reprinted by permission and modified from Petr Kolar, DOI:10.5772/53762) PhR = photoreceptors; OSPhR = outer segments of photoreceptors; RPE = retinal pigment epithelium.
Figure 7
Figure 7
Clinicopathology of PICCPs according to the suspected type and extension of vessel non-perfusion. Non-perfusion of low-flow endcapillary vessels cause the benign and reversible disease MEWDS. If larger choriocapillaris vessels or precapillary vessels are occluded the more severe diseases develop including APMPPE, MFC and SC.
Scheme 1
Scheme 1
Appraisal of MEWDS: decision tree in clinical practice. MEWDS: Multiple evanescent dots syndrome. S/L: slit lamp. A/C: anterior chamber. FAF: autofluorescence. SD-OCT: spectral domain optical coherence tomography. OCT-A: OCT-angiography. VF: visual fields. FA: fluoresceine angiography. ICGA: indocyanine green angiography. ICNV: inflammatory choroidal neovascularization. Anti-VEGF: anti-vascular endothelial growth factor.
Figure 8
Figure 8
(a) Illustrative case of MEWDS, multimodal imaging. Scattered areas of hypofluorescent dots seen on intermediate angiographic phase of ICGA (ICGA-int, top left), much better identified on the late phase frame (top middle, ICGA-late). FA (top right) shows faint hyperfluorescence in the same areas. BL-FAF shows hyperautofluorescent area corresponding to ICGA hypofluorescence due to loss of photoreceptor outer segments and better visualization of the normal RPE lipofuscin autofluorescence. Loss of photoreceptor outer segments is shown on the SD-OCT section between the yellow arrows (bottom right). (b) Illustrative case of MEWDS: OCT-A and microperimetry. Extensive areas of end-capillary non-perfusion on ICGA (top left) corresponding to hyperautofluorescence (top-middle) due to loss of photoreceptor outer segments as explained in paragraph 2.2. OCT-A of the MEWDS eye (OD) shows tiny areas of choriocapillary drop-outs. Although the Octopus® visual field was normal, microperimetry of the MEWDS eye showed a decreased retinal sensitivity (top right) compared to the fellow normal eye (bottom right).
Figure 9
Figure 9
(a) Case of APMPPE/AMIC with associated anterior uveitis. This patient presented with a bilateral non-granulomatous anterior uveitis with synechiae (right picture), a rare occurrence in APMPPE. The fundus showed bilateral placoid yellow lesions in the posterior pole (not shown) and discreet areas of ICGA hypofluorescence (left and middle pictures) that resolved without scars (not shown) following a short course of 40 mg of prednisone, tapered over 5 weeks. (b) Late FA pooling in a severe case of APMPPE/AMIC. In severe cases of APMPPE/AMIC, FA shows areas of abundant retinal pooling in the late angiographic phase (top picture). Traditionally this phenomenon is explained by the very hypothetical alleged change of polarity of the RPE and fluid movement from the choroid to the retina. However, the choriocapillaris areas under the retinal pooling are non-perfused (bottom picture). Therefore, a more probable origin of the fluid is exudation from retinal vessels in response to severe outer retinal ischemia.
Scheme 2
Scheme 2
Appraisal of APMPPE/AMIC: decision tree in clinical practice. S/L: slit lamp. A/C: anterior chamber. FAF: autofluorescence. SD-OCT: spectral domain optical coherence tomography. OCT-A: OCT-angiography. VF: visual fields. FA: fluoresceine angiography. ICGA: indocyanine green angiography. TB: tuberculosis. MFC: multifocal. APMPPE: acute posterior multifocal posterior placoid epitheliopathy. CNS: central neural system. Anti-VEGF: anti-vascular endothelial growth factor. ICNV: inflammatory choroidal neovascularization. IS: immunosuppressors. CsA: cyclosporine.
Figure 10
Figure 10
OCT of a patient with APMPPE. (A) OCT of left eye: Ischemia of outer retina is presented as an hyperreflective lesion (yellow arrow). A zone of subretinal fluid is also detected (blue arrow). Dilatation of inner retinal vessels leaving a shadow (red arrows). (B) OCT of the right eye also showed an hyperreflective zone in the outer retina (yellow arrow).
Figure 11
Figure 11
Multimodal imaging of APMPPE/AMIC. (A) Bilateral fundus pictures revealed whitish placoid lesions in the posterior pole and mid-periphery. (B) Same day late phase FA frames showed hyperfluorescence probably due to inner retinal vessel exudation. (C) ICGA late frames showed characteristic hypofluorescent patches, more widespread than the pathologic lesions seen on FA and BL-FAF (D).
Figure 12
Figure 12
Sequence of OCT-A frames from presentation to convalescent stage. OCT-A 6 × 6 en face scan of the posterior pole OD choriocapillaris showing progressive resolution from the first scan (top left) to last scan (bottom right). Dark areas of non-perfusion were partly re-perfused.
Scheme 3
Scheme 3
Appraisal of MFC: decision tree in clinical practice. PP: posterior pole. OCT: optical coherence tomography. iCNV: inflammatory choroidal neovascularization. BL-FAF: blue light autofluorescence. OCT-A: OCT-angiography. FA: fluorescence angiography. ICGA: indocyanine green angiography. HDDs: hypofluorescent dark dots. TB: tuberculosis. MEWDS: multiple evanescent white dots syndrome. APMPPE: acute posterior multifocal placoid pigment epitheliopathy. MFC: idiopathic multifocal choroiditis. IS: immunosuppressors. CsA: Cyclosporine. AZA: Azathioprine.
Figure 13
Figure 13
Idiopathic multifocal choroiditis, ICGA (top) and BL-FAF (bottom) findings. First episode of the right eye (a) in a period when left eye (b) showed no activity. ICGA OD (a top) showed characteristic hypofluorescent dots corresponding to the hyperautofluorescent dots in BL-FAF (a bottom), sign of activity.
Figure 14
Figure 14
Idiopathic multifocal choroiditis case, follow-up of recurrences. ICGA (top images), BL-FAF (bottom images). Recurrences of the left eye as the patient refused the systemic treatment (a,c) (b,d) images after treatment.
Figure 15
Figure 15
Idiopathic multifocal choroiditis. (A,B) Fundus aspect in last control, after 11 years of follow up. Scar lesions are outside the arcades of posterior pole (arrows). In (C), the fundus of the left eye 3 years before. Comparing (B) with (C), there are no additional scars for the last 3 years under systemic treatment.
Scheme 4
Scheme 4
Appraisal of serpiginous choroiditis: decision tree in clinical practice. S/L: slit lamp. A/C: anterior chamber. IGRA: Interferon Gamma release assays. FAF: autofluorescence. SD-OCT: spectral domain optical coherence tomography. OCT-A: OCT-angiography. VF: visual fields. FA: fluoresceine angiography. ICGA: indocyanine green angiography. TB: tuberculosis. MFC: multifocal. APMPPE: acute posterior multifocal posterior placoid epitheliopathy. CNS: central neural system. Anti-VEGF: anti-vascular endothelial growth factor. ICNV: inflammatory choroidal neovascularization. IS: immunosuppressors. CsA: cyclosporine. Anti-TNFa: anti-tumor necrosis factor-a.
Figure 16
Figure 16
Serpiginous choroiditis. SC at first presentation. Fundus (top left) shows a normal posterior pole OD and a central chorioretinal scar OS. SD-OCT OD (top right) shows only faint IS/OS interruption (yellow arrows) with a slightly diminished retinal sensitivity (insert: microperimetry value 374/560, see Figure 19). SD-OCT OS (middle right) shows numerous zones of damage to the photoreceptor outer segments and total chorioretinal atrophic areas with markedly diminished retinal sensitivity (insert: microperimetry value 246/560, see Figure 19). FA OD appears as normal, and FA OS shows the chorioretinal scar (hyperfluorescent window effect). ICGA-1 OD shows occult hypofluorescent areas of choriocapillaris non-perfusion while ICGA-1 OS shows hypofluorescent areas that extend beyond the chorioretinal atrophic areas indicating additional occult non perfusion. After 3 sub-Tenon’s injection bilaterally, ICGA-2 OD shows decrease of hypofluorescence indicating reperfusion especially on the late frame (right). Similarly, ICGA-2 OS shows decrease of hypofluorescence in the areas around the central chorioretinal atrophic area indicating reperfusion of these areas.
Figure 17
Figure 17
Serpiginous choroiditis. Recurrence of ICGA hypofluorescence 9 months after first presentation despite sub-Tenon’s injections of triamcinolone acetonide (40 mg). Initiation of triple immunosuppression (IS) is decided. FA-1 ODS before introduction of IS (top 4 frames) did not show occult increase of non-perfusion detected in both eyes by ICGA hypofluorescence (ICGA-1). After the introduction of IS, there was no change on FA (FA-2), while there was a marked reduction of hypofluorescence on ICGA (ICGA-2) especially on late frames, except for the irreversible chorioretinal atrophy OS.
Figure 18
Figure 18
Serpiginous choroiditis: CNVs OD. Seven years after introduction of IS, hypofluorescence is still kept under control, especially in ICGA late frames (ICGA-late). However, parafoveolar CNVs were detected: yellow arrow on FA (late hyperfluorescent spot), OCT-A (presence of signal in en face OCT-A of the choriocapillaris), SD-OCT (hyperreflective lesion with fluid) and ICGA (hyperfluorescent ring surrounded by hypofluorescent halo), which responded well to one intravitreal injection of anti—VEGF agent (not shown).
Figure 19
Figure 19
Serpiginous choroiditis: microperimetry follow-up. At presentation, there is a decrease of retinal sensitivity OD shown by microperimetry (374/560, top left), due to occult choriocapillaris hypo-perfusion seen on ICGA (see Figure 16). On the left side (top right), there is a substantial decrease of retinal sensitivity mainly due to chorioretinal atrophy (246/560, top right, see Figure 16). After 8 years of follow-up, under IS retinal sensitivity recovered OD (420/560, bottom left) and only slightly decreased OS (224/560, bottom right), indicating efficiency of prolonged IS.
Figure 20
Figure 20
Non-classifiable case of choriocapillaritis. A middle-aged man was diagnosed as “unilateral APMPPE” OS (Top two frames) with a severe drop of vision after a flu-like episode. The doctors refrained from immunosuppressive treatment as “APMPPE is a self-limited disease” but macular atrophy ensued (bottom two frames). His right eye underwent the same evolution, less than a month later and the patient consulted another hospital where again nothing was undertaken as “APMPPE is a self-limited disease”. We saw the patient a few weeks later with macular atrophy OS and partial atrophy with choriocapillaris non-perfusion on ICGA OD (middle left picture- pre-CS) Systemic corticosteroid therapy was started, allowing to recover some areas of non-perfusion (middle right-post CS), but with a final low visual acuity. The first ICGA (top two frames) clearly showed choriocapillaris disease, which could, however, not be classified into one of the known entities.

Similar articles

Cited by

References

    1. Herbort C.P., Jr., Mantovani A., Tugal-Tutkun I., Papasavvas I. Classification of Non-Infectious and/or Immune Mediated Choroiditis: A Brief Overview of the Essentials. Diagnostics. 2021;11:939. doi: 10.3390/diagnostics11060939. - DOI - PMC - PubMed
    1. Neri P., Herbort C.P., Jr., Hedayatfar A., Tugal-Tutkun I., Cimino L., Urzua C.A., Papasavvas I., Takeuchi M., Lages V. “White dot syndromes”, an inappropriate and outdated misnomer. Int. Ophthalmol. 2021:1–6. doi: 10.1007/s10792-021-02121-4. - DOI - PubMed
    1. Testi I., Modugno R.L., Pavesio C. Multimodal imaging supporting the pathophysiology of white dot syndromes. J. Ophthalmic Inflamm. Infect. 2021;11:32. doi: 10.1186/s12348-021-00261-3. - DOI - PMC - PubMed
    1. Meyer R.J., Jampol L.M. Recurrences and bilaterality in the multiple evanescent white-dot syndrome. Am. J. Ophthalmol. 1986;101:388–389. doi: 10.1016/0002-9394(86)90850-0. - DOI - PubMed
    1. Herbort C.P., Jr., Tugal-Tutkun I., Mantovani A., Neri P., Khairallah M., Papasavvas I. Advances and potential new developments in imaging techniques for posterior uveitis Part 2: Invasive imaging methods. Eye. 2021;35:52–73. doi: 10.1038/s41433-020-1072-0. - DOI - PMC - PubMed

MeSH terms

LinkOut - more resources