. 2022 Jan 25;10(2):274.
doi: 10.3390/microorganisms10020274.

Morphological Phenotypes, Cell Division, and Gene Expression of Escherichia coli under High Concentration of Sodium Sulfate

Affiliations

Morphological Phenotypes, Cell Division, and Gene Expression of Escherichia coli under High Concentration of Sodium Sulfate

Khanh Nguyen et al. Microorganisms. .

Abstract

Sodium and sulfate ions are among the suggested abundant ions on Europa, a moon of Jupiter. In order to investigate the potential habitability of Europa, we study the effects of sodium sulfate (Na2SO4) on a non-halophilic bacterium by subjecting Escherichia coli (E. coli) to a wide range of Na2SO4 concentrations (0-1.0 m). We discover that, as the concentration of sodium sulfate increases, the biomass doubling time increases and the cell growth is completely inhibited at 1.0 m Na2SO4. Furthermore, we find that E. coli exhibits three distinct morphological phenotypes-(i) shortened, (ii) normal, and (iii) elongated/filamented cells at 0.6 m and 0.8 m Na2SO4. We have examined the expression of different genes involved in sodium and sulfate transport (nhaA, nhaB, cysZ, sbp), osmotically driven transport of water (aqpZ), sulfate metabolism (cysN), fatty acid production (fabA), and a global transcriptional regulator (osmZ). Our results suggest that the expression of these genes is not affected significantly at high concentrations of sodium sulfate in the exponential growth phase. Using our experimental data and the existing data in the literature, we show that the osmotic pressure difference may play a major role in determining the growth inhibition of E. coli and B. subtilis at high concentrations of salt.

Keywords: cellular response of Escherichia coli under hyperosmolar stress; habitability of Europa; sodium sulfate.


Conflict of interest statement

The authors declare no conflict of interest.

Figures

Figure 1
Figure 1
Schematic of the cell membrane and membrane proteins such as ion channels, carrier proteins, and receptors. Cells interact with the external environment via membrane proteins.
Figure 2
Figure 2
Schematic of the experimental setup used to measure the optical density, OD488, of bacteria in real time.
Figure 3
Figure 3
(A) Linear-log plot of the growth curves of E. coli at different concentrations of Na2SO4. (B) Biomass doubling time, τd, of bacteria as a function of salt concentration. The biomass doubling time, τd, is calculated by fitting exponential curves through the data points (shown as solid lines in A) in the exponential growth phase. (C) Survival fraction of bacteria as a function of Na2SO4 concentration.
Figure 4
Figure 4
Representative images of cells at different concentrations (A) 0 m (control), (B) 0.2 m, (C) 0.4 m, (D) 0.6 m, (E) 0.8 m, and (F) 1.0 m of Na2SO4.
Figure 5
Figure 5
Probability distribution function, P(), of cell length, , for Na2SO4 concentrations: (A) 0 m, (B) 0.2 m, (C) 0.4 m, (D) 0.6 m, (E) 0.8 m, and (F) 1.0 m. The cell length distribution exhibits large heterogeneities at high concentrations of sodium sulfate. For 1.0 m Na2SO4, the bacterial cells do not exhibit any growth, and the cell length becomes smaller, presumably due to water efflux. Coefficient of variation (CV) of the probability distributions for all the salt concentrations are also shown.
Figure 6
Figure 6
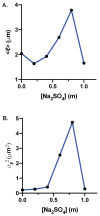
(A) Average cell length, , as a function of sodium sulfate concentration. decreases slightly at 0.2 m and 0.4 m, then it increases monotonically between 0.4 m and 0.8 m, and becomes smaller at 1.0 m Na2SO4. (B) Variance of the cell length, σ2, as a function of sodium sulfate concentration. The variance increases monotonically with Na2SO4 concentration up to 0.8 m.
Figure 7
Figure 7
Time-lapse images of cells obtained at 0.8 m Na2SO4 and subsequently grown on a thin LB-agar chamber without sodium sulfate.
Figure 8
Figure 8
Comparative expression of various genes involved in water transport (aqpZ), sodium transport (nhaA, nhaB), sulfate transport (cysZ, sbp), sulfate metabolism (cysN), a global transcriptional regulator (osmZ), and fatty acid production (fabA). We do not find significant changes in the expression of these genes (ΔΔCt0.5) at high salt concentration during the exponential growth phase. cysZ and nhaB exhibit slight upregulation within the error bar. However, this is not conclusive from our data due to large error bar with the ΔΔCt0.5.
Figure 9
Figure 9
(A) Water activity, aW, and (B) osmotic pressure, Π, as a function of concentration of aqueous solutions of sodium and magnesium sulfate at T = 37 C, computed using the Pitzer model.
Figure 10
Figure 10
Osmotic pressure, Π, as a function of concentration of aqueous solutions of various salts at T = 37 C, computed using the Pitzer model. We also show the osmotic pressures corresponding to the limiting salt concentrations of growth of E. coli and B. subtilis.

References

    1. Yayanos A.A., Dietz A.S., Van Boxtel R. Dependence of reproduction rate on pressure as a hallmark of deep-sea bacteria. Appl. Environ. Microbiol. 1982;44:1356–1361. doi: 10.1128/aem.44.6.1356-1361.1982. - DOI - PMC - PubMed
    1. Kato C., Sato T., Horikoshi K. Isolation and properties of barophilic and barotolerant bacteria from deep-sea mud samples. Biodivers. Conserv. 1995;4:1–9. doi: 10.1007/BF00115311. - DOI
    1. Brock T.D., Freeze H. Thermus aquaticus gen. n. and sp. n., a nonsporulating extreme thermophile. J. Bacteriol. 1969;98:289–297. doi: 10.1128/jb.98.1.289-297.1969. - DOI - PMC - PubMed
    1. Huston A.L., Krieger-Brockett B.B., Deming J.W. Remarkably low temperature optima for extracellular enzyme activity from Arctic bacteria and sea ice. Environ. Microbiol. 2000;2:383–388. doi: 10.1046/j.1462-2920.2000.00118.x. - DOI - PubMed
    1. Antón J., Oren A., Benlloch S., Rodríguez-Valera F., Amann R., Rosselló-Mora R. Salinibacter ruber gen. nov., sp. nov., a novel, extremely halophilic member of the Bacteria from saltern crystallizer ponds. Int. J. Syst. Evol. Microbiol. 2002;52:485–491. doi: 10.1099/00207713-52-2-485. - DOI - PubMed

LinkOut - more resources