. 2022 Feb 8;10(2):391.
doi: 10.3390/microorganisms10020391.

Investigating Morphological Changes of T-lymphocytes after Exposure with Bacterial Determinants for Early Detection of Septic Conditions

Affiliations

Investigating Morphological Changes of T-lymphocytes after Exposure with Bacterial Determinants for Early Detection of Septic Conditions

Kari Lavinia Vom Werth et al. Microorganisms. .

Abstract

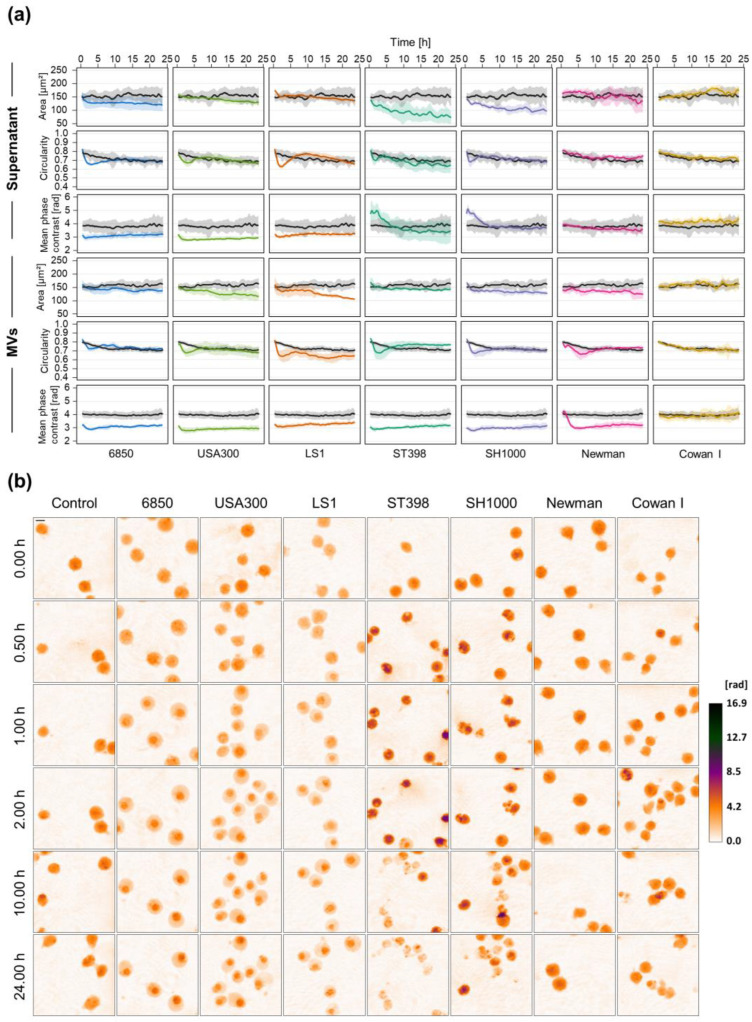
Sepsis is a leading cause of morbidity and mortality, annually affecting millions of people worldwide. Immediate treatment initiation is crucial to improve the outcome but despite great progress, early identification of septic patients remains a challenge. Recently, white blood cell morphology was proposed as a new biomarker for sepsis diagnosis. In this proof-of-concept study, we aimed to investigate the effect of different bacteria and their determinants on T-lymphocytes by digital holographic microscopy (DHM). We hypothesize that species- and strain-specific morphological changes occur, which may offer a new approach for early sepsis diagnosis and identification of the causative agent. Jurkat cells as a model system were exposed to different S. aureus or E. coli strains either using sterile determinants or living bacteria. Time-lapse DHM was applied to analyze cellular morphological changes. There were not only living bacteria but also membrane vesicles and sterile culture supernatant-induced changes of cell area, circularity, and mean phase contrast. Interestingly, different cellular responses occurred depending on both the species and strain of the causative bacteria. Our findings suggest that investigation of T-lymphocyte morphology might provide a promising tool for the early identification of bacterial infections and possibly discrimination between different causative agents. Distinguishing gram-positive from gram-negative infection would already offer a great benefit for the proper administration of antibiotics.

Keywords: T-lymphocyte; cell morphology; digital holographic microscopy; sepsis.


Conflict of interest statement

The authors declare no conflict of interest.

Figures

Figure 1
Figure 1
Cellular changes of Jurkat cells exposed to supernatant or MVs derived from different S. aureus strains. Jurkat cells were treated with 5% (v/v) sterile culture supernatant or 20 µg/mL MVs of different S. aureus strains. Untreated cells served as control. Cellular changes were monitored by time-lapse DHM. (a) DHM quantitative phase contrast images were analyzed for the average single-cell area (µm2), average circularity (AU), and mean phase contrast (rad) per cell. Results are presented as mean (lines) ± SD (shading) of at least three independent experiments. Controls are depicted in black while different colors designate the individual strains. For better visualization, curves were smoothed using moving averages with a window size of 15 measuring points. (b) Representative color-coded phase contrast images of Jurkat cells at indicated time points after the addition of bacterial supernatant. The scale bar corresponds to 10 μm. The calibration bar indicates phase contrast values in radian.
Figure 2
Figure 2
Concentration-dependent effect of S. aureus strain 6850 culture supernatant on Jurkat cell morphology. Jurkat cells were treated with different concentrations of sterile culture supernatant derived from S. aureus strain 6850. Untreated cells served as control. Time-lapse DHM was applied to investigate dynamic morphological changes. (a) DHM quantitative phase contrast images were analyzed for the average single-cell area (µm2), average circularity (AU), and mean phase contrast (rad) per cell. Results represent mean (lines) ± SD (shading) of at least three independent experiments. Controls are shown in black while different colors indicate different concentrations of supernatant. For better visualization, curves were smoothed using moving averages with a window size of 15 measuring points. (b) Representative color-coded phase contrast images of Jurkat cells at indicated time points after the addition of bacterial supernatant. The scale bar corresponds to 10 μm. The calibration bar indicates phase contrast values in radian.
Figure 3
Figure 3
Morphological changes of Jurkat cells after infection with living S. aureus depend on strain and bacterial load. Jurkat cells were infected with different S. aureus strains (MOI 10; (a)) or different bacterial loads of S. aureus strain 6850 (b). After 4 h, bacteria were removed by centrifugation and Lysostaphin treatment (2 µg/mL) to prevent overgrowth. Time-lapse DHM was started at 5 h p.i. and mock-infected cells served as control. (a,b) DHM quantitative phase contrast images were analyzed for the average single-cell area (µm2), average circularity (AU), and mean phase contrast (rad) per cell. Results represent mean (lines) ± SD (shading) of at least three independent experiments. Controls are depicted in black while different colors mark the individual strains (a) or different bacterial loads (b). For better visualization, curves were smoothed using moving averages with a window size of 15 measuring points. (c) Representative color-coded phase contrast images of Jurkat cells infected with S. aureus strain 6850 at indicated time points after infection. The scale bar corresponds to 10 μm. The calibration bar indicates phase contrast values in radian.
Figure 4
Figure 4
Culture supernatant but not MVs derived from different E. coli strains induce morphological changes in Jurkat cells. Jurkat cells were exposed to 25% (v/v) sterile culture supernatant (a) or 20 µg/mL MVs (b) of different E. coli strains. Untreated cells served as control. Time-lapse observation of morphological changes was carried out using DHM. (a,b) DHM quantitative phase contrast images were analyzed for the average single-cell area (µm2), average circularity (AU), and mean phase contrast (rad) per cell. Results are shown as mean (lines) ± SD (shading) of at least three independent experiments. Controls are presented in black while different colors designate the individual strains. For better visualization, curves were smoothed using moving averages with a window size of 15 measuring points. (c) Representative color-coded phase contrast images of Jurkat cells at indicated time points after the addition of E. coli culture supernatant. The scale bar corresponds to 10 μm. The calibration bar indicates phase contrast values in radian.
Figure 5
Figure 5
Early cellular changes of Jurkat cells infected with living E. coli. Jurkat cells were infected with different E. coli strains (MOI 10) and DHM was started directly after the addition of the bacteria. Mock-infected cells served as control. (a) DHM quantitative phase contrast images were analyzed for the average single-cell area (µm2), average circularity (AU), and mean phase contrast (rad) per cell. Results are shown as mean (lines) ± SD (shading) of at least three independent experiments. Controls are depicted in black while different colors represent the individual strains. For better visualization, curves were smoothed using moving averages with a window size of 2 measuring points. (b) Representative color-coded phase contrast images of Jurkat cells at indicated time points after the addition of bacteria. The scale bar corresponds to 10 μm. The calibration bar indicates phase contrast values in radian.
Figure 6
Figure 6
Morphological changes of Jurkat cells infected with E. coli strains IHE3034 or MG1655. Jurkat cells were infected with E. coli strains IHE3034 or MG1655 (MOI 10). After 4 h, bacteria were removed by centrifugation and Gentamicin treatment (50 µg/mL) to prevent overgrowth. Mock-infected cells served as control. DHM measurement was started at 5 h p.i. to monitor cellular morphological changes. (a) DHM quantitative phase contrast images were analyzed for the average single-cell area (µm2), average circularity (AU), and mean phase contrast (rad) per cell. Results represent mean (lines) ± SD (shading) of at least three independent experiments. Controls are shown in black while different colors designate the individual strains. For better visualization, curves were smoothed using moving averages with a window size of 15 measuring points. (b) Representative color-coded phase contrast images of Jurkat cells at indicated time points after infection. The scale bar corresponds to 10 μm. The calibration bar indicates phase contrast values in radian.

References

    1. Singer M., Deutschman C.S., Seymour C., Shankar-Hari M., Annane D., Bauer M., Bellomo R., Bernard G.R., Chiche J.D., Coopersmith C.M., et al. The Third International Consensus Definitions for Sepsis and Septic Shock (Sepsis-3) JAMA. 2016;315:801–810. doi: 10.1001/jama.2016.0287. - DOI - PMC - PubMed
    1. Rudd K.E., Johnson S.C., Agesa K.M., Shackelford K.A., Tsoi D., Kievlan D.R., Colombara D.V., Ikuta K.S., Kissoon N., Finfer S., et al. Global, Regional, and National Sepsis Incidence and Mortality, 1990–2017: Analysis for the Global Burden of Disease Study. Lancet. 2020;395:200–211. doi: 10.1016/S0140-6736(19)32989-7. - DOI - PMC - PubMed
    1. Liu V.X., Fielding-Singh V., Greene J.D., Baker J.M., Iwashyna T.J., Bhattacharya J., Escobar G.J. The Timing of Early Antibiotics and Hospital Mortality in Sepsis. Am. J. Respir. Crit. Care Med. 2017;196:856–863. doi: 10.1164/rccm.201609-1848OC. - DOI - PMC - PubMed
    1. Ferrer R., Martin-Loeches I., Phillips G., Osborn T.M., Townsend S., Dellinger R.P., Artigas A., Schorr C., Levy M.M. Empiric Antibiotic Treatment Reduces Mortality in Severe Sepsis and Septic Shock From the First Hour. Crit. Care Med. 2014;42:1749–1755. doi: 10.1097/CCM.0000000000000330. - DOI - PubMed
    1. Kumar A., Ellis P., Arabi Y., Roberts D., Light B., Parrillo J.E., Dodek P., Wood G., Kumar A., Simon D., et al. Initiation of Inappropriate Antimicrobial Therapy Results in a Fivefold Reduction of Survival in Human Septic Shock. Chest. 2009;136:1237–1248. doi: 10.1378/chest.09-0087. - DOI - PubMed

LinkOut - more resources